Colorado's increase of 0.4 percent was above the national index's increase of 0.29.
According to the March 2012 report:
The Federal Reserve Bank of Philadelphia has released the coincident indexes for the 50 states for March 2012. In the past month, the indexes increased in 48 states, decreased in one state (Rhode Island), and remained stable in one state (South Dakota), for a one-month diffusion index of 94. Over the past three months, the indexes increased in all 50 states, for a three-month diffusion index of 100. For comparison purposes, the Philadelphia Fed has also developed a similar coincident index for the entire United States. The Philadelphia Fed’s U.S. index rose 0.3 percent in March and 0.9 percent over the past three months.
March's month-over-month increase was the 18th increase in a row for Colorado, and was the longest stretch of monthly increases reported since 2007.
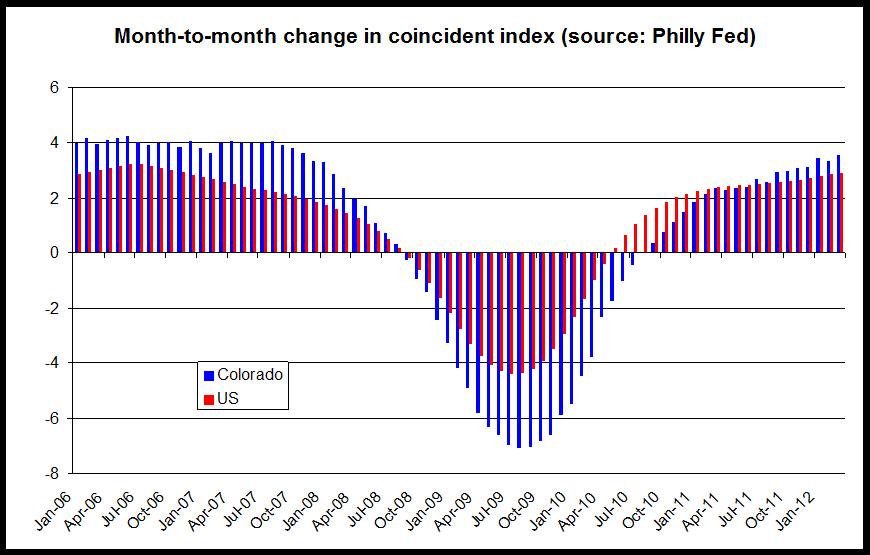
The graph below compares the month-to-month change in both the Colorado Index and the US index. In recent months, the growth rate in Colorado has begun to outpace that of the nation.
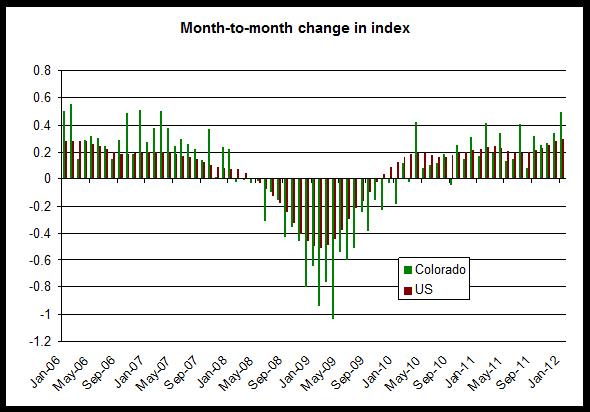
The second graph shows year-over-year changes in the index, and an upward trend is evident here as well:
Overall, this report reinforces earlier data showing ongoing slow and steady increases in real estate demand and employment.
The coincident indexes combine four state-level indicators to summarize current economic conditions in a single statistic. The four state-level variables in each coincident index are nonfarm payroll employment, average hours worked in manufacturing, the unemployment rate, and wage and salary disbursements deflated by the consumer price index (U.S. city average). The trend for each state’s index is set to the trend of its gross domestic product (GDP), so long-term growth in the state’s index matches long-term growth in its GDP.