The Division of Housing
today released 2011's fourth quarter report on vacancies and rents. The report includes data for 6 metropolitan areas of the state.
For analysis of the Denver metro area,
see here. For Colorado Springs,
see here.
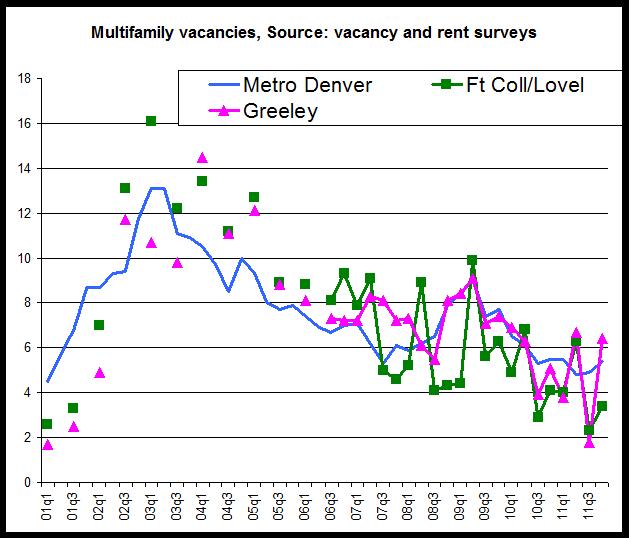
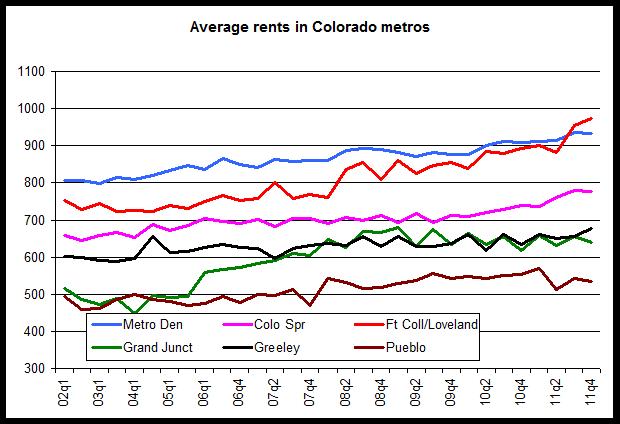
Northern ColoradoThe vacancy rates in both the Greeley and the Ft. Collins/Loveland areas have been below the metro Denver rate for 4 of the past 6 quarters, and have tended to be below the metro Denver rate since the third quarter of 2009. Between 2002 and 2009, the Greeley and Ft. Coll/Loveland areas tended to have vacancies above the metro Denver rate.
The tightening of the northern Colorado multifamily markets is due at least in part to the well-performing labor market in the Fort Collins-Loveland metro area. During December 2011, when the 4th quarter vacancy rate was conducted, The Ft. Collins-Loveland area had an unemployment rate of 6.3 percent, and with the exception of the Boulder area, it has the most robust labor market in Colorado. Total employment in the Ft. Collins-Loveland area is now only 3.2 percent below peak employment levels experienced during the last economic expansion.
Strong employment has driven a strong demand for multi-family housing in the region.
The Greeley area also has reported improvements in employment, but not to the extent seen in the Ft. Collins-Loveland area. Nevertheless, the market has generally tightened in the Greeley area as well due to the close proximity of Greeley to the Ft. Collins area. Renters looking for more affordable alternatives to rental housing in the Ft. Collins area then look to housing in the Greeley area. Greeley however, was particularly hard hit by foreclosures, and the existence of a large number of single-family rental houses in the wake of foreclosures can act to cause volatility in multi-family vacancies.
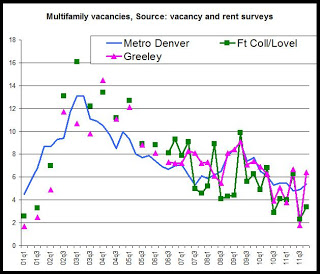
During the fourth quarter of 2011, Greeley was the only metro area in Colorado that showed a year-over-year increase in the vacancy rate. Although several factors likely contributed to this, it is likely that a surge in rent levels increased turnover in the region. This is a common effect seen when apartment owners, following several quarters of flat or declining rents, attempt to push rents following a decline in vacancy rates. The resulting rent increases then temporarily increase turnover, and increase the vacancy rate for a time. In Greeley, the rise in the vacancy rate during the fourth quarter followed a substantial drop in the vacancy rate during the third quarter of 2011 to 1.8 percent. It is likely that owners attempted to push rents following such a tight market as seen during the third quarter. The higher rent levels increased turnover which is reflected in the fourth quarter's vacancy rate of 6.4 percent.
In Greeley, year-over-year rent growth during the fourth quarter of 2011, at 7 percent, was the largest rate of growth experienced since the third quarter of 2004. Among other metro areas during the fourth quarter of 2011, only the Fort Collins area reported a larger rate of year-over-year growth with an increase of 9.1 percent in rent. However, Ft. Collins, with a stronger job market than Greeley, did not experience an increase in vacancies due to increasing rent levels.
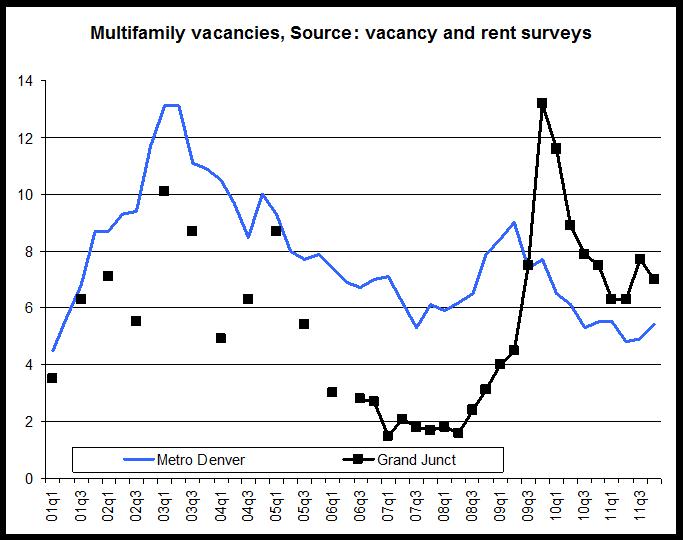
The Grand Junction Area Housing markets in the Grand Junction area have behaved very differently from other metro areas in recent years. From 2005 through 2008, vacancy rates were driven down to very low rates of 1.5 to 3 percent during many quarters as a result of a boom in rental housing demand. The demand was driven by new oil and gas jobs that were being created in the region during that time. However, following the financial crisis of 2008 and the departure of many oil and gas jobs, the vacancy rate surged to over 13 percent during the fourth quarter of 2009. It has since come down and has been mirroring over state trends since late 2010.
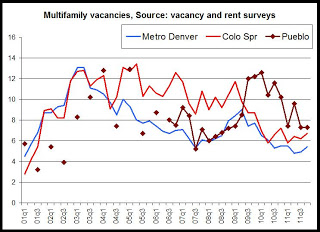
The second graph shows that the Grand Junction rate has been above the metro Denver vacancy rate since the third quarter of 2009. Local property managers report that conditions are stabilizing in the region, and that some small rent increases are being reported in the area.
During the fourth quarter of 2011, the vacancy report shows that year over year rent growth, at 3.8 percent, was at the highest rate reported since the first quarter of 2009.
 Southern Colorado
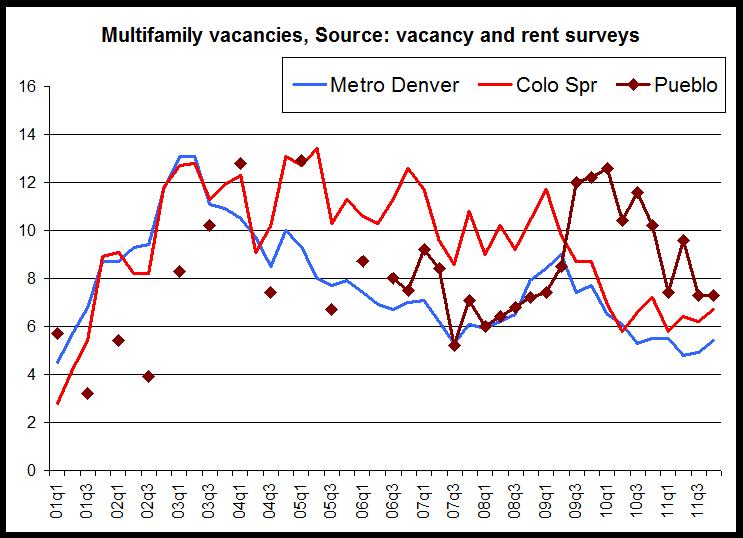
The vacancy rates in both Pueblo and Colorado Springs have been above the metro Denver vacancy rate since the third quarter of 2010. Over the past decade, the Colorado Springs vacancy rate has tended to be well above the metro Denver vacancy rate during most quarters. In recent quarters, the Colorado Springs area has declines to ten-year lows. The Pueblo vacancy rate surged above 12 percent during late 2009 and early 2010, and has only slowly fallen to rates seen during the middle of the past decade.
The Pueblo vacancy rate was 7.3 percent during the fourth quarter of 2011, making it the metro area with the highest vacancy rate.
At the same time, the fourth quarter vacancy rate in Colorado Springs has fallen to the lowest fourth-quarter rate reported in 12 years.
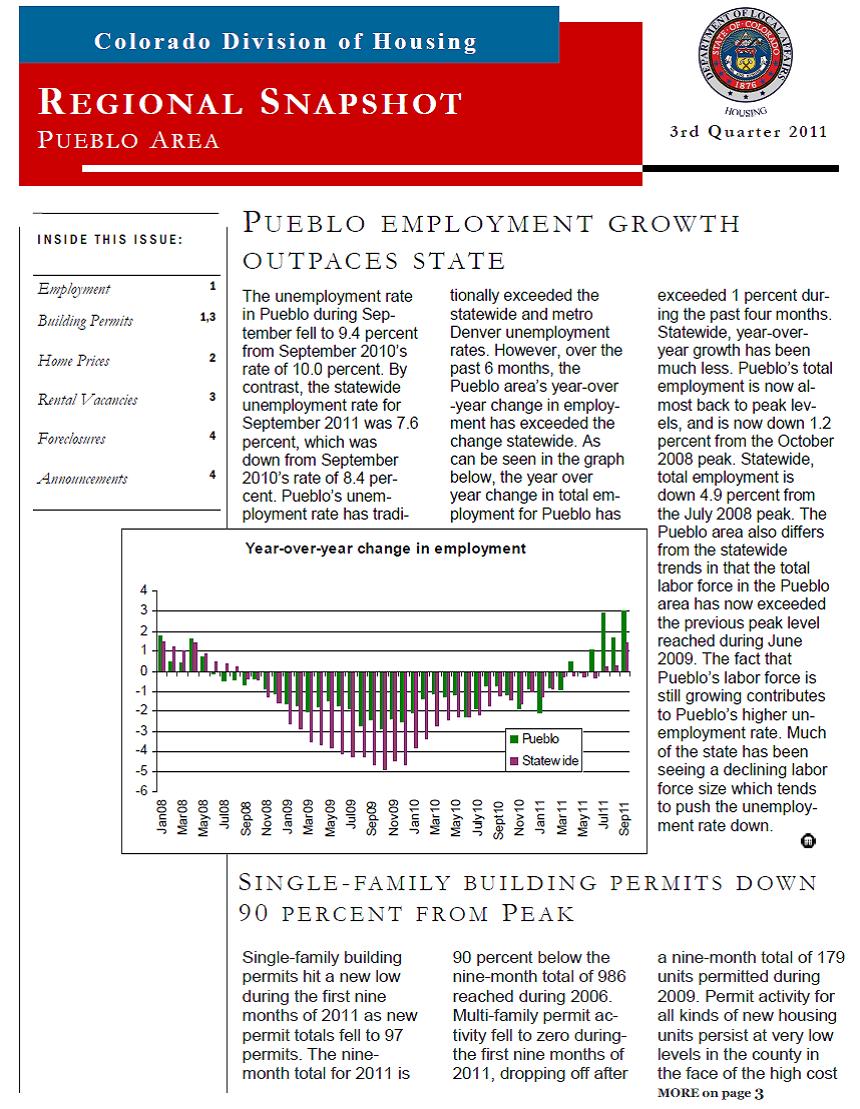
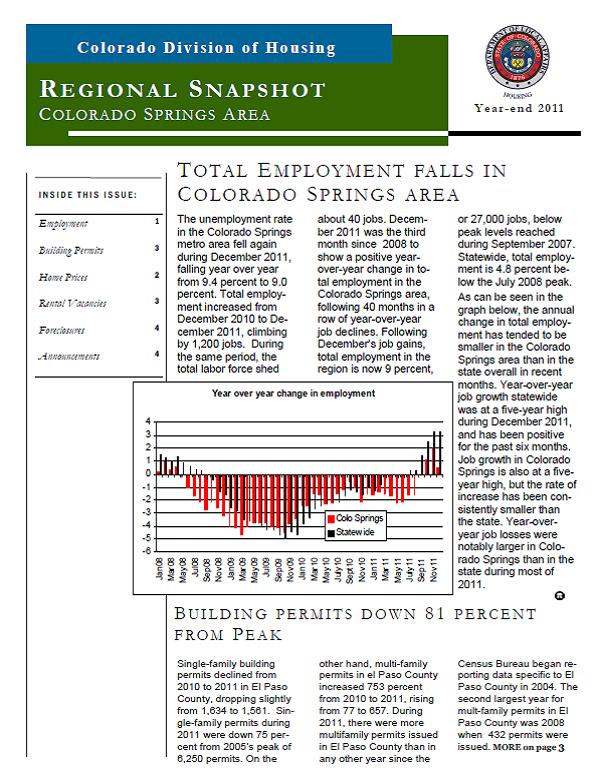
The Pueblo area's multifamily markets continue to struggle in the face of a weak job market. With a December unemployment rate of 9.8 percent, Pueblo had the highest unemployment of any metro area in Colorado, suppressing demand for multifamily housing.
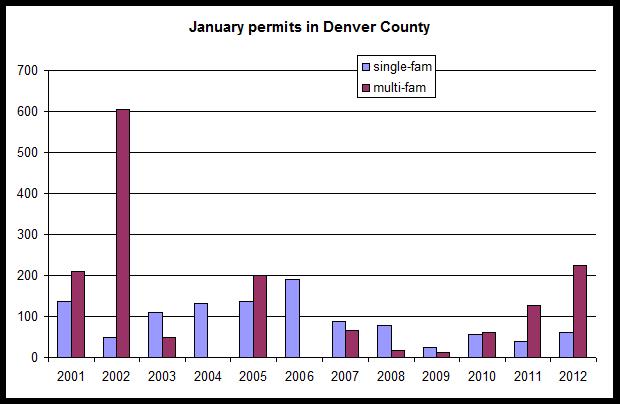
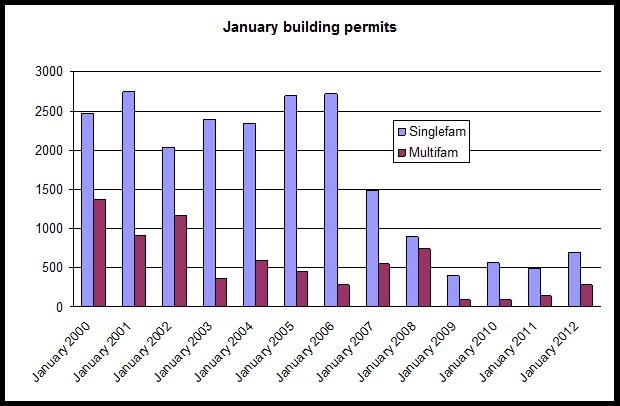
The Colorado Springs area's multifamily owners have benefited from increase troop movements into the area coupled with very little new production in new multifamily housing. El Paso County reported some of the highest multifamily permitting numbers during 2011, but few of those units have yet been completed.
 Rent Growth
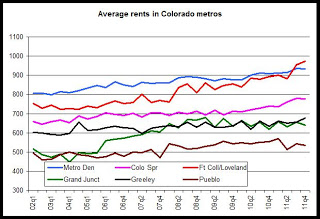
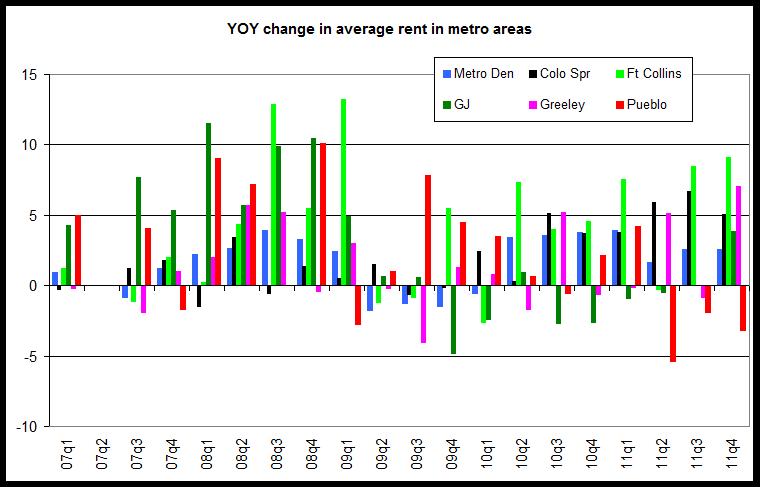
 Year-over-year rent growth was positive in all metro areas except the Pueblo area. Growth in the Ft. Collins-Loveland area and the Greeley area were particularly strong while Grand Junction rent growth turned positive for the first time in six quarters. The fourth graph shows year-over-year rent growth for each region.
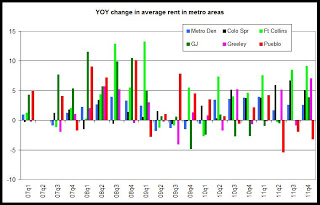
The last graph shows the relative rent levels in each metro area. Notably, the average rent in the Ft. Collins-Loveland area has moved above the metro Denver area's average rent during the past two quarters. This ends a well-established historical trend in which Metro Denver had the highest average rent among all metro areas. Pueblo has had the lowest average rent among the metro areas since 2006 when Grand Junction's average rent moved above Pueblo's rent level.