According to the MBA, the number of loans services in Colorado has been in a state of nearly constant decline since the fourth quarter of 2007 when total loans peaked at approximately 1,040,000 loans. Since then, total loans serviced has declined by 7 percent, dropping to approximately 966,800 during the fourth quarter of 2011.
The first graph shows the decline over the past four years along with the trend in the total number of loans in the foreclosure process.
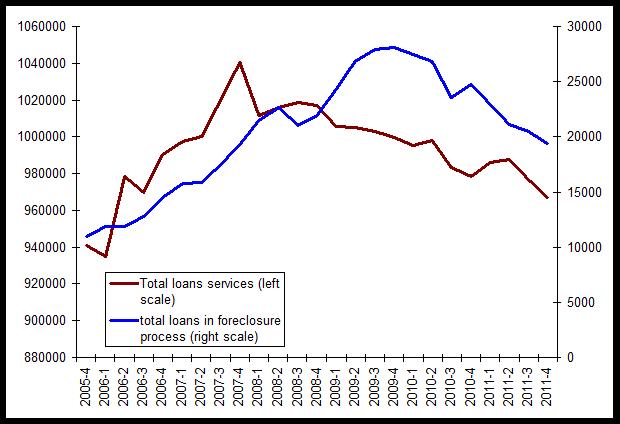
We can note that from 2005 to 2008, while the number of loans in the foreclosure process was growing, the total number of loans being serviced also increased. That is, growth in new loans continued during the period even as foreclosure activity increased. It wasn't until 2008 that total loans serviced began to decline, and the total foreclosure inventory would not peak until the fourth quarter of 2009 at 28,000 loans. Since then, both the total number of loans serviced and the number of loans in foreclosure has fallen most quarters.
The Division of Housing has monitored foreclosure filings and foreclosure sales at auction in Colorado since the first quarter of 2007.
The total number of foreclosure sales at auction in a single quarter peaked back during the third quarter of 2007 at 7,117 sales. Since then, there has rarely been a quarter with more than 6,000 auction sales, and totals have generally ranged between 5,000 and 5,800.
In other words, while foreclosure auction sales show no sustained increases from early 2007 to late 2009, the foreclosure inventory in Colorado increased more than 75 percent.
The result has been a situation in which foreclosure auction sales were flat while total foreclosure inventory grew, leading to a substantial drop in the proportion of the foreclosure inventory that proceeded to sale at auction during a given quarter.
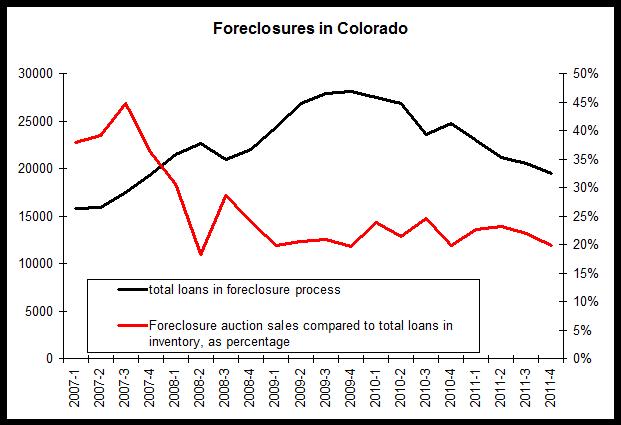
The second graph shows foreclosure auction sales as a percentage of all loans in foreclosure. Also shown is the total number of loans in the foreclosure process.
As the total foreclosure inventory grew between 2007 and 2009, total auction sales showed no clear trend, either up or down. This led to a significant decline in the percentage of all foreclosing loans that went to auction sale during the quarter.
In the second graph, we see that since 2009, the proportion of loans in foreclosure that proceeded to auction sales has been largely stable between 20 and 25 percent.
So what does this mean? Since 2007, a rise in the total number of loans in the foreclosure inventory has not led to a similar rise in the number of foreclosure sales at auction in each quarter. What this tells us is that since 2007, it is likely that the majority of loans that enter the foreclosure process later exit the foreclosure process through some means other than a foreclosure sale at auction. Since the total number of foreclosure sales has not been more than 25 percent of the total number of loans in foreclosure during any quarter since 2008, it appears that over time, foreclosure sales have been the fate of a minority of foreclosing loans. It is likely that foreclosure is being avoided through other means such as loan modifications and short sales.
Method: The foreclosure inventory data is based on the national delinquency survey published by the Mortgage Bankers Association. MBA states that its survey covers more than 80 percent of outstanding mortgage loans. This analysis assumes that survey penetration has not changed substantially over time.
Foreclosure auction sales totals are taken from the Division of Housing's quarterly foreclosure reports.