Thursday, May 26, 2011

Bankruptcy filings in Colorado down 6 percent in April

In Colorado during April, total bankruptcy cases filed fell 6.2 percent to 3,103 cases. During April 2010, 3,301 cases were filed. April was the third month in a row in which bankruptcies declined, year-over-year, and it marks only the fourth time in at least four years that a monthly bankruptcy total has been lower than the same month one year earlier.

The first graph shows the year-over-year changes in bankruptcy case filings since January 2007:


The appearance of some small declines in the year-over-year comparisons may signal that consumers are beginning to get a handle on consumer debt more than three years after the beginning of the national 2007-2009 recession. The slow decline in the magnitude of year-over-year changes may also signal some stability in household incomes and budgets following a period of increasing insolvency.

In general, however, bankruptcy filings have grown since 2006 following the implementation of the 2005 Bankruptcy Act (discussed here).

The large spike in 2005 preceded the implementation of the new bankruptcy rules. Filings totals have now returned to the levels experienced just prior to the final run-up in cases in 2005.


Recent monthly bankruptcy totals are now on a level similar to what was experienced during April 2004 and 2005, during a non-recessionary period. April tends to be a peak month for bankruptcy filings as people use their tax refunds to pay for bankruptcy attorneys and filing costs.

Housing News Digest, May 26

New report: Rental properties harder to find, more expensive (9News + video)
DENVER - A new report by the Colorado Division of Housing is bringing bad news for anyone trying to find an affordable place to live in the metro area, especially Boulder.

The Colorado Statewide Vacancy and Rent Study outlined the vacancy rates and average rent for several cities and counties in the state during the first-quarter of this year.

Rental market for houses, condos tight (Boulder County Business Report)
DENVER - Renters looking for houses or condos had better look outside Boulder County, according to a report released Tuesday by the Colorado Division of Housing.

The metro Denver vacancy rate for rentable condos, single-family homes and other small properties fell to a new low of 1.4 percent during the first quarter of 2011.

Foreclosures 30% of sales
Foreclosures accounted for just under 30 percent of all Colorado home sales in the first quarter, according to a national report released today.The report by Irvine, Calif.-based RealtyTrac, showed that nationally, 27.5 percent of all home sales in the first three months of the year were foreclosures. There were 4,032 foreclosure sales in Colorado in the first quarter in Colorado, accounting 2.5 percent of the 158,434 nationally.

O'Connor: Spring housing market not so bad
“Both in year-over-year and month-to-month, we’re seeing much the same market that we did in 2010,” said O’Connor, who released a report that included real estate data through the end of April, as well as the first week of May. “However, we’ve witnessed a drop in inventory of around 9.6% over the year that will help sustain prices in many ranges, and the future as some expected job growth returns will almost certainly improve.” O’Connor used Metrolist data, as did an earlier report by independent broker Gary Bauer.

Mortgage rates hit new lows for 2011
The 30-year, fixed-rate mortgage rate fell to 4.60% in the most recent Freddie Mac Primary Mortgage Market Survey, reaching a new low for 2011.

That compares to a rate of 4.61% a week earlier and 4.84% last year. The 15-year, FRM followed suit, averaging 3.78%, down from 3.8% a week earlier and 4.21% last year.

Wednesday, May 25, 2011

FHFA: House prices in every Colorado metro area fall in first quarter

The House Price Index (HPI) fell from the first quarter of 2010 to the same period this year in every Colorado metro area, including Boulder, Colorado Springs, Denver-Aurora, Fort Collins-Loveland, Grand Junction, Greeley and Pueblo.

The first quarter HPI data, released today by the Federal Housing Finance Agency for hundreds of metropolitan areas nationwide, shows continued declines in home prices across Colorado.

Nationally and statewide, the HPI has also declined, with Colorado showing smaller declines that the nation overall. (See the analysis here.)

Year over year, the 1-year changes in each metro area were:
Boulder -2.7%
Colo Springs -3.1%
Denver-Aurora -1.6%
Fort Coll-Loveland -1.4%
Grand Junction -10.6%
Greeley -3.3%
Pueblo -2.8%

The first graph shows the year-over-year change in each region for each quarter. For the sake of visual clarity, the graph only shows data back to 2005.


Since the third quarter of 2008, the year-over-year changes have been generally negative. The graph also shows us that:

-Greeley hasn't seen a year-over-year increase in its HPI since 2006.

-The Boulder HPI held out the longest, and did not fall into negative territory until the third quarter of 2009.

-The Grand Junction HPI reflects classic bubble behavior with a large run-up that has in turn declined sharply since 2008.

The second graph shows the actual HPI values for each quarter going back to 2000. In general, the HPI began to plateau during 2007 and was decling in most areas by 2008. A big exception in the Grand Junction area which continued to increase rapidly well into 2008.


Since the peak period of the first quarter of 2007, the HPI has fallen in all regions. The following shows the post-peak declines for each region:

Boulder -1.1
Colo Springs -8.8
Denver-Aurora -4.9
Fort Coll-Loveland -4.4
Grand Junction -14.1
Greeley -12.6
Pueblo -9.6

When contrasted with the national post-peak decline of 14.8 percent, most regions in Colorado are showing relatively mild declines.

This report overall suggests that while there is a fair amount of price stability in many areas of Colorado, prices continue to fall. When compared with Case-Shiller and local Metrolist data, we can say with a fair degree of confidence that through the first quarter of 2011, and into the second quarter, weakness in demand for for-purchase housing persists.

The index values presented and analyzed in this article are not seasonally adjusted.

FHFA: Colorado House Price Index down 2.5 percent

Colorado's House Price Index (HPI), measured by the Federal Housing and Finance Agency (FHFA), fell 2.5 percent from the first quarter of 2010 to the same period this year. According to the first quarter HPI, released today by FHFA, the home price index for Colorado, in year-over-year comparisons, has fallen for the eleventh quarter in a row.

The Colorado HPI has now fallen six percent since the first quarter of 2007 when the HPI began to plateau.

In spite of these declines, however, the Colorado HPI has fallen less than the national HPI.

The HPI for the United States fell 3.1 percent from the first quarter of 2010 to the same period this year, and the national HPI has not shown a year-over-year increase since the third quarter of 2007.

Since the first quarter of 2007, when price indices began to plateau, the US HPI has fallen 14 percent.

The first graph shows the Colorado HPI compared to the US HPI since 2000. Since the peak period, the US HPI has fallen farther and faster than the Colorado index.


The US price index can be described as more "bubble-like" than the Colorado index which did not experience a run up in prices to the same degree as was the case in the national index. In turn, the correction has been more mild.

In the second graph is shown the year-over-year change in the HPI for both Colorado and the US. This more fully shows to what degree the HPI has fallen in recent year for both Colorado and the US. The national HPI has fallen farther than the Colorado HPI in every quarter since the third quarter of 2007.


Interestingly, this graph can be contrasted with the same graph for monthly changes in the national HPI vs. the HPI for the Mountain Region. Each month, we report on the monthly HPI which only provides detail down to the regional level. At the regional level, however, the difference between the national HPI and the local HPI is quite different. The HPI in the Mountain Region has actually fallen faster than the national HPI in recent months. What the statewide level data tells us is that Colorado is not the reason that the HPI in the mountain region is being pulled down further than the US HPI. This effect should be attributed to the fact that Arizona and Nevada are included within the Mountain Region, and it is likely that those two states are driving down prices at the regional level.

A note on method: FHFA’s purchase-only and all-transactions HPI track average house price changes in repeat sales or refinancings on the same single-family properties. The purchase-only index is based on more than 6 million repeat sales transactions, while the all-transactions index includes more than 43 million repeat transactions. Both indexes are based on data obtained from Fannie Mae and Freddie Mac for mortgages originated over the past 36 years

The index values presented and analyzed in this article are not seasonally adjusted.

Housing News Digest, May 25

Record low vacancy rate for Denver-area rental homes
The vacancy rate for Denver-area rental houses and condominiums hit its lowest level in the first quarter since Colorado officials have tracked the market.
Only 1.4 percent of single-family homes and condos were available for rent in the first quarter — the lowest rate since 2001, according to a Colorado Division of Housing report Tuesday.

Boulder has tightest rental market in state
Alex Halbleib, who will start as a doctoral student at the University of Colorado in the fall, launched his housing hunt this week.

His family drove out from Florida and is searching for a property at a time when single-family and condominium vacancies in the state have hit a historic low.

"It seems pretty tight," said Halbleib, who toured some apartment complexes with lengthy wait lists.

Springs cost of living 8% below national average

Falling prices for high-end homes helped keep local living costs from rising as fast as the rest of the nation during the first quarter, according to a quarterly survey.

Living costs in Colorado Springs were 8 percent below the national average during the January-to-March quarter, nearly the widest such gap in 20 years, according to a survey by the Council for Community and Economic Research. Local costs were 6.8 percent below the national average during the first quarter of 2010 and averaged 7.2 percent below the average for all of 2010.

Housing authority project gets award
The Village on Stanford, an affordable-housing complex run by Fort Collins Housing Authority, received the Energy and Green Building Award of Excellence from the Colorado Division of the National Association of Housing and Redevelopment Officials on Thursday and is now being considered for the association's national award in the same category.

Good time to be a landlord
Rachel Brand bought a house in Aurora as an investment in February and had it rented by mid-March.

It’s already cash flowing, with the monthly rent about $540 a month more than the mortgage amount.

Brand, principal of Brand Communications, bought the home, which is a pleasant walk from the Anschutz Medical Campus, because she wanted an investment with a steady return.

Survey: Longmont's homeless population up by 35 percent
LONGMONT -- Longmont's homeless population has increased by nearly 35 percent since 2009, according to the Metro Denver Homeless Initiative's point-in-time survey released last week.

The survey counted 636 homeless people who spent the night of Jan. 24 in Longmont. The survey from 2009 counted 414.

Tuesday, May 24, 2011

Number of new home sales in U.S. West down 20 percent

New single-family home sales fell in the US, and in the West region, which includes Colorado. New home sales fell to the second-lowest April total recorded in at least ten years.

The report, which monitors sales activity for newly constructed houses, reported that in the West, new home sales were down year over year, falling 20 percent to 8,000 in April 2011 from 10,000 new homes sold in April 2010. Nationwide, sales dropped off 21 percent, falling from 41,000 to 32,000 during the same period.

In April, new home sales were at the second-lowest April total in at least a decade. Only April 2009 reported fewer new home sales with a total of 7,000. The first graph shows monthly new home sales totals for each month since 2003:

For the West region:


The second graph shows that new home sales continue to fall and have generally followed a downward trend since the middle of the decade.

New home sales peaked during the spring and summer of 2005 and have trended downward since. The number of new houses sold in the United States is down 74 percent since the peak of March 2005, and new home sales in the West have fallen 78 percent since sales peaked in the region during March 2004.


The third graph shows the declines in both US and regional totals in new homes for sale.

The number of new homes for sale has also fallen off considerably. The number of new houses for sale in the West has fallen 73 percent since the total peaked during June 2007, and the same total has fallen 69 percent in the US since the number of new homes for sale peaked in the US during August 2006.


The number of new single-family homes for sale in the West is now at the lowest level it's been in more than ten years.

As a final note, we can also look to the new home inventory. In this case, we calculate inventory by subtracting the number of new home sales in a given month from the number of new homes for sale at the end of the previous month. In the final graph, we see that the inventory is now at a ten-year low of 30,000 homes. This is good news for owners seeking to sell homes since it suggests that fewer new homes are sitting and waiting to be sold, thus diminishing some of the inventory-driven downward pressure on prices.


In the most recent housing starts data for April, discussed here, there is still no evidence any any imminent jump in the number of new homes being constructed, so new home sales and homes for sale are likely to continue at very low levels, at least in the near term. On the other hand, in the same housing starts data, there is some evidence of an uptick in activity among multifamily structures.

Analysis: Vacancies in single-family rentals at historic lows, rents flat

New vacancy and rent data for single-family homes and condos, released today by the Division of Housing, shows a continued increase in the demand for rentals, but interestingly, shows very little growth in average rents over the past eighteen months.

First, we'll look at vacancies.

In the first graph, we can see that the metro-wide vacancy rate is at the lowest level recorded since the survey was first created in 2001. During the middle part of the last decade, vacancy rates were pushed up by widely available credit for home purchases, and as households pursued homeownership, many single-family rentals were left empty.


By 2007, however, as credit markets began to contract, the vacancy rate headed down, and with credit availability very tight in the current market, households have looked to rent homes rather than buy.

The second graph simply confirms that this overall trend has been felt in all county areas of the metro Denver area. Adams County has generally reported the highest vacancy rate, and Douglas County has generally reported the lowest, but vacancy rates are now so low in all areas, that the markets are consistently tight across the board.


The third graph shows the average number of days that these rentals sit on the market before being rented. Here we also see an all-time low, as on average, units sit on the market only 29 days. This is down considerably from the typical periods of 40 days to fifty days from the middle of the last decade.


With so few days needed to find renters, and with such low vacancy rate, we would assume that rent growth would be strong. However, as we see in the fourth graph, the average rent for single-family homes and rental condos has been largely flat since 2010. We can also note that over the same period, increases in rents, which have been under 1 percent, have not out paced the CPI which has been around 2 percent during this time. So, if adjusted for inflation, rents have actually decreased over the past year.


During the middle period of the last decade, as households flocked to homeownership, rents went nowhere between 2003 and 2007. They began to increase in real terms as the 2003-2007 economic expansion reached its peak, but rent growth had largely stalled by 2010.

The last chart emphasizes how little rent growth there has been since the second quarter of 2010. The third quarter of 2010 was the first quarter to see a negative year-over-year change in quite some time, and year-over-year increases since then have been below 2 percent, and have not kept up with inflation.

There are at least two factors behind this lack of rent growth. The first is the fact that incomes have stalled in recent years, so a lack of income growth makes it more difficult for owners to push rents if they wish to avoid turnover costs.

The second factor is the continued growth in the overall inventory of single-family homes and condos available for rent. As foreclosures and weak home sales activity have persisted in recent years, homes have been placed in the rental market either by investors who have bought distressed properties, and rentals have also been added by homeowners looking to rent properties until they feel they can obtain a more favorable selling price.

This can be contrasted with the situation in multi-family rents in which very little new inventory has been added in recent years, and little new inventory is on the horizon in the next twelve to eighteen months. Consequently, rent growth has been stronger in multi-family rentals.

Housing News Digest, May 24

2010 Census: Colorado has net gain of 56,310 residents in 2009-10

Colorado saw an influx of 210,939 people from other states and abroad from 2009 to 2010, the U.S. Census Bureau reported Monday.
The Denver-Aurora-Broomfield metro area picked up 89,883 people from other states and abroad during that time period, the bureau said.

Work begins on apartment complex on north side

Construction has started on a 230-unit, upscale apartment complex southwest of Woodmen Road and Union Boulevard on Colorado Springs’ north side, one of the few new multi-family projects launched in recent years.

Talos Holdings, a Utah-based company that acquires and develops apartment projects, plans to open the first units in December and complete the complex in June 2012, said company president John McWilliams.


April new home sales rose 7.3%
Sales of new single-family homes rose 7.3% in April from a month earlier, easily topping most analyst estimates.

The Commerce Department said the seasonally adjusted rate of 323,000 units last month was up from 301,000 for March, which was revised upward slightly. April new home sales were down 23.1% from 420,000 a year earlier.

Watch for strategic defaulters, economists suggest after studying Countrywide data
Homeowners at least two-months delinquent on their mortgage may be more apt to strategically default if offered a mortgage modification despite the damage to their credit.

A new report sponsored by the National Bureau of Economic Research studied the mortgage modification program Countrywide Financial Corp. started after settling federal deceptive-lending charges in 2008.

Malone: Keep Barnes & Noble retail space
Malone is offering $1 billion for the chain of book stores. Even as Barnes & Noble continues to make inroads into the sale of digital books and electronic readers, Malone says “there will be a physical presence for a long, long time to come, and it will be a profitable physical presence."

Single-family rental vacancies at all-time low of 1.4 percent

Click here for full report.

Vacancies in for-rent condos, single-family homes, and other small properties across metro Denver fell from the first quarter of 2010 to a new low of 1.4 percent during 2011’s first quarter. According to a report released Tuesday by the Colorado Division of Housing, the vacancy rate was 3.1 percent during the first quarter of 2010, and was 2.0 percent during the fourth quarter of 2010.

The average number of days on the market for single-family rentals and similar properties fell from 45.1 days during the first quarter of 2010 to 29.7 days during the first quarter of 2011. The number of days on the market also fell from 2010’s fourth-quarter average of 38.2 days.

“Both the vacancy rate and the number of days on the market are at the lowest levels recorded since 2001,” said Ryan McMaken a spokesman for the Division of Housing. “There has been concern about the potential supply of unwanted and foreclosed single-family homes out there, but this data continues to suggest that there is a solid demand for single-family homes and condos that have been made available for rent.”

At the county level, the lowest vacancy rates were found in Jefferson County and in the Boulder/Broomfield area. The vacancy rate was 1.0 percent in Jefferson County, and there were no vacancies among the units surveyed in Boulder County.

The highest county-wide vacancy rate, found in Adams County, was 1.9 percent.

Vacancy rates for all counties surveyed were: Adams, 1.9 percent; Arapahoe, 1.8 percent; Boulder/Broomfield, 0.0 percent; Denver, 1.3 percent; Douglas, 1.1 percent; and Jefferson, 1.0 percent.

Average rents were largely flat across the metro area during the past year in spite of declining vacancies.

The average rent for single-family and similar properties rose year-over-year to $1,039 during 2011’s first quarter, rising 0.4 percent from 2010’s first-quarter rate of $1035. The first quarter’s average rent was up 0.6 percent from 2010’s fourth-quarter average rent of $1029. Average rents are not adjusted for inflation.

“Although the demand for units is very strong, it has been difficult for owners to push rents in many cases,” McMaken said. “This is partly due to the fact that new inventory continues to come in the form of foreclosed homes bought up by investors and via owners who opt to rent out their homes instead of selling them in the present market. Present trends point toward more solid rent increases in the future, however.”

Median rents for all counties were: Adams, $1104; Arapahoe, $1016; Boulder/Broomfield, $1535; Denver, $982; Douglas, $1386; and Jefferson, $993.

Monday, May 23, 2011

Housing News Digest, May 23

HomeAid Colorado Gives Colorado's Female Veterans a Place to Call Home
DENVER, May 23, 2011 /PRNewswire/ -- No one deserves to be homeless, but it seems especially unfair to see those who have served our country in the military without a permanent roof over their heads. As we recognize our soldiers who made the ultimate sacrifice this coming Memorial Day, we also want to celebrate this Tuesday, May 24, 2011 the completion of a home that will house up to 5 female veterans and their children.

U.S. Census: More than 200,000 people moved to Colorado between 2009 and 2010

Colorado saw an influx of 210,939 people from other states and abroad between 2009 and 2010, the U.S. Census Bureau reported today.
The Denver-Aurora-Broomfield metro area also picked up 89,883 people from other states and abroad during that time period, said the bureau.
The city of Denver saw a total of 21,436 new residents from other states and abroad from 2009 to 2010.

Denver project gets $22 million from HUD

U.S. Housing and Urban Development Secretary Shaun Donovan today awarded $22 million to revitalize the South Lincoln Homes public housing development.

The current 182 units will be redeveloped and replaced with 457 units of new public, low-income housing, and affordable homeownership units. South Lincoln is a 15.1-acre site bordered by West 11th and 12th avenues and Mariposa and Osage streets. It is in the La Alma/Lincoln Park neighborhood.

1800 Larimer, 5 others lauded by Partnership
1800 Larimer, the most energy efficient building ever built in downtown Denver and DaVita Inc., which is constructing its $101 million headquarters downtown, were among the six award winners Thursday night at the 50th Annual Downtown Denver Awards Dinner.

The event, sponsored by Polsinelli Shughart PC in the Sheraton Downtown Denver Hotel, drew about 900 business leaders.

Survey Finds First-Time Buyers in Short Supply to Absorb Distress
Currently, first-time homebuyers make up merely one-third of what is considered their “normal” market share of home purchases, according to the research firm Campbell Surveys, which conducts monthly assessments of sales activity and mortgage usage patterns.

Friday, May 20, 2011

Colorado loses 4,300 jobs in April, unemployment rate drops

Colorado lost 4,300 jobs in April compared to April of last year, but the non-seasonally-adjusted unemployment rate fell to a 17-month low of 8.3 percent from April 2010's rate of 8.8 percent. According to the most recent employment data released by the Colorado Department of Labor and Employment, total employment in April, not seasonally adjusted, fell to 2.44 million jobs. There were 20,000 fewer people in the work force during April, compared to April 2010, which contributed to the decline in the unemployment rate.


From April 2010 to April 2011, total employment fell 0.17 percennt, while the labor force shrank 0.7 percent. The total labor force in April included 2.67 million workers.

As can be seen in the second graph, total employment and total workforce size have increased month-over-month, but both remain down in year-over-year comparisons, and both remain well below the July 2008 peak.


Employment totals are still more than 184,000 jobs below the peak levels experienced during July 2008 when there were 2.63 million employed workers. Since the labor force peaked in July 2008, it has fallen by more than 97,500 workers.

In the third graph is shown the year-over-year comparisons, by percent, for total employment. Not since August 2008 has Colorado posted a positive change in total employment when compared to a year earlier. Although overall total employment has increased since January 2010, employment totals remain negative in each year-over-year comparison. The annual declines, however, have grown smaller in recent months. April's year-over-year drop of 0.17 percent was the smallest annual drop since September 2008 when total employment fell 0.3 percent from the previous September.


The graph also shows the year-over-change in total employment. Total labor force size has fallen more than employment in the last two months, which helps to explain the quick drop in the unemployment rate. Although the state has not actually added jobs in the YOY comparisons, the number of people actually looking for work has declined, pushing the unemployment rate down.

These numbers come from the household survey employment data, so the size of the workforce is dependent on the number of people stating that they are actively looking for work if not employed. Discouraged workers who have stopped looking for work are excluded.

Construction jobs in Colorado not rebounding, leisure jobs recovering

According to April's employment data, released today by the Colorado Department of Labor and Employment, overall employment in Colorado fell slightly in April, but by the smallest amount since 2008. Thanks to continued declines in the labor force, the unemployment rate also fell to a 17-month low of 8.3 percent.

At the Division of Housing, we keep an eye on industries that are often connected to affordable housing and real estate trends.

Today, we'll look at job creation in the following industries: construction, leisure and hospitality, and retail.

Construction is a key indicator since it is connected to housing production. The construction jobs examined below include non-residential construction.

In the first chart, it is clear that, as of April 2011, construction jobs continue to be well below the 2007 peak. Since construction jobs peaked during July 2007, construction jobs have fallen almost 39 percent, or 66,000 jobs, down to post-recession low of 103,900 jobs. From April 2010 to April 2011, construction jobs have fallen 11.1percent, or 13,100 jobs.


Unlike many industries, construction jobs did not drop to an initial low and then rebound. On the whole, construction jobs in Colorado have declined continuously since 2007.

Retail jobs, and jobs in the leisure and hospitality industry are key factors in the rural resort economies, and are also important statewide as sources of income for low-income households. In the chart below, we see that retail jobs have recovered somewhat.

Leisure and hospitality jobs, on the other hand, have recovered to a significant degree since early 2010 and are headed back toward peak levels.

In leisure and hospitality, total jobs are now down 2.5 percent, or about 900 jobs, from the June 2008 peak. From April 2010 to April 2011, total jobs increased 2.7 percent, or about 7,200 jobs.

Retail jobs have not recovered as much as those in leisure and hospitality. From April of last year to April 2011, total employment in retail is up about 1,100 jobs. Since the April 2008 peak, retail jobs are down 7 percent, or about 15,900 jobs.

Housing News Digest, May 20

Colorado loans in foreclosure down in Q1
The percentage of mortgage loans in some form of foreclosure and new 30-day mortgage delinquencies in Colorado both fell in the first quarter, according to data released Thursday by the Mortgage Bankers Association.

Warren Village finishes renovations
Using a $5.4 million grant from the U.S. government’s federal stimulus fund, Warren Village completed renovations to its 93-unit housing project, 1323 Gilpin St., for low-income, single-parent families.

CU-Boulder incoming freshmen await housing, roommate assignments
Massachusetts high school senior Alie Dolan has decided to become a Buff.

After months of awaiting acceptance letters and weighing options, Dolan chose the University of Colorado as her new home, come August.

But this summer, Dolan has replaced the anticipation of acceptance with the anxiety of receiving her roommate and housing assignment.

2010 Census: Colorado households of one have grown in past decade
One is the loneliest number — but it's popular in Colorado, where nearly 28 percent of households are occupied by a single person.
In Denver, the number is even higher. According to 2010 U.S. census data made public today, 40.6 percent of the city's households are composed of a person living alone.

Love Funding Closes $26.1 Million Refinancing for Fox Ridge Apartments in Longmont, Colorado
Denver - Love Funding, one of the nation’s leading providers of multifamily housing loans, announced the closing of a $26.1 million loan refinancing for Fox Ridge Apartments, a 328-unit apartment complex in Longmont, Colorado.

Peter Wessel, first vice president and senior loan originator in Love Funding’s Denver office, secured the loan through the U.S. Department of Housing and Urban Development’s 223(a)(7) loan program. Utilizing the HUD mortgage insurance enabled Wessel to lock in a 40-year non-recourse loan with a low, fixed interest rate, improving the property owner’s cash flow by more than $350,000 a year.

Thursday, May 19, 2011

Multifamily permits hit 3-year high in March

Year-to-date in Colorado, building permits issued for multi-family construction are up 2.4 percent, year over year, while permits issued for single-family construction is down 28 percent for the same period.

This year, through March, there have been 680 multi-family permits issued in Colorado, and 1723 single-family permits issued. For the same period during 2010, there were 664 multi-family permits issued, and 2,395 single-family permits.


For the month of March alone, single-family permits are down, year-over-year, by 24.6 percent, but multi-family permits are up 10.5 percent. There were 735 single-family permits and 493 multi-family permits issued during March 2011.

The second graph shows that overall, both multi-family and single-family permits in March are at levels below what was typical over the past decade. However, the March total for multi-family permits was the second-highest total in 28 months. Compared to March 2011 only September 2010, during which 561 permits were issued, had more permits issued in the period since October 2008.


New construction of single-family homes has shown few indications of renewed growth in recent months. Recent housing starts data from the Census Bureau showed only 7,000 new homes sold in the entire western United States during March.

Multi-family activity, on the other hand, has shown some small indications of renewed growth. There has been much optimism within the multifamily industry about rent growth which in turn will lead to new construction. In spite of the optimism, however, few new construction projects have actually begun, although the March permit total for multi-family is one of the highest March totals in the past decade.

The third graph shows that with the exception of March 2006, the number of permits in March exceeds the March permit total of every other year since 2003.

While multifamily permits are at a 3-year high, year-to-date totals are nonetheless at low levels by historical standards. In previous posts, we have discussed the repercussions of such a small amount of new construction in multi-family housing. Since permits are a helpful indicator of future construction, it stands to reason that new construction will continue to be at historic lows for the short term, which will in turn drive up rents and keep vacancy rates low.

Foreclosure Inventory in Colorado falls to two-year low

According to the National Delinquency Survey, released today by the Mortgage Bankers Association, the percentage of mortgage loans in some state of foreclosure (foreclosure inventory) during this year's first quarter fell to 2.33 percent.

Related Post: New 30-day mortgage delinquencies fall in Colorado

The first quarter foreclosure inventory rate is now down from last year's first quarter rate of 2.76 percent, and it is also the lowest rate since the fourth quarter of 2008 when the foreclosure inventory rate fell to 2.16 percent.

The national foreclosure inventory rate was 4.52 percent during the first quarter of this year, continuing a trend in which the national foreclosure inventory rate has been above the Colorado rate since the fourth quarter of 2007.

During the first quarter, 37 states reported higher foreclosure inventory rates than Colorado, with Nevada and Florida reporting the highest rates of 9.32 percent and 14.38 percent, respectively. Among the twelve states with lower foreclosure inventory rates than Colorado, Alaska and North Dakota had the lowest rates of 1.08 and 1.13, respectively.


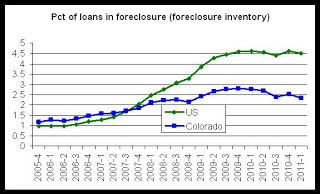
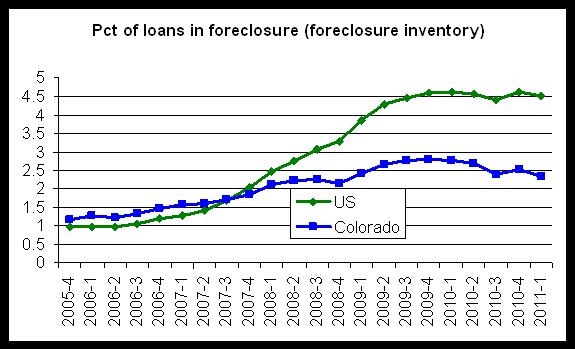
The first graph shows the foreclosure inventory rate for each quarter since the fourth quarter of 2005. Colorado is in a generally downward trend that began after the fourth quarter of 2009. It is important to note, of course, that while Colorado is back to the foreclosure inventory rate it experienced in 2009, 2009 was not a good year for real estate and foreclosures, and the foreclosure inventory is still about double what it was in 2005.

Foreclosure inventory rate:
Colorado:
1st Q 2011: 2.33
4th Q 2010: 2.53
1st Q 2010: 2.76
Most recent peak: 2.81, 4th Q 2009

US:
1st Q 2011: 4.52
4th Q 2010: 4.63
1st Q 2010: 4.63
Most recent peak: 4.63, 1st Q 2010, or 4th Q 2010


The Delinquency Survey also provides a very broad measure that surveys the percentage of loans that are either 90-days delinquent 
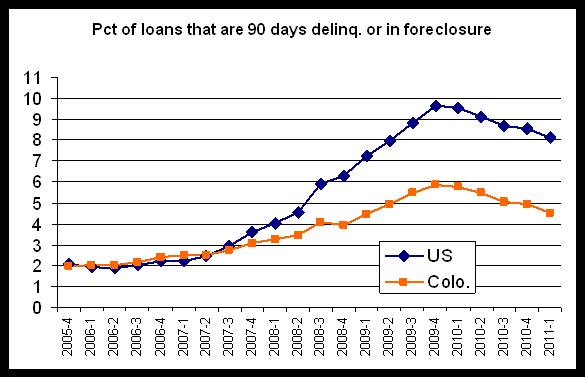
or in foreclosure. The percentage of Colorado loans found in this category has declined every quarter since the fourth quarter of 2009 and is now at the lowest rate reported since the second quarter of 2009.


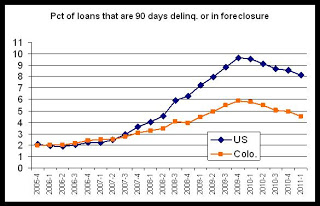
The percentage of Colorado mortgage loans that were 90-days delinquent or in foreclosure fell to 4.52 percent during the first quarter, falling from 2010's first quarter rate of 5.76. The rate peaked at 5.87 during the fourth quarter of 2009.

Nationwide, the percentage of mortgage loans that were either 90-days delinquent or in foreclosure was 8.1 percent during this year's first quarter, falling from last year's first quarter rate of 9.54 percent.

As can be seen in the second graph, in this measure, as with the foreclosure inventory and the 30-day delinquency rate, Colorado's rate is below the national rate and in this case has been below the national rate since the third quarter of 2007.

Compared to Colorado, only seven states had a lower percentage of loans that were 90-days delinquent or in foreclosure. The highest rates were found in Nevada and Florida with rates of 15.97 and 18.97, respectively. The lowest rates were found in North Dakota and Alaska with rate of 1.82 and 2.24, respectively.

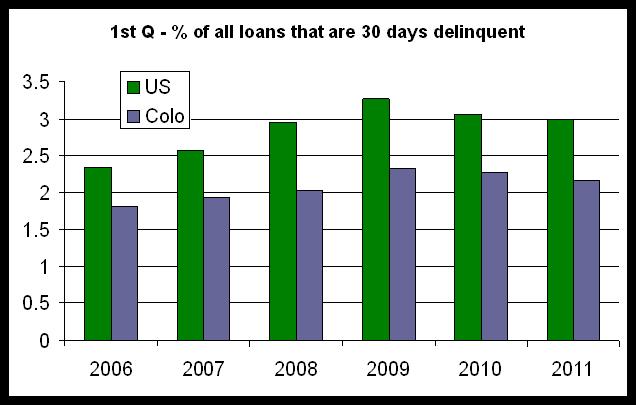
This new information, combined with the 30-day delinquency information (discussed here), further suggests that Colorado enjoys lower foreclosure rates than most states, and that Colorado, with the nation as a whole, is seeing a continued slow and steady decline in foreclosure activity.

Overall, however, foreclosure inventories and 90-day delinquencies remain well above historical norms.

90-day + in foreclosure inventory:
Colorado:
1st Q 2011: 4.52
4th Q 2010: 4.95
1st Q 2010: 5.76
Most recent peak: 5.87, 4th Q 2009

US:
1st Q 2011: 8.1
4th Q 2010: 8.57
1st Q 2010: 9.54
Most recent peak: 9.67, 4th Q 2009

New 30-day mortgage delinquencies fall in Colorado

The National Mortgage Bankers Association released its 2011 first quarter data today, and new 30-day mortgage delinquencies fell during the first quarter to the lowest level reached since the first quarter of 2008.

Related Post: Foreclosure inventory in Colorado falls to two-year low

2.17 percent of all mortgage loans surveyed were delinquent during the first quarter, falling from 2010's first quarter rate of 2.27. The percentage of loans that are 30-days delinquent has not been below 2.17 percent since the first quarter of 2008 when 2.03 percent of all mortgage loans were 30-days delinquent.

2011's first quarter 30-day delinquency rate is the lowest first quarter rate since 2008, and supports findings recently released by the Colorado Division of Housing showing that new foreclosure filings are presently trending downward.

In the graph below, the 30-day delinquency rate is broken out by year and by quarter. We can see that while the 30-day delinquency rate is the lowest it's been in three years, it is still above the rates reported during 2006, 2007 and 2008.


We also can note that the first quarter 30-day delinquency rate tends to be low compared to the other quarters, so we'd expect a drop from the fourth quarter, and we did see that. Nevertheless, the fact that this is the lowest 30-day delinquency rate in 12 quarters is significant and does support the conclusion that there are indeed fewer borrowers actually missing mortgage payments today compared to recent quarters.

The second graph shows a comparison between the Colorado 30-day delinquency rate and the national rate. We can see that the Colorado rate has been below the national rate in every year for which we have data. This isn't just true for the first quarter either. The Colorado 30-day delinquency rate is below the national rate in every quarter since at least as early as 2006.


During the first quarter of 2011, the national 30-day delinquency rate was 3.0, and it was 2.17 in Colorado. During the first quarter, Colorado had one of the lowest 30-day delinquency rates in the nation, with 41 states showing higher 30-day delinquency rates than Colorado.

Note: The 30-day delinquency rate is helpful in analyzing foreclosure trends since unresolved 30-day delinquencies eventually become foreclosure filings. If the number of 30-day delinquencies fall, then foreclosure filings are likely to fall in subsequent quarters as well, all thing being equal.

Housing News Digest, May 19

National delinquency, foreclosure rates on the mend: MBA
Mortgage delinquencies in the first quarter were down 174 basis points when compared to a year earlier, the Mortgage Bankers Association said Thursday, although the percentage of U.S. mortgages in delinquency increased to a rate of 8.32% on a seasonally adjusted basis at March 31, up 7 bps from the end of 2010.

Colorado census figures show more extended families under one roof

Hit by declining salaries, nest eggs that went bust and layoffs, Coloradans have increasingly had to move in with their extended families — much like other periods of economic turmoil.
U.S. census figures made public today show that in the past 10 years in Colorado, households with "other relatives" living there have increased 35.7 percent. The increase in households with other relatives under 18 was even larger, 41.4 percent.

Mexican population continues growth in Colo.
DENVER -- Residents of Mexican descent are becoming a larger part of Colorado's booming Hispanic population and their numbers are increasing where the state is seeing some of its biggest growth, including the Western Slope, according to census data released Thursday.

Hispanics of any race account for about one-fifth of the state's total population of about 5 million, the Census Bureau said in February. But the new data shows that nearly three in four Hispanics in Colorado have Mexican heritage.

Colorado households getting older and smaller, says new Census report
Coloradans on average are older, their households have fewer people, and their homes are slightly more likely to be rented than a decade ago, according to new data from the 2010 Census.
The national headcount, conducted every 10 years, shows the median age of Coloradans was 36.1 years old in 2010, up from 34.3 in 2000.

Koelbel listing Parker project
Koelbel and Co., one of Denver’s oldest family owned real estate companies, is listing a long-stalled condominium project in Parker that was recently purchased by a California company that specializes in buying distressed properties.

Koelbel & Co. is marketing the 20-unit Hunter’s Chase condominium project that has been purchased by San Diego-based Pathfinders Partners LLC. The project had been bank-owned for a number of years until Pathfinder Partners purchased it in late April, said Lorne Polger, senior managing director of the company, which specializes in making opportunistic investments in distressed real estate assets and defaulted loans. Records indicate Pathfinders paid $1.15 million for the units.

Wednesday, May 18, 2011

March new home sales: still at ten-year low

New single-family home sales fell again in the US, and in the West region, which includes Colorado. New home sales fell back to the lowest March total recorded in at least ten years.

The report, which monitors sales activity for newly constructed houses, reported that in the West, new home sales were down, year over year, falling 19 percent to 7,000 in March 2011 from 9,000 new homes sold in March 2010. Nationwide, sales dropped off 22 percent, falling from 36,000 to 29,000 during the same period.

In March, new home sales were at the lowest point for the lowest volume in at least a decade, and are now even with March 2009's total. The first chart shows monthly new home sales totals for each month since 2003. March’s total of 7,000 new homes sold is below totals for both March 2010 and is even with the total for March 2009.

For the West region:


New home sales and new home inventory continue to fall and have generally followed a downward trend since the middle of the decade.


New home sales peaked during the spring and summer of 2005 and have trended downward since. The number of new houses sold in the United States is down 77 percent since the peak of March 2005, and new home sales in the West have fallen 81 percent since sales peaked in the region during March 2004.

The third chart shows the declines in both US and regional totals in new homes for sale.

The number of new homes for sale has also fallen off considerably. The number of new houses for sale in the West has fallen 71 percent since the total peaked during June 2007, and the same total has fallen 68 percent in the US since the number of new homes for sale peaked in the US during August 2006.


The number of new single-family homes for sale is now at the lowest level it's been in more than ten years.

In the most recent housing starts data for April, discussed here, there is still no evidence any any imminent jump in the number of new homes being constructed, so new home sales and homes for sale are likely to continue at very low levels, at least in the near term. On the other hand, in the same housing starts data, there is some evidence of an uptick in activity among multifamily structures.

Housing News Digest, May 18

April Foreclosure Numbers Are Down, Report Says

Graphs released by the Division show April of 2009 having the highest peak for filed metropolitan foreclosures. (Huffington Post)

For the past two months, Arapahoe County has maintained the highest rates of foreclosure filings and sales--589 filings and 525 sales--but even they have experienced a 32.4 percent decrease in filings from 2010-2011.

April home market a roller coaster
Denver-area home activity in April was a roller coaster ride.

There were 4,749 homes placed under contract in April, a 28 percent drop from the record 6,616 in April 2010, the deadline for the federal tax credits that fueled a home-buying frenzy that has since collapsed, shows a report released today by independent broker Gary Bauer.

That was the single largest year-over-year percentage drop for an April on record, according to an analysis of the report based on Metrolist data. Metrolist publishes MLS data, which reflects home sales activity by area Realtors.

Boulder County's, state’s foreclosure filings fall
Foreclosure filings in Boulder County were down by nearly 30 percent through the first third of the year, while completed foreclosures, or foreclosure sales, were down 12 percent.

Boulder County had 328 foreclosure filings year-to-date through April, down from the 466 filings for the same period last year.

Home sales down in April across region
Sales of detached residences in Northern Colorado were down across the region in April, according to figures released by Loveland-based Information and Real Estate Services.

Chris Hardy, Coldwell Banker Residential Brokerage, said lower home sales figures in 2011 partly reflect the fact that the first-time homebuyer tax credit is no longer available to lure buyers. The tax credit expired at the end of April 2010.

Colorado community owner files for liquidation
A developer of a Colorado community filed for Chapter 7 in U.S. bankruptcy court in Wilmington, Delaware, and will pay creditors through auctions.

Banning Lewis Ranch Co., based in Newport Beach, California, listed assets of approximately $50 million and liabilities of more than $100 million, according to a report. The company filed for bankruptcy last October.

Take time to understand assessments
Property owners should be aware that reassessment of their real estate arises every two years. Colorado statutes provide that reassessment of properties takes place in odd-numbered years. Further, property owners should be aware that the assessor's May 1 letter was a proposed property value. And, most importantly, protests of this valuation must be filed with the assessor's office by May 31.

Tuesday, May 17, 2011

Free Foreclosure Prevention Event in Glenwood Springs

Colorado Foreclosure Hotline Hosts Free
Foreclosure Prevention Event in Glenwood Springs
***Housing Counselors to help homeowners in Garfield, Delta,
Eagle, Pitkin and Summit counties
***Appointments required for June 4 bilingual event

May 17, 2011--The Colorado Foreclosure Hotline will host a free Foreclosure Prevention Event from 9 a.m. to 3 p.m. on Saturday, June 4, at the Glenwood Springs Community Center, located at 100 Wulfsohn Road, in Glenwood Springs.

Hosted in cooperation with the Garfield County and Grand Junction housing authorities, the free bilingual event will serve as many as 50 homeowners who reside in Garfield, Delta, Eagle, Pitkin and Summit counties and who have fallen behind on their mortgage payments or are facing foreclosure.

Given that filings in at least one of the four counties (Garfield) increased by 27 percent during the first quarter of 2011, the Foreclosure Prevention Event will prove to be a timely resource for homeowners hoping to hold onto their homes or find another favorable outcome.

During the day-long event, homeowners will be able to meet with a HUD-approved housing counselor with whom the can discuss their situation in detail and review their many options to prevent foreclosure. Plenty of bilingual counselors also will be on hand to meet with Spanish-speaking homeowners.

“As housing counselors, our desire is to directly serve as many homeowners as we can throughout the state,” said Shannon Peer, hotline director. “And with a dearth of available counselors in some of the mountain and Western Slope communities, this event will make for a great opportunity for those of us in the Hotline network to meet with those folks who are concerned with losing their home.”

A face-to-face consultation with a knowledgeable housing counselor can make all the difference for a struggling homeowner. According to the Colorado Division of Housing, four out of five homeowners who have met with a Colorado Foreclosure Hotline counselor have achieved an outcome favorable to their specific situation.

To participate, a homeowner MUST call the Hotline at 1-877-601-4673 to schedule an appointment. Appointments will be scheduled on a first-come, first-served basis.

Established in 2006 and administered by Brothers Redevelopment, the Colorado Foreclosure Hotline enables homeowners who have missed or expect to miss a mortgage payment to call the Hotline (1-877-601-HOPE) free of charge, type in their zip code and speak to a Housing Counselor at a HUD-approved Housing Counseling agency nearest them.

In all, more than 130,000 Coloradans have called the Hotline since its inception for help in holding onto their homes. The network’s counselors, meanwhile, have helped more than 25,000 Coloradans better understand their options to reach a positive resolution--defined as the best workout option for a homeowner that prevents the foreclosure from completing and being added to a homeowner’s credit report.

For more information, visit the Colorado Foreclosure Hotline’s website: www.coloradoforeclosurehotline.org.

Fremont County awarded $480,000 in CDBG funds

Fremont County will receive a grant of $480,000 to purchase factory-built homes for a rental housing development just north of Canon City.

North Park was originally built as a tax-credit rental project in 3 phases, using mobile homes. After the tax credits expired on Phase I, the owner refinanced it with fresh tax credits and replaced all of the mobile homes with factory-built homes on permanent foundations. Phase II’s tax credits recently expired, and fresh tax credits are ready to be applied to replacing those 25 units. Phase III’s original tax credit financing has not expired, but its 8 mobile homes also need to be replaced, and so they are included in this request - but they are not part of the new tax credit or first mortgage loan financing. Those 8 units will be funded by owner’s equity and this grant request. All together, this project will replace 33 units with new single-family rental homes in a mix of 2, 3 & 4 bedrooms; affordable at 30%, 40%, 50% & 60% AMI.

Fremont County will loan the DOH funds to the project’s owner/developer/general partner, Sleeping Indian LLC. The loan will be secured by the property, in second position, at 1% interest for 30 years. Fremont County will assign the loan to the Upper Arkansas Area Development Corporation (UAADC) so that it will receive loan payments and, as program income, will reinvest them in future eligible affordable housing projects.

Single-family housing starts down again as multifamily starts surge

Housing starts in the West census region of the US, which includes Colorado, were flat from April 2010 to April 2011, counting both single-family and multi-family units. According to new housing construction and housing starts data released today by the US Census Bureau, there were approximately 10,000 housing units started in the West during April 2011. Of the new units started, 7,100 were single-family structures and 2,900 were structures containing more than one housing unit.

Nationally, housing starts fell 24 percent during the same period, with total housing starts falling to a total of 46,800

The first graph shows the overall trend of housing starts nationally and in the West census region. Total housing starts remain near ten year lows in both measures, and very little has changed since early 2009.


The West census region includes California, so given the size of the West census region, the fact that total housing starts are at 10,000 indicates that new home construction continues to be very light throughout the region.

The second graph shows the difference between single-family starts and starts for structures with more than one housing unit. Both remain near ten-year lows, and single-family starts fell 22 percent from April 2010 to April 2011. However, starts for structures with more than one unit increased by 262 percent during the same period, although it was easy to produce a very large percentage increase since total multifamily permits totaled a mere 800 units during April of last year. Given recent data showing strength in the demand for rental-housing, the housing starts data may suggest that developers of rental housing are beginning to move forward with construction of new multifamily structures.


The third graph shows month-by-month comparisons in housing starts for each year. April's housing starts total has been flat at 10,000 for April 2011, April 2010 and April 2009. It has been more than ten years since there were fewer than 10,000 starts in the month of April. April produced the largest number of housing starts in seven months, but much of this is due to seasonal factors.

Focus on Mesa County Foreclosures

As a follow-up to the April foreclosure data released today:

In recent years, the foreclosure trends in Mesa County have stood out as quite different from the other 11 metro counties. Mesa County is the only western slope county among the metropolitan counties, and foreclosure trends can differ greatly between the Front Range and the rest of the state.

In the following graphs, we look at how Mesa County has differed from the other metro counties and regions.

In the first graph, we can see that, unlike the other counties, foreclosure sales totals more or less tripled between early 2009 and early 2010. At the same time, none of the other metro areas saw this kind of growth. The Front Range did see this kind of growth back in 2006 and 2007, but we don't have monthly data for that period, and it's not on the graph here. Nevertheless, what this does tell us is that Mesa County entered its own growth period well after the other metro regions did, and that, while other areas have started to decline in foreclosure activity, Mesa County is holding steady, and even still increasing slightly in some periods.


As noted before, this is due to the fact that the real estate market in Mesa County experienced more demand for real estate than the Front Range after 2007. By 2007, most metro areas were already past the peak in real estate prices and demand, but a high demand for real estate in Mesa County persisted into 2008 thanks to oil and gas job growth at the time.

We can also see in the graph that, lately, Mesa County has reported more foreclosure sales than the much more populous Larimer County, which really highlights just how much the foreclosure rate in Mesa County has grown.

In the second graph, we see the year over year change in foreclosure sales in the various regions. Back in March 2010, foreclosure sales had increased more than 800% over March 2009. Between January of 2009 and the summer of 2010, Mesa County YOY changes were well above the other areas.


If we look very carefully at the graph, we can also see that, while Mesa County is still seeing some slight year over year growth in foreclosure sales, most of the other regions are now below the X axis, which shows that these areas are in a state of decline in the year over year comparisons. Mesa County has not yet reached this point.

And finally, the last graph looks at the YOY changes in a slightly different way. This last graph emphasizes that if we pull Mesa County out from the other counties, we can see just how different is the trend from the other metro areas.

Which months have the most foreclosures?

At the back of the April foreclosure report, I added an extra appendix that looks at seasonal factors in foreclosure sales and filings. While I only have three full years of monthly data to use, there are still some helpful insights into month-by-month trends in foreclosures since 2007.

The following is adapted from the April report:

Historically and on a nationwide basis, foreclosure filings have tended to peak late in the first quarter and early in the second quarter. This may be due to the fact that households often tend to default on mortgages during and immediately after the holiday season in December. This is followed by an increased number of foreclosure filings three to four months later. Note: Averages are based on monthly date from 2008 through 2010.


Foreclosure sales, on the other hand, tend to peak in both January-February and during summer and early autumn. The increases found during January and February are likely due to increases in the speed with which foreclosures are processed following the holiday season. Traditionally, some loan servicers have held off pushing loans to the final stage of foreclosure until after the holidays. The increases in sales found during the summer and early autumn months likely reflect the increased number of filings that occur during March and April. As these filings move through the system, they show up as sales at auction several months later.


In each month from January through April of this year, there have been fewer new foreclosure filings that during the same months during the years of 2008, 2009 and 2010. Foreclosure filings activity is clearly well below activity reported in recent years.


Unlike foreclosure filings totals, foreclosure sales at auction totals have not shown any notable downward trend during the early months of this year. In fact, foreclosure sales totals from March and April were above totals from 2008 and 2009.

Foreclosures in Colorado fall 40 percent in April

Click here for full report.

Both foreclosure filings and foreclosure sales at auction in Colorado’s metropolitan counties fell during April when compared to the same month last year. April was the fifth consecutive month during which both filings and sales were down when compared to the same month a year earlier. According to a report released today by the Colorado Division of Housing, foreclosure filings fell 40.1 percent from 3,228 during April 2010 to 1,933 during April 2011.

Foreclosure sales at auction fell 11.2 percent during the same period. There were 1,604 sales at auction during April 2011 in Colorado’s metropolitan counties, compared to April 2010’s total of 1,806.

From March to April of this year, foreclosure filings increased 4.0 percent and sales at auction fell 7.6 percent. Foreclosure filings hit a 31-month low in March, but have risen slightly since.

Year-to-date comparisons show that for the period from January to April this year, foreclosure filings are down 33.2 percent as compared to the same period last year, and foreclosure sales at auction are down 18 percent.

“It’s now been seven months since new foreclosure filings increased year over year, and three of those months showed drops of thirty percent or more,” said Ryan McMaken, spokesman for the Colorado Division of Housing. “On the other hand, foreclosure sales at auction are actually up in 2011 compared to what we saw during March and April of 2008 and 2009. The filings news is great, but there are still clearly many pending foreclosures left to deal with.”

Foreclosure filings are the initial filing that begins the foreclosure process, and foreclosure sales totals are the total number of foreclosures that have been sold at auction at the end of the foreclosure process.

All metropolitan counties showed decreases in foreclosure filings, comparing year over year. From April 2010 to April 2011, foreclosure filings fell 56.3 percent in Douglas County and 51.3 percent in Larimer County. The county with the smallest decrease was Pueblo County where filings dropped 7.1 percent, compared year over year.

Foreclosure sales totals also showed many declines across the state, but were mixed. Pueblo County, Boulder County and Jefferson County all reported increases in foreclosure sales at auction in April when compared to April of last year. All other counties, however, showed decreases with the largest decrease found in Weld County where foreclosure sales fell 39.2 percent, year over year.

“Over the past year, Weld County and metro Denver have been enjoying the most improvement,” McMaken said. "Mesa County looks like it might finally be leveling off after about eighteen months of rather large increases in foreclosure activity, but totals haven’t started to fall yet.”

Housing News Digest, May 17

Foreclosures down 40 percent (9news)
"Over the past year, Weld County and metro Denver have been enjoying the most improvement," McMaken said. "Mesa County looks like it might finally be leveling off after about eighteen months of rather large increases in foreclosure activity, but totals haven't started to fall yet."

Colorado foreclosure filings and sales down (Denver Post)

Foreclosure sales also showed some declines across the state but were more mixed. Pueblo, Boulder and Jefferson counties reported increases in foreclosure sales at auction in April when compared to April 2010. All other counties, however, showed decreases with the largest decrease in Weld County, where foreclosure sales fell 39.2 percent year over year.

Another big drop in Colorado foreclosure filings (DBJ)

"On the other hand, foreclosure sales at auction are actually up in 2011 compared to what we saw during March and April of 2008 and 2009. The filings news is great, but there are still clearly many pending foreclosures left to deal with."

Foreclosure filings fall 40.1% in Colorado (Housing Wire)
In April, the state recorded 1,933 foreclosure filings, down from 3,228 a year earlier.

Foreclosure sales at auction declined 11.2% during the month, dropping to 1,604 from 1,806 sales in April 2010

Foreclosure filings in Denver area drop (AP)
DENVER (AP) - The number of new foreclosures in the Denver area continue to drop but state officials say the number of foreclosure sales is still relatively high.

The Colorado Division of Housing said Tuesday that foreclosure filings and foreclosure sales at auction in the state's 12 largest counties fell during April compared with April 2010.

Mariner Holdings will finish Colorado development
Mariner Holdings LLC has shed some additional light on its acquisition of a stalled retail development in Basalt, near Aspen, called Willits Town Center.
Mariner Real Estate Management, a subsidiary of Leawood, Kan.-based Mariner Holdings, said it will manage the investment with the intent of completing the project, which has been stalled since 2008.

Monday, May 16, 2011

Housing News Digest, May 16

Commercial real estate poisoning small banks
NEW YORK (CNNMoney) -- The troubled commercial real estate is slowly killing off the nation's small and regional banks, and industry experts fear the worst is yet to come.

Denver apartment deal largest in U.S.
CB Richard Ellis today confirmed it has been retained to sell the Carmel Cos. apartment portfolio in Colorado, which it describes as the “largest multifamily offering in the nation.”

The sale was first reported by InsideRealEstateNews on Wednesday.

CBRE is the exclusive adviser regarding the sale of the portfolio, which it said consists of more than 8,000 units in 24 properties developed between 1980 and 2000.

The Grove housing plan draws praise and protest
Student housing developer Campus Crest has invested more than $100 million into student housing across the country, creating its brand called "The Grove."

Next month, a project development plan and overall development plan will go before the Fort Collins Planning & Zoning Board for The Grove Fort Collins, a project that has raised the ire of many local residents.

Construction industry remains stagnant
Builders in Boulder County are facing a stagnant market this year, although one expert in the home construction industry says the Denver metro region appears poised to break out of its doldrums in 2012.
Boulder issued about 290 building permits from Jan. 1 through March 31, which would put the city on pace to issue 1,160 permits this year, down slightly from 1,286 granted last year, according to figures from the city`s Planning and Development Services Department.

Boulder's latest affordable housing project nearly done
The latest in Boulder's permanently affordable housing, True Corners, is nearing completion of its first phase, a collection of eight one- and two-bedroom units, each between 750 and 1,000 square feet.

The condos' bold colors and Energy Star ratings have caught the eyes of qualifying homebuyers, as well as the attention of Home and Garden Television, which was scheduled to visit the housing development last weekend to film an episode of its hit show "House Hunters."

Apartment Vacancies Declining In Grand Junction - VIDEO
GRAND JUNCTION, Colo. -- Grand Junction apartments seem to be filling up. In a recently released report sponsored by the Colorado Division of Housing, researchers found the vacancy rate decreased to 6.3% for the first quarter of this year.

Friday, May 13, 2011

Median home price, home sales transactions down in March 2011

Metro Denver home sales were down 9.1 percent in March 2011, and the median home price fell 3.2 percent, according to March 2011 data released by the Colorado Association of Realtors.

Overall, the March data shows that home prices have stabilized, however in light of recent Case-Shiller report showing slow and ongoing declines in prices, it is likely that overall, prices in the Denver metro continue to fall at a slow and measured pace.

With the March data, we now have almost a full year of data showing trends since the end of the home purchase tax credit ended. In that time, home prices appear to have largely flattened, although the trend in the number of home sales transactions is less clear.

All of the data analyzed in this entry is for single-family homes.

The first graph shows the total number of home sales closings in the metro Denver area (excluding Boulder). In March 2011, there were 2,597 which is the smallest March total for closings since March 2003 when there were 2,222 closings. The number of closings in March was up substantially from February, which was expected and in line with seasonal trends.


The second graph shows the year-over-year comparisons in home sales closings. The number of home sales in March 2011 was down 9.1 percent from March 2010's total of 2,857. March 2010's total was actually quite high compared to most March totals of the past, and this reflected activity spurred by the homebuyer tax credit that was in place at the time.

Only 5 of the last 24 months have shown positive year-over-year comparisons in home sales closings, which has undoubtedly put downward pressure on median home prices, although the relatively low number of buyers during this period has provided numerous opportunities for bargain-hunting among those looking to buy single-family homes.


The third chart shows how far median home prices are below the most recent peak. The median home price in metro Denver most recently leaked at $263,000 during June 2006. Since then, the median home price initially bottomed-out at 68% of the peak price during January 2009. During March 2011, the median home price of $224,000 was at 84% of the peak price.

The median home price has largely been flat since December 2010.


The last chart shows the year over year change in the median home price in metro Denver. Only 6 of the last 24 months have shown negative changes when compared to the same month the previous year. Given the falling number of homes sales transactions during this period, this is a surprising amount of stability in home prices.

Nevertheless, the year-over-year change for March was -3.2% which is a fall from the tax-credit-inflated price from March 2010. Year over year changes still reflect the market's return to "natural" conditions following the end of the tax credit. We'll know more about prices once we're able to make annual comparisons in which neither month was directly affected by the tax credit.


These are all metro-wide numbers, of course and should not be applied to any specific neighborhood.

All of these graphs show activity through March 2011.

Upcoming economic data release schedule

Upcoming data releases from the Division of Housing

Tuesday May 17: April Foreclosure Report on Metro Counties
Thursday May 24: Single-Family Vacancy and Rent Survey
Tuesday, May 26: Statewide and Regional Report on Availability of Affordable Rental Units

Analysis (Part I) 1st Q 2011 Statewide Vacancy and Rent Survey

This morning, we released the statewide vacancy and rent survey for the first quarter. In this first article on the report, we'll focus on the metro areas only. We'll look more at the rural resort areas later.

There are a few things we can learn from the first graph, which shows the vacancy rates in the various metro areas since 2001.

First, we can see that vacancies in general have been falling since the fourth quarter of 2009. Vacancies initially climbed with the recession's beginning in late 2008 but fell as households looked for alternatives to homeownership, and as the population continued to increase.


Although the vacancy rate has historically tracked with the unemployment rate, the effects of an elevated unemployment rate since 2008 have not been enough to overcome the demand for rental housing driven by solid household formation and by a diminished interest in homeownership.

We also note that two regions stand out from the others over the past decade. The first is Colorado Springs, where due to layoffs and troop deployments out of the region which uniquely affected the local economy, the vacancy rate remained higher than all other metro regions during much of the last decade.

And in Grand Junction, we see vacancy rates hitting very low levels throughout much of the decade due largely to a small economic boom resulting from oil and gas expansion. This expansion largely ended in 2008.

The chart also shows us which areas had the highest and lowest vacancy rates during each quarter. During the first quarter of this year, we see that the areas with the highest vacancy rates are Pueblo and Grand Junction. It is not a coincidence that these areas also have the highest unemployment rates among Colorado's metro areas. Job growth, among other things, drives demand for rental units, so these areas with the highest unemployment rates (both areas had rates of 11.2 percent in March)also showed the highest vacancy rates.

The Denver metro area (unemployment rate: 9.1 percent) and the Fort Collins-Loveland area (unemployment rate: 7.7 percent), which were among the metro areas with the lowest unemployment rates also showed the lowest vacancy rates.

Greeley, however does provide a challenge because although it had a 1st Q (March) vacancy rate of 3.8 percent, the area showed an unemployment rate of 10.6 percent. So, all things being equal, a higher vacancy rate would have been expected. This can be at least partially explained by the fact that Greeley (or at least western areas of Greeley) act as a bedroom community to Fort Collins and Loveland. In recent quarters, with a large amount of rent growth occurring in Larimer County, demand for lower-priced rentals have increasingly been rented by workers from Larimer county who are looking for more affordable rental alternatives. So, the vacancy rate in Greeley has at least in part been driven down by the relatively strong job market in Larimer County.

The second graph shows us year-over-year changes in average rents in all metro areas of Colorado since 2008. The graph suggests that rent growth is now clearly the strongest its been since 2008 during the period just prior to the financial collapse in the autumn of 2008. Most areas are now showing rent increases of nearly 4 percent. These annual changes in rent levels do not yet match the rent growth seen prior to the 2002 recession in Colorado, although the graph now shows a continued strengthening of rent growth in recent quarters.


Average rents continue to be flat in Greeley, however, and average rents may still be in a state of correction following the very large increases that were experienced in the final days of the oil and gas boom in 2008 and early 2009. However, even in Grand Junction, the year-over-year decline was less than 1 percent.