According to S&P;'s press release, home prices are still facing headwinds:
“Despite continued low interest rates and better real GDP growth in the fourth quarter, home prices continue to fall. Weakness was seen as 19 of 20 cities saw average home prices decline in November over October,” says David M. Blitzer, Chairman of the Index Committee at S&P; Indices. “The only positive for the month was Phoenix, one of the hardest hit in recent years. Annual rates were little better as 18 cities and both Composites were negative. Nationally, home prices are lower than a year ago. The 10-City Composite was down 3.6% and the 20-City was down 3.7% compared to November 2010. The trend is down and there are few, if any, signs in the numbers that a turning point is close at hand.
“The crisis low for the 10-City Composite was April 2009; for the 20-City Composite the more recent low was March 2011. The 10-City Composite is now about 1.0% above its low, and the 20-City Composite is only 0.6% above its low. From their 2006 peaks, both Composites are down close to 33% through November.
In year-over-year comparisons for November, Atlanta showed the largest drop, with a decline of 11.8 percent, while the index in Las Vegas fell 9.1 percent. Year over year, home price indices fell in 18 of the 20 cities included in the study. Only Washington, DC and Detroit showed increases.
The second chart shows trends in the Case-Shiller index for the Denver area and for the 20-city composite index. It is clear that Denver did not experience the kind of price bubble that occurred in many other metropolitan areas, and consequently, the index has not fallen nearly as far in Denver compared to the larger composite. Prices have been largely flat since mid-2009.
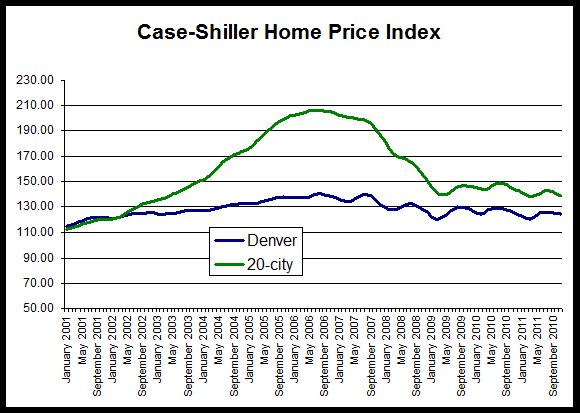
The 20-city composite is down 33 percent since it peaked in July 2006, but the Denver index is down only 11 percent from its August 2006 peak.
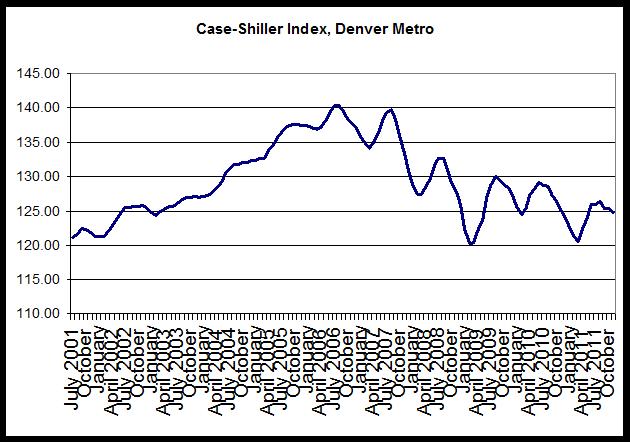
Nevertheless, the Denver index during October was at the lowest November value seen since 2002.
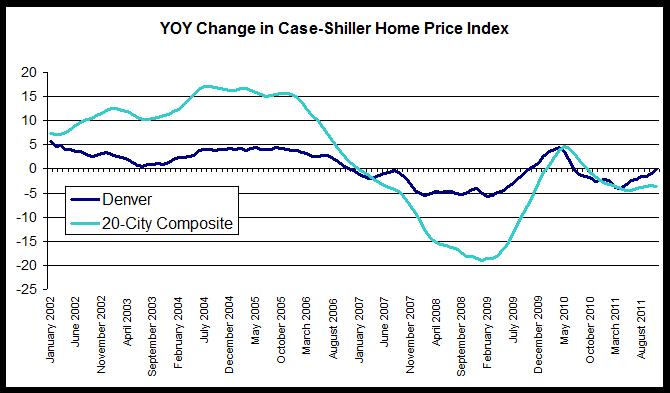
The third chart compares year-over-year changes in the Denver area index and in the 20-city composite. The Denver index did not achieve the rates of growth experienced by the national index, but the Denver index did not experience comparable rates of decline following the onset of the national recession either. Overall, the index has been less volatile in Denver than has been the case for the 20-city composite. However, year-over-year growth in the 20-city composite during November was negative with a decrease of 3.7 percent, and the Denver area index’s fall of 0.2 percent is the 17th month in a row in which the growth rate has been negative. In the 20-city index, the year-over-year change has been negative for the most recent 14 months.
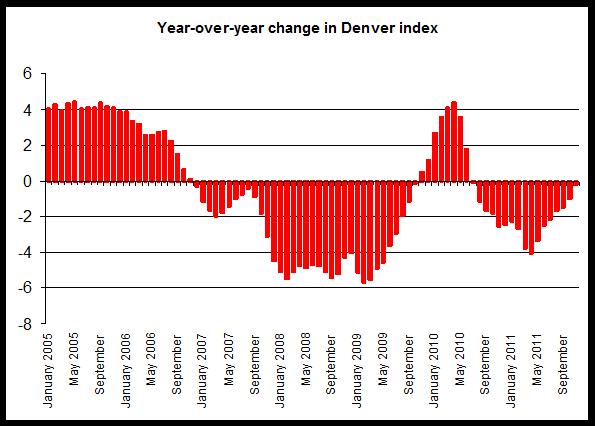
The last chart provides a closer look at year-over-year changes in the Denver index. Note the the change has been below zero since June 2010, and likely reflects the end of the homebuyer tax credit’s end which has led to a fall in demand and a decline in the home price index. The upward trend in the index in response to the tax credit is clear during late 2009 and early 2010. Since the end of the credit, however, home prices have consistently drifted downward.
0 comments:
Post a Comment