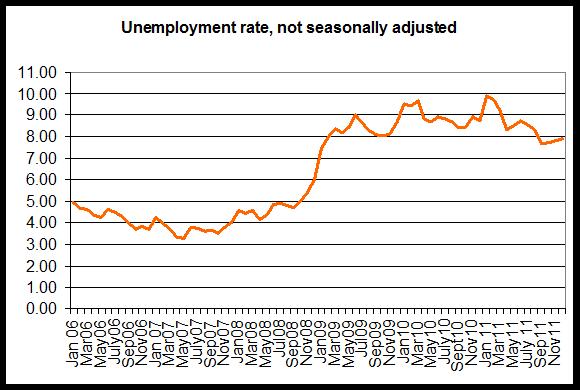
The unemployment rate remained largely flat from November to December in spite of job gains due to a relatively large number of workers joining the labor force.
From December 2010 to December 2011, total employment rose 3.3 percent, while the labor force rose 2.3 percent. The total labor force in December included 2.72 million workers.
As can be seen in the second graph, total employment and total workforce size have decreased slightly, month-over-month, and have fallen for the past two months. Year over year, both total employment and the labor force rose together. However, both remain well below the July 2008 peak.
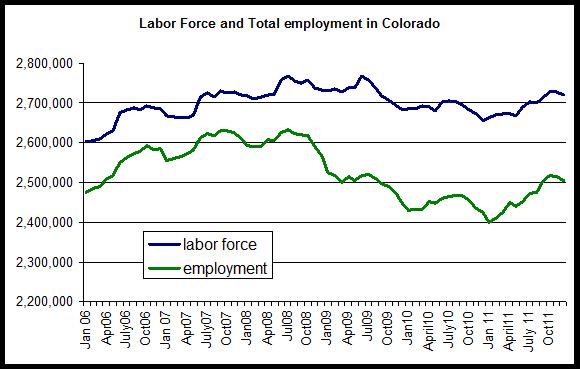
The employment total is now 128,000 jobs below the peak levels experienced during July 2008 when there were 2.63 million employed workers. Compared to the labor force peak in July 2008, the labor force is now down by more than 48,000 workers.
In the third graph is shown the year-over-year comparisons, by percent, for total employment. December 2011 was the sixth month in a row showing a positive year-over-year change in total employment. This followed 33 months in a row of negative job growth in year-over-year comparisons. At 3.3 percent, the year-over-year percent change in total employment was the largest gain since January 2007 and was at a 5-year high in December 2011. Between August 2008 and July 2011, no month posted a positive change in total employment when compared to the same month a year earlier.
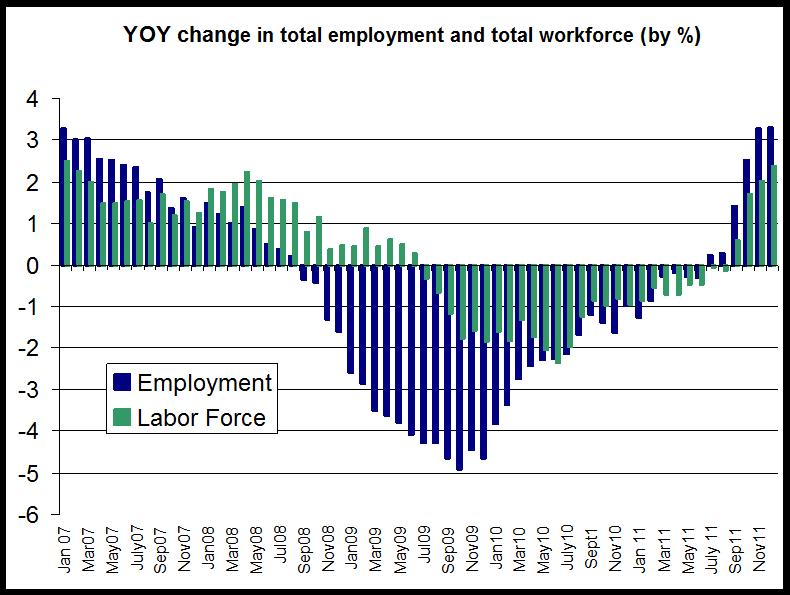
The graph also shows the year-over-change in the labor force. Total labor force size rose from December 2010 to December 2011, and was the fourth time that the labor force has grown, year over year, since June 2009 . The labor force size had shrunk, year over year, for 26 months in a row from July 2009 to August 2011.
These numbers come from the Household Survey employment data, so the size of the workforce is dependent on the number of people stating that they are actively looking for work if not employed. Discouraged workers who have stopped looking for work are excluded. On the other hand, the Household Survey picks up on small business and start-up employment that may be missed by the Establishment Survey, the other commonly-used measure of employment.
0 comments:
Post a Comment