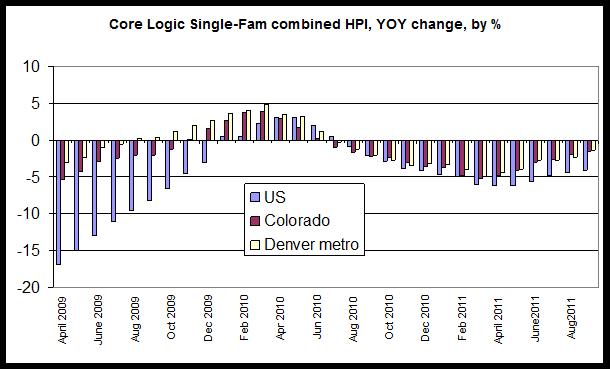
Home prices in Colorado fell 1.48 percent from September 2010 to September 2011, continuing a downward trend in home prices in Colorado and nationwide. Nevertheless, the degree to which homeprices have declined has lessed each month for the past five months. According to the September Home Price Index (HPI), released earlier this month by CoreLogic, The year-over-year decline for Colorado was the smallest decline in 13 months, and the drop for the Denver area was the smallest in 13 months. However, the trend in negative year-over-year changes continues and year-over-year changes have been negative for each month since July 2010.
Nationally, the index fell 4.1 percent, and it fell 1.3 percent in the Denver-Aurora-Broomfield metro area during the same period.
The graph shows the year-over-year changes for the past 29 months in the US, Colorado and the Denver metro area. Over the past two years, the general trend in all three areas has been shaped by the home buyer tax credit, which was introduced in 2008 and expired in April 2010. Clearly, home prices climbed throughout the duration of the tax credit period, but have declined since the credit's expiration.
During most months in the past two years, the Colorado and metro Denver HPI have performed better (from a property owner's perspective) than the national HPI. The national HPI has declined more than the local HPIs in each month since September 2010.
This data for September suggests that, although the year-over-year declines have lessened in magnitude, home prices have not yet turned around in Colorado as of September 2011. Local Realtor data, as well as the Case-Shiller data, all show that in year-over-yea comparisons, home prices continue to fall when compared to the same month in the prior year.
New pending home sales data from NAR suggests some new strength in home sales transactions at the regional level in some areas, but in Colorado statewide, home sales activity through September remains about equal with 2009.
See the home price data archive for more.
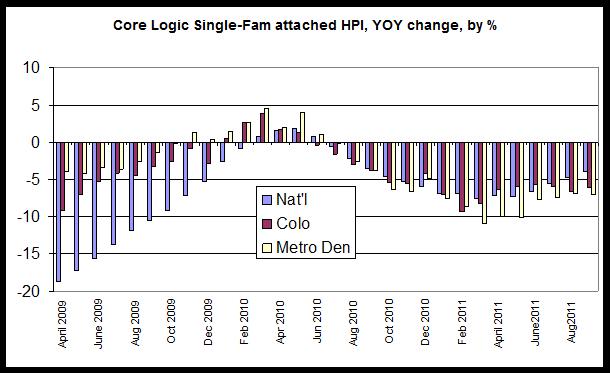
Corelogic also provides one of the few publicly-available indices that looks at home prices in attached homes such as condos and townhomes. Among attached homes, home prices have fallen significantly more than is the case for all single-family properties. Although the combined single-family Colorado index fell by 1.48 percent, year-over-year for September, the same index for attached housing fell by 6.12 percent. In the metro Denver area, the index for attached homes fell 7.05 percent. Notably, the national index in these types of properties shows a smaller decline than is the case in Colorado and Denver area.
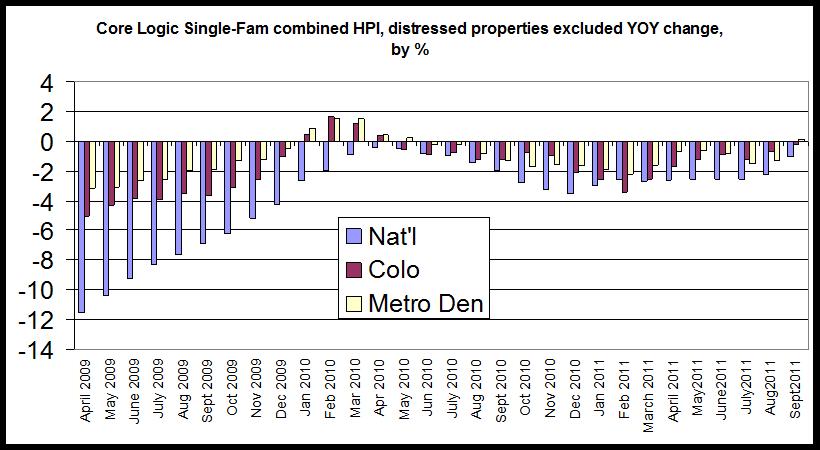
And finally, Corelogic provides a look at home prices with distressed properties excluded.
With distressed properties excluded, home prices were virtually flat from September 2010 to September 2011, with the Colorado index falling 0.19 percent year over year. During the same period, the national index fell 1.05 percent and the metro Denver index rose 0.1 percent.
So, we find that the declines in the home price indices are being driven in large part by the presence of distressed properties.
The CoreLogic HPI is a three-month weighted average of July, August and September (with September weighted the most) and is not seasonally adjusted.
0 comments:
Post a Comment