The report notes that, in general, release activity responds to movements in the mortgage rate in ways very similar to that seen in mortgage refinance activity. For example, in the first chart, we see that there was a surge in release activity in 2003.
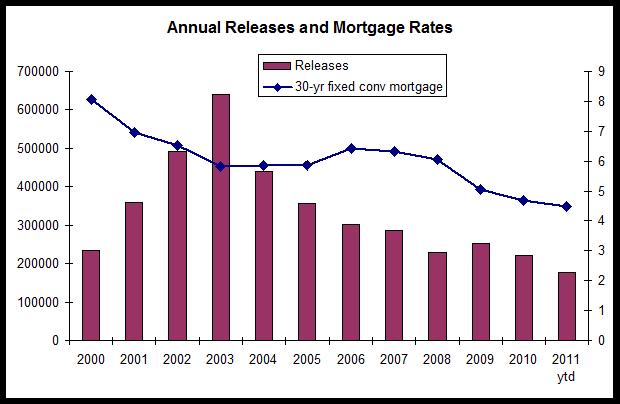
The economics site Calculated Risk provides a historical chart on refinance activity in which we see a similar surge in 2003 at the national level. Refis also experienced a surge in 2009 following declines in the mortgage rate following the financial crisis. In Colorado, releases headed up in 2009, although one might hesitate to call 2009's increases in release activity a "surge." Nevertheless, releases did respond positively to the decline in mortgage rates during 2009.
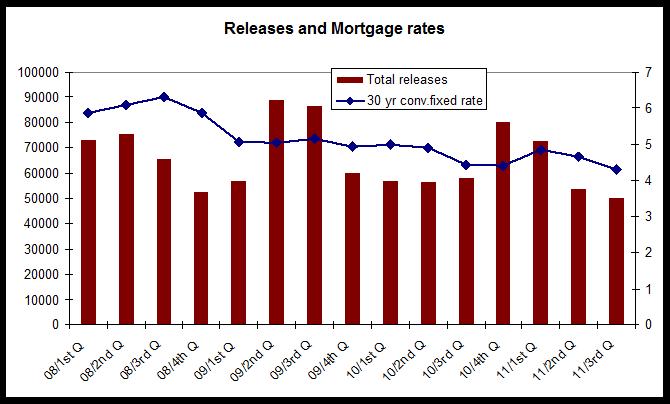
The most recent mortgage refinance data from MBA suggests that refinance activity has been flat nationally during 2011. We saw similar trends in release data which show that 2011's totals are likely to be similar to 2010. The second graph shows how release totals have declined over the past three quarters.
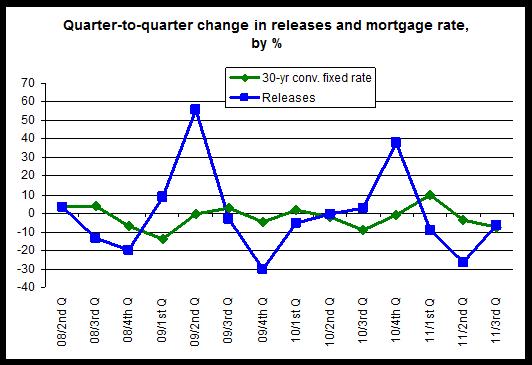
If we analyze movements in releases against movements in the mortgage rate, we find that almost 2/3 of the time, when the mortgage rate moves in one direction during a quarter, the number of releases will move in the opposite direction the following quarter.
For example, the average mortgage rate declined 13 percent during the first quarter of 2009. During the following quarter, releases rose 55 percent. Also, during the third quarter of 2010, average mortgage rates fell 9 percent, and during the following quarter, releases rose 37 percent. By contrast, during the first quarter of 2011, the mortgage rate rose 9 percent and during the following quarter, releases fell 26 percent. Other quarter show less dramatic change, but the general relationship between mortgage rates and release activity holds.
This relationship was not true during the third quarter of this year. During the second quarter of 2009, mortgage rates decreased almost four percent, but they went down more than 6 percent during the following quarter. There have been other quarters during which mortgage rates decreased but did not lead to an increase in release activity during the following quarter. For example, the mortgage rate decreased during the fourth quarter of 2009, but releases fell 5 percent during the first quarter of 2010.
The fact that interest rates and release activity have declined together over the past quarter does not prove that markets are no longer responding at all, of course, but since we know that tighter lending standards have led to a decrease in the number of potential buyers, it does suggest that the decline in the mortgage rate has not been enough to overcome limitations on demand imposed by higher credit and downpayment requirements.
The third graph shows percent changes in releases against changes in the mortgage rate. Note that, in general, when the green line falls below zero, the blue line moves above zero during the following quarter:
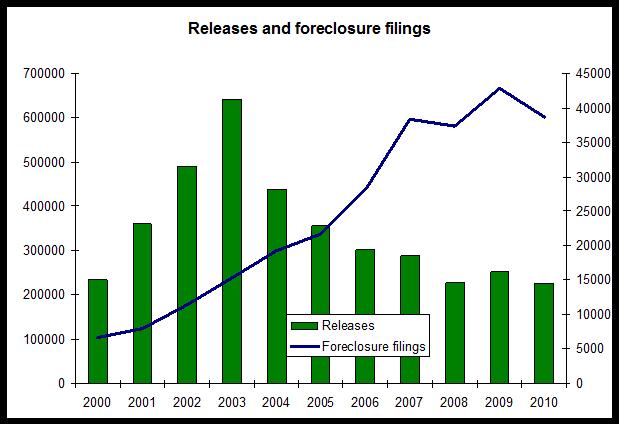
Finally, for those who are interested, I've included a historical chart on foreclosures vs. releases. An run up in refi and purchase activity begins in 2002 following the 2001 national recession. Releases peak in 2003 and then decline, which is then followed by foreclosure activity that peaks in 2007 and then falls in 2008. Foreclosures then peak again in 2009 as a result of job losses following the financial crisis.