According to S&P;'s press release, home prices are still facing headwinds:
“Home prices drifted lower in September and the third quarter,” says David M. Blitzer, Chairman of the Index Committee at S&P; Indices. “The National Index was down 3.9% versus the third quarter of 2010 and up only 0.1% from the previous quarter. Three cities posted new index lows in September 2011 - Atlanta, Las Vegas and Phoenix. Seventeen of the 20 cities and both Composites were down for the month. Over the last year home prices in most cities drifted lower. The plunging collapse of prices seen in 2007-2009 seems to be behind us. Any chance for a sustained recovery will probably need a stronger economy."
In year-over-year comparisons for September, Minneapolis again showed the largest drop, with a decline of 7.4 percent, while the index in Las Vegas fell 7.3 percent. Year over year, home price indices fell in 18 of the 20 cities included in the study. Only Washington, DC and Detroit showed increases.
The second chart shows trends in the Case-Shiller index for the Denver area and for the 20-city composite index. It is clear that Denver did not experience the kind of price bubble that occurred in many other metropolitan areas, and consequently, the index has not fallen nearly as far in Denver compared to the larger composite. Prices have been largely flat since mid-2009.
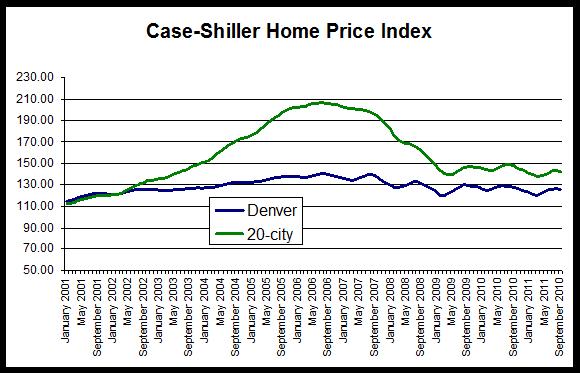
The 20-city composite is down 31.3 percent since it peaked in July 2006, but the Denver index is down only 10.5 percent from its August 2006 peak.
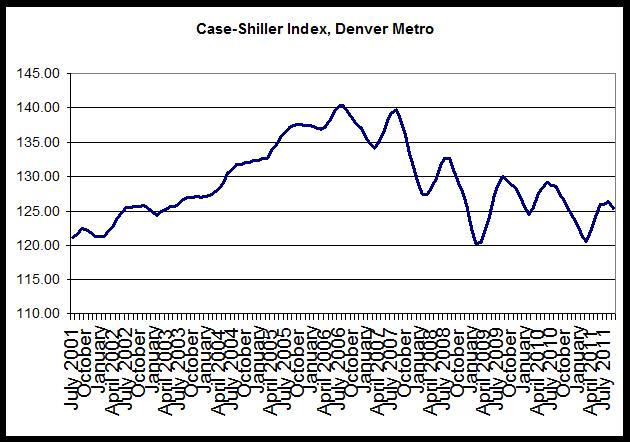
Nevertheless, the Denver index during August was at the lowest September value seen since 2003.
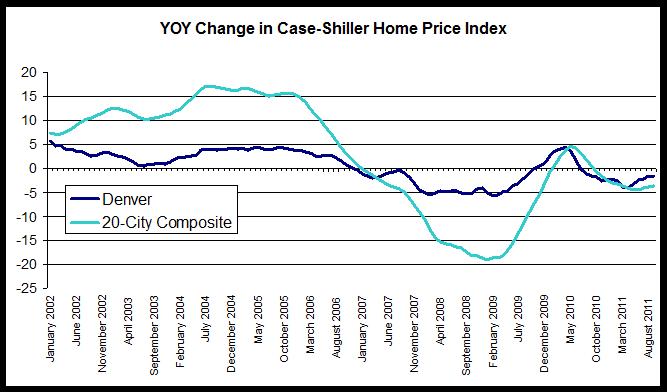
The third chart compares year-over-year changes in the Denver area index and in the 20-city composite. The Denver index did not achieve the rates of growth experienced by the national index, but the Denver index did not experience comparable rates of decline following the onset of the national recession either. Overall, the index has been less volatile in Denver than has been the case for the 20-city composite. However, year-over-year growth in the 20-city composite during September was negative with a decrease of 3.6 percent, and the Denver area index’s fall of 1.5 percent is the 15th month in a row in which the growth rate has been negative. In the 20-city index, the year-over-year change has been negative for the most recent 12 months.
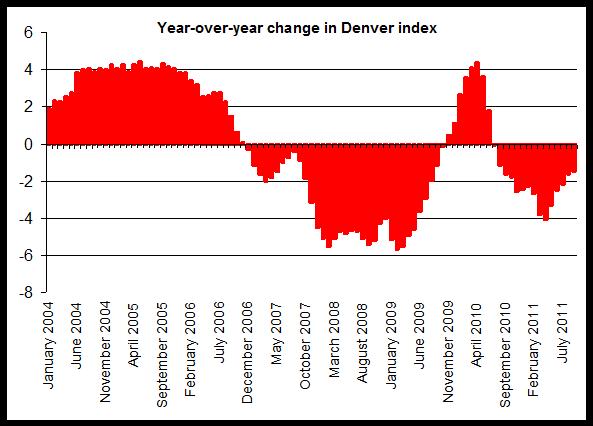
The last chart provides a closer look at year-over-year changes in the Denver index. Note the the change has been below zero since June 2010, and likely reflects the end of the homebuyer tax credit’s end which has led to a fall in demand and a decline in the home price index. The upward trend in the index in response to the tax credit is clear during late 2009 and early 2010. Since the end of the credit, however, home prices have consistently drifted downward.
0 comments:
Post a Comment