Nationally, the CPI increased 3.5 percent, year-over-year, and was driven by increases in food and transportion costs, according to the BLS release:
A decline in the energy index more than offset small increases in the
indexes for food and all items less food and energy to create the all
items decline. The energy index turned down in October after
increasing in each of the three previous months as the gasoline and
household energy indexes declined after a series of seasonally
adjusted increases. The food index rose in October, but posted its
smallest increase of the year as the fruits and vegetables index
declined sharply.
In the first graph, which shows CPI change in the West region, we can see that the CPI growth in October 2011 is now the second-highest increase observed for October during the past ten years. Only 2008 showed larger increases. Price increases in those years were partially countered by strong growth in employment and incomes, but income growth has been flat in recent years, as discussed here.
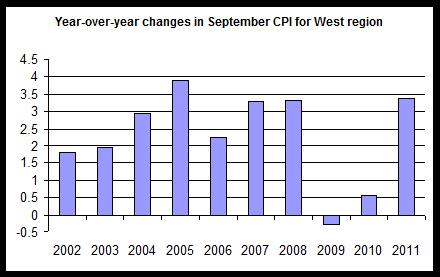
In the West region, as well as nationally, price increases are being largely driven by transportation costs, which increased by 8.4 percent, year over year. Food costs also increased significantly, rising 4.1 percent, while apparel rose 4.4 percent. Price increases in housing have begun to inch up with September's year-over-year increase at 1.6 percent. Housing costs to consumers continue to be muted as a result of declining prices in purchase housing. Prices will likely move upward slowly as rent increases in the face of increasing demand and little new construction.
Recent price increases will impact household calculations and attitudes on spending as many households conclude that discretionary spending will need to be scaled back in the face of increasing food and transportation costs. These price increases come in the face of continued lackluster performance in the labor markets.
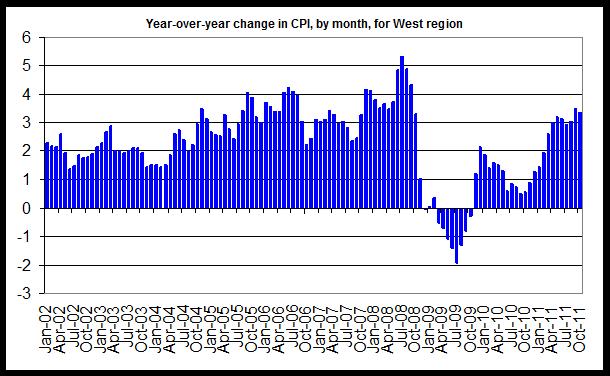
The second graph shows year-over-year changes in CPI for all months since 2002. October's CPI showed the second-largest month-over-month increase reported since September 2008.
0 comments:
Post a Comment