According to S&P;'s press release, home prices are still facing headwinds:
“Despite some positive economic signs, home prices continued to drop. The 10- and 20- City Composites and eight cities - Atlanta, Chicago, Cleveland, Las Vegas, New York, Portland, Seattle and Tampa - made new lows,” says David M. Blitzer, Chairman of the Index Committee at S&P; Indices. “Detroit and Phoenix, two cities that have suffered massive price declines, plus Denver, saw increasing prices versus January 2011. The 10-City Composite was down 3.9% and the 20-City was down 3.8% compared to January 2011.
In year-over-year comparisons for January, Atlanta showed the largest drop, with a decline of 14.8 percent, while the index in Las Vegas fell 9.0 percent. Year over year, home price indices fell in 16 of the 20 cities included in the study. Only Detroit, Denver and Phoenix showed increases.
The second chart shows trends in the Case-Shiller index for the Denver area and for the 20-city composite index. It is clear that Denver did not experience the kind of price bubble that occurred in many other metropolitan areas, and consequently, the index has not fallen nearly as far in Denver compared to the larger composite. Prices have been largely flat since mid-2009.
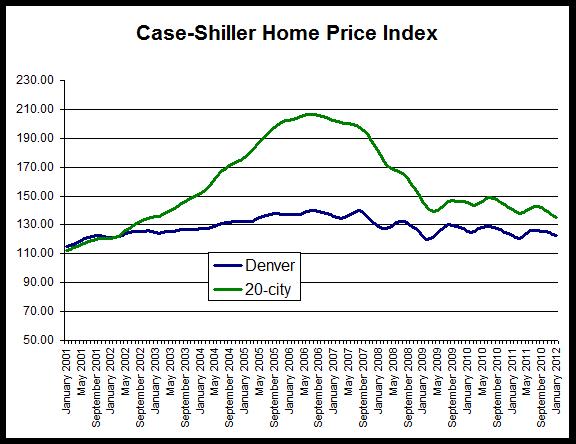
The 20-city composite is down 34 percent since it peaked in July 2006, but the Denver index is down only 12 percent from its August 2006 peak.
Although the Denver index turned positive in January, compared to January of last year, the Denver index during January was at levels comparable to those found during 2002.
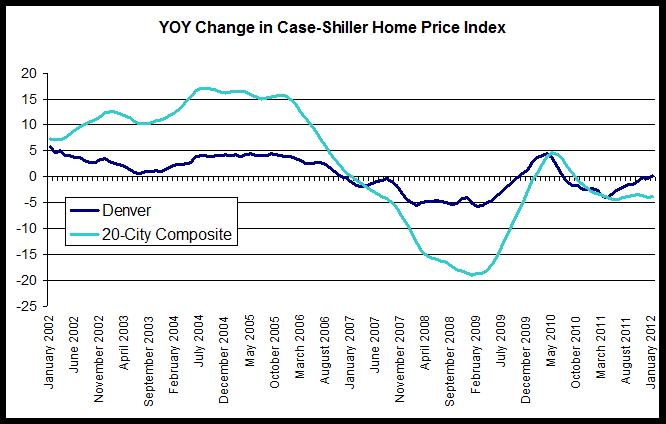
The third chart compares year-over-year changes in the Denver area index and in the 20-city composite. The Denver index did not achieve the rates of growth experienced by the national index, but the Denver index did not experience comparable rates of decline following the onset of the national recession either. Overall, the index has been less volatile in Denver than has been the case for the 20-city composite, and the rates of decline in Denver have been smaller in recent months. The year-over-year change in the 20-city composite during January was negative with a decrease of 3.8 percent while Denver reported a slight increase. In the 20-city index, the year-over-year change has been negative for the past 16 months.
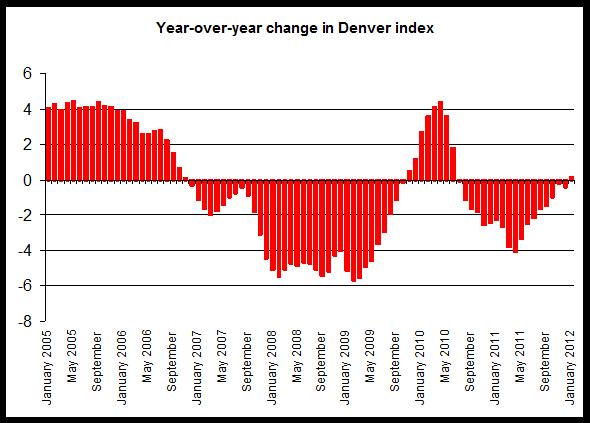
The last chart provides a closer look at year-over-year changes in the Denver index. Note the the change was below zero between June 2010 and December 2011, and likely reflects the end of the homebuyer tax credit’s end which has led to a fall in demand and a decline in the home price index. The upward trend in the index in response to the tax credit is clear during late 2009 and early 2010. Since the end of the credit, however, home prices have consistently drifted downward.