In the meantime, we have run some growth comparisons between the counties. The following analysis looks at household formation in each county. Household formation is defined as the change in the number of occupied housing units from one year to the next. 2010 data is presently the most recent data available. See below for the full table.
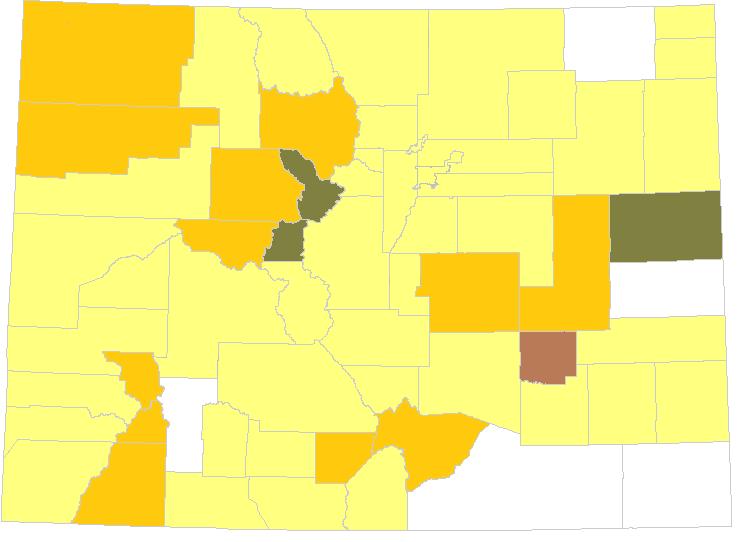
Each of the counties in the following maps is divided into the following quartiles (with the top quartile being the quartile with the most growth in households):
Top quartile: brown
Second quartile: Green
Third quartile: Orange
Bottom quartile: Yellow, White
(Negative growth: White)
The first map shows the one-year percent change for each county from 2009 to 2010. during this period, the number of households/occupied housing units increased 1.7 percent statewide. There is a surprising amount of household formation in the central plains counties and rural resort counties showed more growth than most of the state. El Paso County was the only metropolitan county that was not in the bottom quartile for growth.
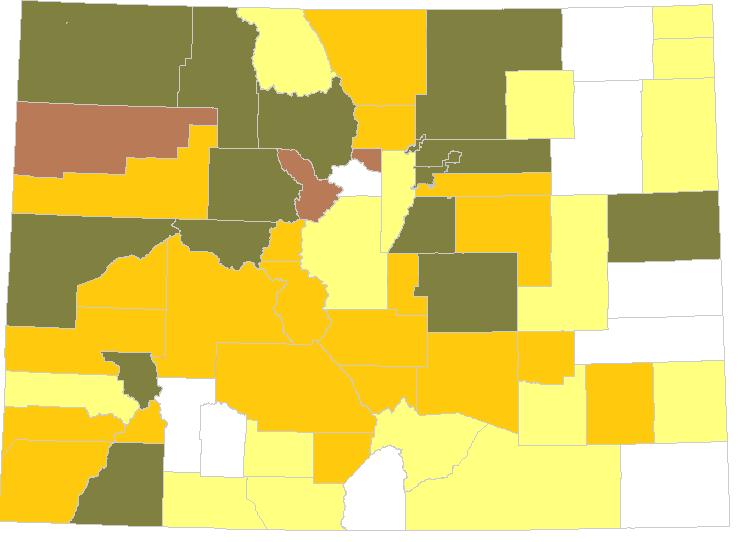
The second map shows the three-year change in households (2007-2010). During this period, the number of households grew 5.4 percent statewide. In this case we see much of the growth taking place along the Front Range north of Pueblo, in the rural resort areas, and in northwestern Colorado. Several plains counties showed a declining number of households. The 3-year time period is essentially a post-recession period that reflect household growth since the national recession began at the end of 2007.
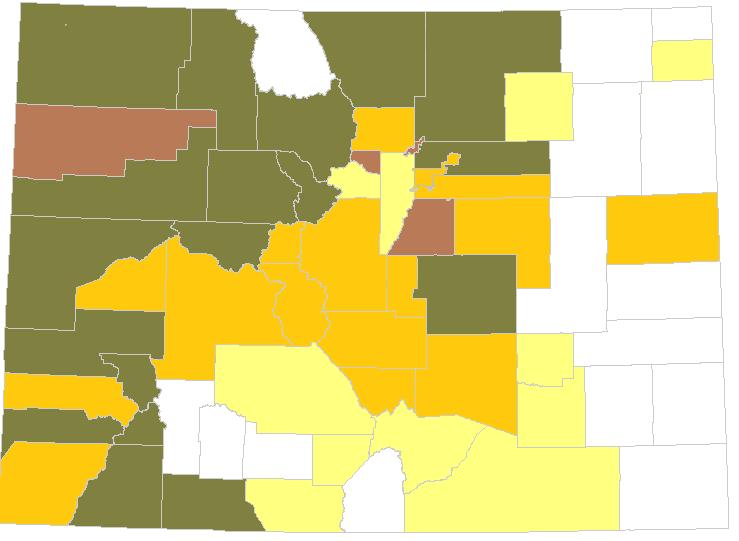
The third map shows a five-year time frame (2005-2010) in which the overall trends found in the 3-year time frame are little changed. During this period, the number of households grew 9.4 percent statewide. Growth is strongest in rural resort areas and in the Front Range north of Pueblo. The growth is more widespread throughout the Western Slope, during this period, however, reflecting oil and gas job growth that was quite strong from 2006 to 2008.
The final map shows the change in the number of households over 10 years (2001-2010). during this period, the number of households grew 15.4 percent statewide. Over a ten-year time period, we find that the strongest growth is found in Broomfield and Douglas counties, and also in Weld, San Juan and Ouray counties. No county on the eastern plains but Elbert is found outside the bottom quartile for this period.
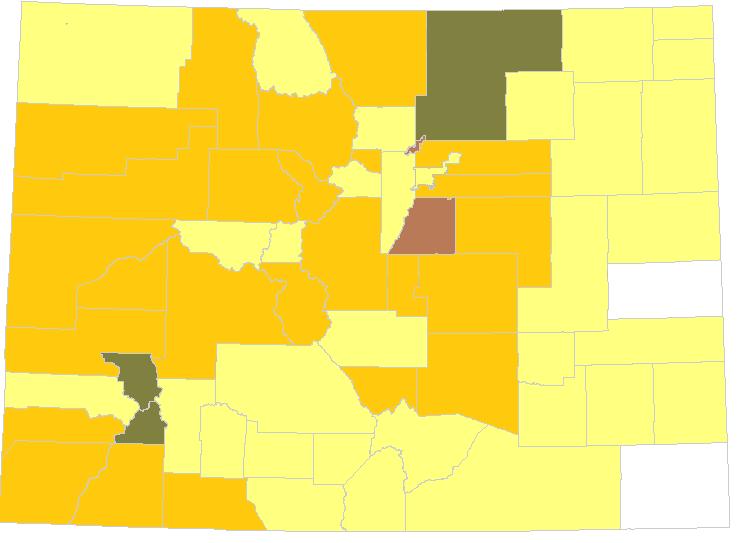
Except for the one-year change from 2009 to 2010, household formation over time clearly shows a general trend in which the strongest growth is in the mountain resort counties, the Front Range north of Pueblo and the Western Slope. The areas with the smallest growth are consistently found along the eastern plains, southeastern Colorado, and in the San Luis Valley.
| Area | 1-year change | 3-year change | 5-year change | 10-year change |
|---|---|---|---|---|
| COLORADO STATE | 1.7 | 5.4 | 9.4 | 15.4 |
| ADAMS COUNTY | 1.6 | 6.4 | 11.6 | 21.9 |
| ALAMOSA COUNTY | 3.5 | 4.4 | 4.5 | 7.5 |
| ARAPAHOE COUNTY | 2.0 | 5.5 | 9.0 | 14.7 |
| ARCHULETA COUNTY | 1.7 | 1.6 | 9.8 | 23.7 |
| BACA COUNTY | -0.1 | -3.7 | -5.2 | -10.6 |
| BENT COUNTY | 1.5 | 3.6 | -4.9 | -7.9 |
| BOULDER COUNTY | 1.4 | 3.6 | 5.8 | 6.3 |
| BROOMFIELD COUNTY | 1.4 | 6.6 | 19.4 | 42.7 |
| CHAFFEE COUNTY | 1.3 | 4.9 | 6.9 | 13.3 |
| CHEYENNE COUNTY | -0.1 | -2.1 | -7.1 | -9.4 |
| CLEAR CREEK COUNTY | 1.3 | -0.3 | 0.4 | 2.4 |
| CONEJOS COUNTY | 1.7 | 0.2 | 0.6 | 4.7 |
| COSTILLA COUNTY | 1.2 | -2.1 | -1.1 | 0.3 |
| CROWLEY COUNTY | 10.8 | 6.0 | 2.4 | -1.1 |
| CUSTER COUNTY | 0.1 | 3.2 | 7.3 | 21.1 |
| DELTA COUNTY | 1.8 | 4.8 | 7.1 | 12.1 |
| DENVER COUNTY | 1.4 | 6.4 | 9.0 | 9.0 |
| DOLORES COUNTY | 0.8 | 3.7 | 10.4 | 12.9 |
| DOUGLAS COUNTY | 2.0 | 7.7 | 19.0 | 48.1 |
| EAGLE COUNTY | 3.2 | 7.8 | 12.2 | 19.0 |
| EL PASO COUNTY | 2.8 | 6.8 | 11.0 | 18.8 |
| ELBERT COUNTY | 1.5 | 4.8 | 7.2 | 14.9 |
| FREMONT COUNTY | 2.6 | 3.4 | 5.2 | 6.2 |
| GARFIELD COUNTY | 1.1 | 5.8 | 12.5 | 19.5 |
| GILPIN COUNTY | 1.7 | 12.0 | 15.5 | 18.6 |
| GRAND COUNTY | 3.2 | 6.5 | 10.9 | 18.0 |
| GUNNISON COUNTY | 0.3 | 3.4 | 7.9 | 12.1 |
| HINSDALE COUNTY | -4.2 | -6.2 | -2.2 | -0.5 |
| HUERFANO COUNTY | 3.9 | 2.4 | 1.4 | 1.7 |
| JACKSON COUNTY | 1.7 | 1.4 | -1.5 | -4.1 |
| JEFFERSON COUNTY | 0.9 | 2.9 | 4.5 | 5.4 |
| KIOWA COUNTY | 1.3 | -2.8 | -5.5 | -6.6 |
| KIT CARSON COUNTY | 6.8 | 7.2 | 5.5 | 1.1 |
| LA PLATA COUNTY | 3.2 | 7.0 | 10.7 | 17.0 |
| LAKE COUNTY | 6.1 | 5.0 | 5.1 | -1.5 |
| LARIMER COUNTY | 1.1 | 5.8 | 10.9 | 19.0 |
| LAS ANIMAS COUNTY | 0.0 | 0.6 | 1.3 | 1.6 |
| LINCOLN COUNTY | 4.6 | 2.5 | -1.5 | -6.2 |
| LOGAN COUNTY | -5.8 | -4.3 | -2.4 | -2.0 |
| MESA COUNTY | 1.2 | 6.5 | 13.4 | 22.5 |
| MINERAL COUNTY | 0.3 | -9.0 | -7.6 | -5.9 |
| MOFFAT COUNTY | 3.9 | 6.8 | 10.0 | 10.3 |
| MONTEZUMA COUNTY | 1.9 | 3.9 | 7.7 | 13.6 |
| MONTROSE COUNTY | 1.4 | 5.8 | 12.5 | 22.1 |
| MORGAN COUNTY | 1.6 | 2.9 | 3.1 | 6.3 |
| OTERO COUNTY | 1.1 | 1.6 | 0.2 | -0.8 |
| OURAY COUNTY | 2.9 | 7.0 | 13.5 | 25.5 |
| PARK COUNTY | 2.3 | 1.9 | 5.5 | 15.7 |
| PHILLIPS COUNTY | 1.3 | 1.1 | 0.1 | 2.3 |
| PITKIN COUNTY | 3.4 | 9.0 | 9.8 | 9.6 |
| PROWERS COUNTY | 0.2 | 0.2 | -4.0 | -5.4 |
| PUEBLO COUNTY | 1.5 | 3.8 | 7.6 | 13.2 |
| RIO BLANCO COUNTY | 5.1 | 9.9 | 15.8 | 15.8 |
| RIO GRANDE COUNTY | 1.0 | 0.6 | -2.8 | 1.4 |
| ROUTT COUNTY | 2.0 | 6.8 | 11.7 | 18.5 |
| SAGUACHE COUNTY | 1.9 | 3.2 | 3.0 | 10.5 |
| SAN JUAN COUNTY | 4.2 | 4.2 | 11.1 | 27.8 |
| SAN MIGUEL COUNTY | 1.6 | 1.6 | 6.0 | 9.0 |
| SEDGWICK COUNTY | 0.9 | 0.8 | -3.7 | -5.4 |
| SUMMIT COUNTY | 6.5 | 9.2 | 11.6 | 13.3 |
| TELLER COUNTY | 1.7 | 3.5 | 8.2 | 15.4 |
| WASHINGTON COUNTY | 1.9 | -0.4 | -0.8 | -0.4 |
| WELD COUNTY | 1.8 | 6.7 | 14.2 | 33.3 |
| YUMA COUNTY | 0.5 | 2.6 | 2.8 | 3.9 |