We'll be releasing the 2011 year-end and fourth-quarter foreclosure data for all counties on Wednesday, February 1, 2012.
We'll release the fourth-quarter vacancy and rent data for metro Denver on Thursday, February 2, 2012.
Tuesday, January 31, 2012
Colorado Regional Employment: Job growth in all metros since 2010
Total employment growth in Colorado in December hit a five-year high in the year-over-year comparisons. In December, total employment in Colorado was down 128,000 from the July 2008 peak. Employment trends in various regions of the state differ, however, so this article looks at which regions of the state have the highest unemployment rates, and which regions have recovered the most in their labor markets.
Regional employment trends can also provide us with some insights into local housing demand since, all things being equal, those areas with the most robust labor demand will also have the strongest demand for housing. This would be reflected in apartment vacancy rates and in median home price and home sales transactions, among other indicators.
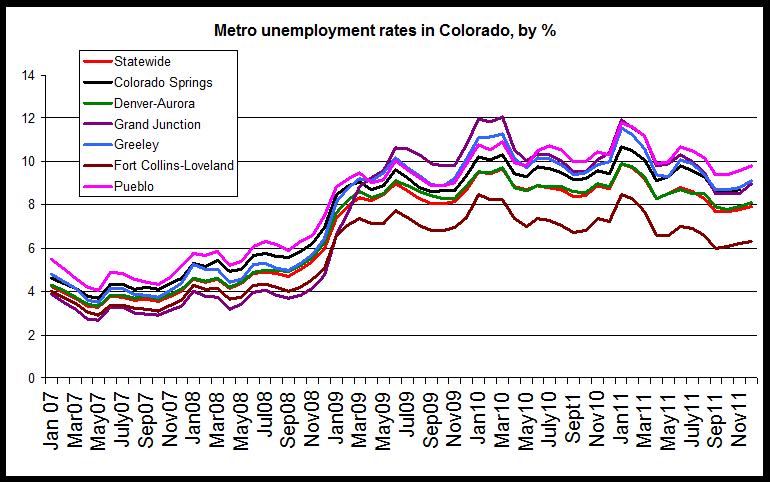
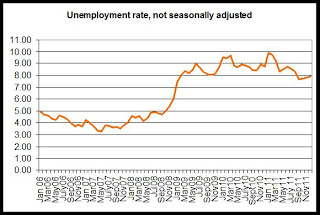
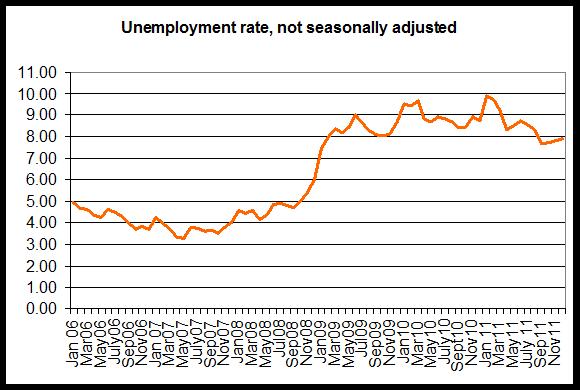
The first graph compares unemployment rates in Colorado's metro areas.
The regional unemployment rates (not seasonally adjusted) for December 2011 are:
Colorado Springs, 9.0%
Denver-Aurora, 7.9%
Fort Collins-Loveland, 6.3%
Grand Junction, 9.0%
Greeley, 9.1%
Pueblo, 9.8%
Statewide, 7.9%
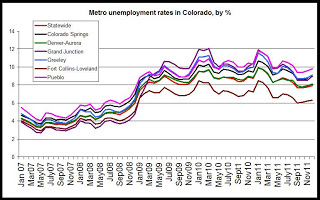
Since mid-2009, The Fort Collins-Loveland area has consistently shown one of the lowest unemployment rates while Grand Junction and Pueblo have generally shown the highest rates.
Year over year, the unemployment rate decreased in all metro areas. In Pueblo, where the highest metro unemployment rate was found, the rate decreased from 10.3 percent to 9.8 percent, year over year. In the Fort Collins-Loveland area, where the rates were lowest, the unemployment rate fell from 7.2 percent to 6.3 percent during the same period.
The unemployment rate is a reflection of both the total number of employed persons and the total size of the labor force (as reflected in the Household Survey), so the unemployment rate can decrease even in times of falling total employment if the size of the labor force decreases as well.
To provide some additional context, we can look to see how far below total employment levels are below the most recent peak in employment in each region. The peak time differs in each region. For example, the labor market peaked in mid-2007 in the Colorado Springs area, but it did not peak until late 2008 in the Grand Junction area.
The following numbers reflect how far below the most recent peak are the October 2011 employment totals:
Colorado Springs MSA, 8.7%
Denver-Aurora MSA, 5.2%
Fort Collins-Loveland MSA, 3.2%
Grand Junction MSA, 13.1%
Greeley MSA 7.3%
Pueblo MSA, 1.8%
Statewide, 4.8%
All things being equal, the areas further below the peak have recovered the least from initial job losses.
By far, Grand Junction remains the furthest below peak levels.
The Pueblo area and the Fort Collins-Loveland area, are nearest to peak levels, although Pueblo still reports a relatively high unemployment rate. The fort Collins-Loveland area, on the other hand, reports the lowest unemployment rate of the metro areas.
(Note: If we include the Boulder-Longmont MSA, we find that the Boulder area has consistently been among the areas with the lowest unemployment rate. In December 2011, the rate in the Boulder-Longmont area was 5.8%.)
Impact on Housing
The metro areas with the most job growth should generally also be the areas with the most demand for housing. We do see this reflected to a certain extent in the apartment vacancy data and in job growth.
We expect the demand for housing to continue to be strongest in the Fort Collins-Loveland area and in metro Denver.
Regional employment trends can also provide us with some insights into local housing demand since, all things being equal, those areas with the most robust labor demand will also have the strongest demand for housing. This would be reflected in apartment vacancy rates and in median home price and home sales transactions, among other indicators.
The first graph compares unemployment rates in Colorado's metro areas.
The regional unemployment rates (not seasonally adjusted) for December 2011 are:
Colorado Springs, 9.0%
Denver-Aurora, 7.9%
Fort Collins-Loveland, 6.3%
Grand Junction, 9.0%
Greeley, 9.1%
Pueblo, 9.8%
Statewide, 7.9%
Since mid-2009, The Fort Collins-Loveland area has consistently shown one of the lowest unemployment rates while Grand Junction and Pueblo have generally shown the highest rates.
Year over year, the unemployment rate decreased in all metro areas. In Pueblo, where the highest metro unemployment rate was found, the rate decreased from 10.3 percent to 9.8 percent, year over year. In the Fort Collins-Loveland area, where the rates were lowest, the unemployment rate fell from 7.2 percent to 6.3 percent during the same period.
The unemployment rate is a reflection of both the total number of employed persons and the total size of the labor force (as reflected in the Household Survey), so the unemployment rate can decrease even in times of falling total employment if the size of the labor force decreases as well.
To provide some additional context, we can look to see how far below total employment levels are below the most recent peak in employment in each region. The peak time differs in each region. For example, the labor market peaked in mid-2007 in the Colorado Springs area, but it did not peak until late 2008 in the Grand Junction area.
The following numbers reflect how far below the most recent peak are the October 2011 employment totals:
Colorado Springs MSA, 8.7%
Denver-Aurora MSA, 5.2%
Fort Collins-Loveland MSA, 3.2%
Grand Junction MSA, 13.1%
Greeley MSA 7.3%
Pueblo MSA, 1.8%
Statewide, 4.8%
All things being equal, the areas further below the peak have recovered the least from initial job losses.
By far, Grand Junction remains the furthest below peak levels.
The Pueblo area and the Fort Collins-Loveland area, are nearest to peak levels, although Pueblo still reports a relatively high unemployment rate. The fort Collins-Loveland area, on the other hand, reports the lowest unemployment rate of the metro areas.
(Note: If we include the Boulder-Longmont MSA, we find that the Boulder area has consistently been among the areas with the lowest unemployment rate. In December 2011, the rate in the Boulder-Longmont area was 5.8%.)
Impact on Housing
The metro areas with the most job growth should generally also be the areas with the most demand for housing. We do see this reflected to a certain extent in the apartment vacancy data and in job growth.
We expect the demand for housing to continue to be strongest in the Fort Collins-Loveland area and in metro Denver.
Case-Shiller: Metro Denver home prices at 2002 levels
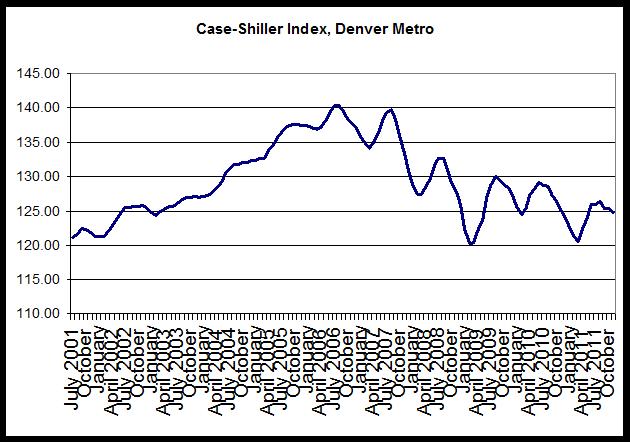
Case-Shiller released its home price index for November today. The home price index for the Denver area fell 0.5 percent from October to November, and fell 0.2 percent,year over year, from November 2010 to November 2011. Prices fell in November due at least partially to seasonal factors, although the overall index for the year remains below the index values seen during 2010. The first graph shows the index values since 2001:
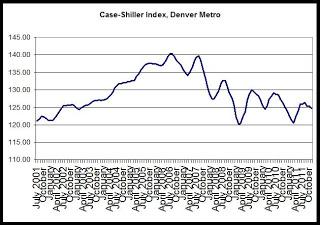
According to S&P;'s press release, home prices are still facing headwinds:
In year-over-year comparisons for November, Atlanta showed the largest drop, with a decline of 11.8 percent, while the index in Las Vegas fell 9.1 percent. Year over year, home price indices fell in 18 of the 20 cities included in the study. Only Washington, DC and Detroit showed increases.
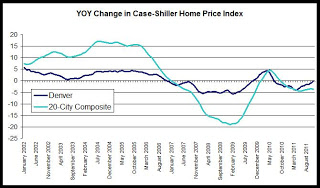
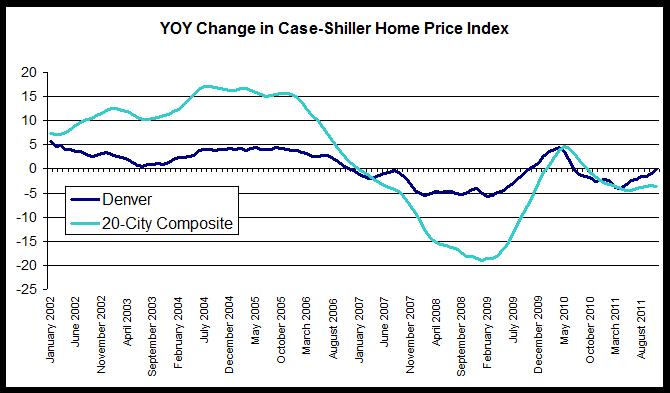
The second chart shows trends in the Case-Shiller index for the Denver area and for the 20-city composite index. It is clear that Denver did not experience the kind of price bubble that occurred in many other metropolitan areas, and consequently, the index has not fallen nearly as far in Denver compared to the larger composite. Prices have been largely flat since mid-2009.
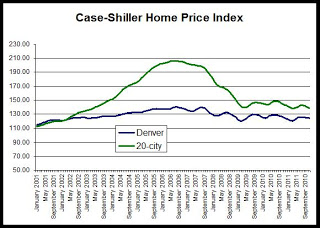
The 20-city composite is down 33 percent since it peaked in July 2006, but the Denver index is down only 11 percent from its August 2006 peak.
Nevertheless, the Denver index during October was at the lowest November value seen since 2002.
The third chart compares year-over-year changes in the Denver area index and in the 20-city composite. The Denver index did not achieve the rates of growth experienced by the national index, but the Denver index did not experience comparable rates of decline following the onset of the national recession either. Overall, the index has been less volatile in Denver than has been the case for the 20-city composite. However, year-over-year growth in the 20-city composite during November was negative with a decrease of 3.7 percent, and the Denver area index’s fall of 0.2 percent is the 17th month in a row in which the growth rate has been negative. In the 20-city index, the year-over-year change has been negative for the most recent 14 months.
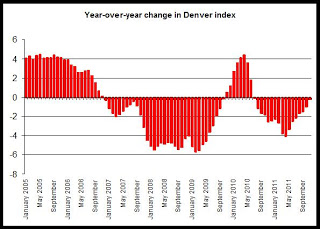
The last chart provides a closer look at year-over-year changes in the Denver index. Note the the change has been below zero since June 2010, and likely reflects the end of the homebuyer tax credit’s end which has led to a fall in demand and a decline in the home price index. The upward trend in the index in response to the tax credit is clear during late 2009 and early 2010. Since the end of the credit, however, home prices have consistently drifted downward.
According to S&P;'s press release, home prices are still facing headwinds:
“Despite continued low interest rates and better real GDP growth in the fourth quarter, home prices continue to fall. Weakness was seen as 19 of 20 cities saw average home prices decline in November over October,” says David M. Blitzer, Chairman of the Index Committee at S&P; Indices. “The only positive for the month was Phoenix, one of the hardest hit in recent years. Annual rates were little better as 18 cities and both Composites were negative. Nationally, home prices are lower than a year ago. The 10-City Composite was down 3.6% and the 20-City was down 3.7% compared to November 2010. The trend is down and there are few, if any, signs in the numbers that a turning point is close at hand.
“The crisis low for the 10-City Composite was April 2009; for the 20-City Composite the more recent low was March 2011. The 10-City Composite is now about 1.0% above its low, and the 20-City Composite is only 0.6% above its low. From their 2006 peaks, both Composites are down close to 33% through November.
In year-over-year comparisons for November, Atlanta showed the largest drop, with a decline of 11.8 percent, while the index in Las Vegas fell 9.1 percent. Year over year, home price indices fell in 18 of the 20 cities included in the study. Only Washington, DC and Detroit showed increases.
The second chart shows trends in the Case-Shiller index for the Denver area and for the 20-city composite index. It is clear that Denver did not experience the kind of price bubble that occurred in many other metropolitan areas, and consequently, the index has not fallen nearly as far in Denver compared to the larger composite. Prices have been largely flat since mid-2009.
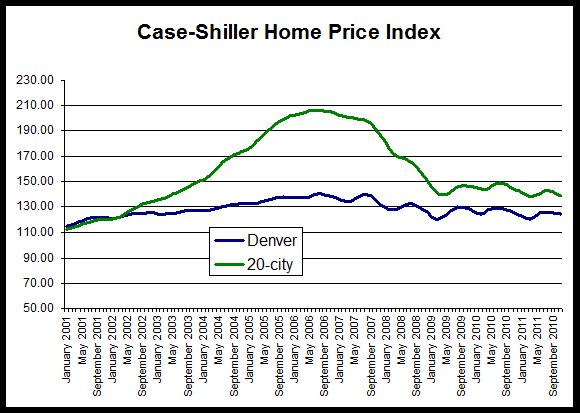
The 20-city composite is down 33 percent since it peaked in July 2006, but the Denver index is down only 11 percent from its August 2006 peak.
Nevertheless, the Denver index during October was at the lowest November value seen since 2002.
The third chart compares year-over-year changes in the Denver area index and in the 20-city composite. The Denver index did not achieve the rates of growth experienced by the national index, but the Denver index did not experience comparable rates of decline following the onset of the national recession either. Overall, the index has been less volatile in Denver than has been the case for the 20-city composite. However, year-over-year growth in the 20-city composite during November was negative with a decrease of 3.7 percent, and the Denver area index’s fall of 0.2 percent is the 17th month in a row in which the growth rate has been negative. In the 20-city index, the year-over-year change has been negative for the most recent 14 months.
The last chart provides a closer look at year-over-year changes in the Denver index. Note the the change has been below zero since June 2010, and likely reflects the end of the homebuyer tax credit’s end which has led to a fall in demand and a decline in the home price index. The upward trend in the index in response to the tax credit is clear during late 2009 and early 2010. Since the end of the credit, however, home prices have consistently drifted downward.

Housing News Digest, January 31
US home prices fell again in November: Case-Shiller
WASHINGTON — Prices for US homes fell again in November, a key index showed Tuesday, failing to respond to record low mortgage loan rates.
Prices fell from October by a seasonally adjusted 0.7 percent, according to the S&P-Case-Shiller; index for 20 top metropolitan areas, after an identical 0.7 percent drop the previous month.
Racial Separation in America's Neighborhoods, 1890-2010
Following every census enumeration since 1890, the Census Bureau has released neighborhood-level data on race. This report presents an analysis of the data from 13 consecutive census administrations on the long-run path of racial segregation across American cities. This report extends our previous work on segregation, by incorporating information from the 2010 census, made available to the public in early 2011 (Cutler, Glaeser, and Vigdor, 1999; and Glaeser and Vigdor, 2003). America’s cities have been shaped over decades, and even the most recent data need historical perspective to be understood (Logan and Stults, 2011). The main findings follow:
Parker: Creating an urban option to mortgages
Phoenix-based Alliance Residential is so bullish on the Denver real estate market that it's investing a bundle of dough in apartment buildings aimed at dwellers who could most likely afford to buy an abode.
"We're targeting aging boomers, young couples, young families and professional individuals — a lot of people who could qualify to buy a home but they don't know if they will be in Colorado for more than three years,"
Small strides expected in commercial real estate market
Expect another year of gradual improvement in the local commercial real estate market in 2012, but outside forces such as Department of Defense cuts could affect some sectors of the market, according to a forecast by Grubb & Ellis/Quantum Commercial Group, a Colorado Springs brokerage.
“You’re not going to see anything skyrocket,” said Dale Stamp, Grubb & Ellis/Quantum Commercial president. “I’m think you’re going to see slow improvements.”
Some see real estate bright spots
EAGLE COUNTY, Colorado — It's easy to see continued grim news in the county's real estate market. And there's plenty to be glum about. But there may be some signs of a slow rebound.
The good news is the number of sales last year. While sales in 2011 are at the same levels as sales in the late 1990s, it's a marked improvement from 2009, when sales dropped more than 40 percent from the previous year.
Friday, January 27, 2012
Housing News Digest, January 27
Colorado contractors hopeful about 2012 construction
Colorado’s construction industry is looking at a brighter future in 2012 compared to the last few years, with hiring starting to pick up, according to survey results issued Monday by the Associated General Contractors of America .
The national association, which represents construction companies that work on roads and highways, got responses from 1,309 companies across the country, including 28 in Colorado.
Statewide mortgage payoffs lowest since 2000
Public trustees in Colorado released a total of 235,749 deed in 2011, down from 251,861 in 2010.
“The surprise really is that in spite of three years of declining interest rates, there hasn’t been activity,” McMaken said.
He said one explanation could be that most of the people who are eligible and qualified for refinancing probably did it in 2009 when rates first dropped. Of course, many people would not be qualified for refinancing today because real estate values have declined and they don’t have enough equity in their homes to get loans on the amount they owe.
Colorado new-home permits increase in 2011
Colorado home builders, for the second year in a row, pulled more permits than they did the year before.
Through November 2011, the state recorded 12,758 single-family and multifamily building permits, according to the U.S. Census Bureau. That's a 10 percent increase from the 11,591 permits pulled in all of 2010.
New-home sales fall in December, capping dismal year
WASHINGTON • Fewer people bought new homes in December. The decline made 2011 the worst year for new-homes sales on records dating back nearly half a century.
The Commerce Department said Thursday new-home sales fell 2.2 percent last month to a seasonally adjusted annual pace of 307,000. The pace is less than half the 700,000 that economists say must be sold in a healthy economy
Luxury Home Prices Jump in Denver Metro Area, Coldwell Banker Residential Brokerage Reports
Denver, CO, January 27, 2012 --(PR.com)-- Luxury home prices in the Denver Metro Area jumped 8 percent in December as the region’s high-end market remained strong at year-end, according to Coldwell Banker Residential Brokerage, Colorado’s leading provider of luxury real estate services.
The median sale price for a million-dollar-plus home reached $1.35 million last month, up 8 percent from a year ago when it stood at $1.25 million and 8.4 percent higher than November of 2011 when it was $1,245,000.
Thursday, January 26, 2012
Bankruptcy filings fall 7.7 percent in 2011
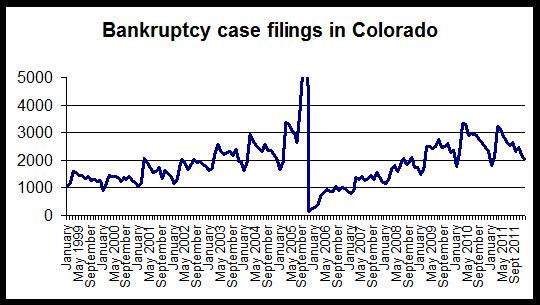
Bankruptcy filings in Colorado fell 7.7 percent in Colorado, falling from 32,509 during 2010 to 29,994 filings during 2011. According to new bankruptcy filing data, released yesterday by the U.S. District Court, from 2009 to 2010, filings increased 16 percent. 2011's bankruptcy total is the lowest annual total recorded since 2009 when filings totaled 27,997. 2011 also showed the largest annual drop since 2006.
In Colorado during December, total bankruptcy cases filed fell 11.9 percent, year over year, to 2,033 filings. During December 2010, 2,308 cases were filed. December 2011 was the eleventh month in a row in which bankruptcies declined year over year.
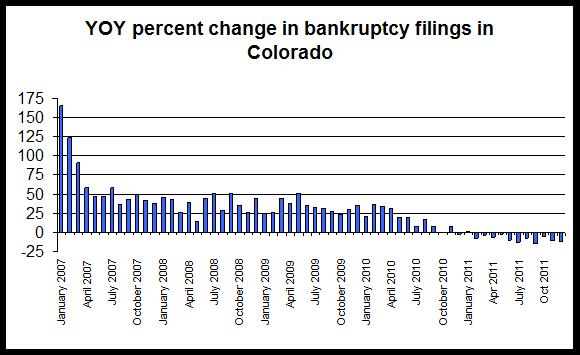
The first graph shows the year-over-year changes in bankruptcy case filings since January 2007:
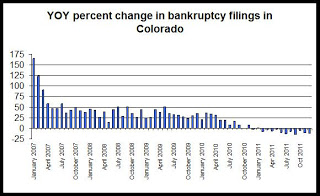
The appearance of sustained declines in the year-over-year comparisons reinforces the likelihood that consumers are beginning to get a handle on debts now that almost four years have passed since the beginning of the national 2007-2009 recession.
In general, however, bankruptcy filings have grown since 2006 following the implementation of the 2005 Bankruptcy Act (discussed here). Bankruptcy filings totaled more than 43,000 during 2005.
The large spike in 2005 preceded the implementation of the new bankruptcy rules. Filings totals have now returned to the levels experienced just prior to the final run-up in cases in 2005, but are down from 2010, when bankruptcy cases appear to have reached a post-2006 peak.
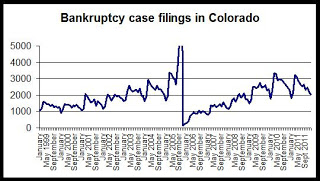
Recent monthly bankruptcy totals are now on a level similar to what was experienced during much of 2003, during a non-recessionary period. Bankruptcies decreased from November to December, falling 7.4 percent. This drop appears to be due to seasonal factors.
Note: April tends to be a peak month for bankruptcy filings as people use their tax refunds to pay for bankruptcy attorneys and filing costs.
In Colorado during December, total bankruptcy cases filed fell 11.9 percent, year over year, to 2,033 filings. During December 2010, 2,308 cases were filed. December 2011 was the eleventh month in a row in which bankruptcies declined year over year.
The first graph shows the year-over-year changes in bankruptcy case filings since January 2007:
The appearance of sustained declines in the year-over-year comparisons reinforces the likelihood that consumers are beginning to get a handle on debts now that almost four years have passed since the beginning of the national 2007-2009 recession.
In general, however, bankruptcy filings have grown since 2006 following the implementation of the 2005 Bankruptcy Act (discussed here). Bankruptcy filings totaled more than 43,000 during 2005.
The large spike in 2005 preceded the implementation of the new bankruptcy rules. Filings totals have now returned to the levels experienced just prior to the final run-up in cases in 2005, but are down from 2010, when bankruptcy cases appear to have reached a post-2006 peak.
Recent monthly bankruptcy totals are now on a level similar to what was experienced during much of 2003, during a non-recessionary period. Bankruptcies decreased from November to December, falling 7.4 percent. This drop appears to be due to seasonal factors.
Note: April tends to be a peak month for bankruptcy filings as people use their tax refunds to pay for bankruptcy attorneys and filing costs.
New home sales hit ten-year low for December 2011
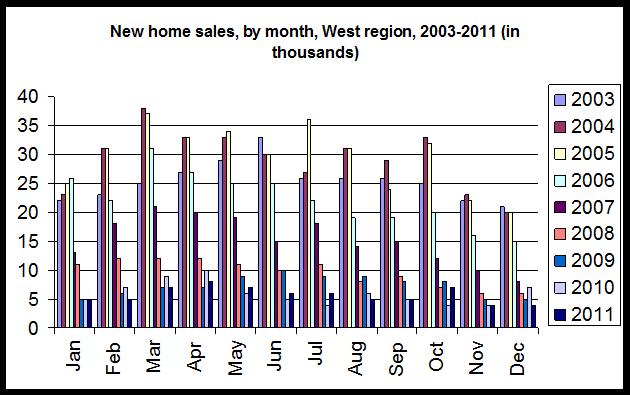
In December of this year, new single-family home sales fell in the US, and were down in the West region, which includes Colorado. According to new data released by the Census Bureau today, new home sales in December fell to the lowest December total recorded in at least ten years.
The report, which monitors sales activity for newly constructed houses, reported that in the West, new home sales were down 42 percent year over year, with 4,000 sales in December 2011, which was the lowest December total recorded in more than ten years. There were 7,000 sales during December 2010. Nationwide, sales fell 8.6 percent, falling from 23,000 to 21,000 during the same period.
In the West, no month has shown fewer than 4,000 new home sales for the region for any month during the past decade.
For the West region:
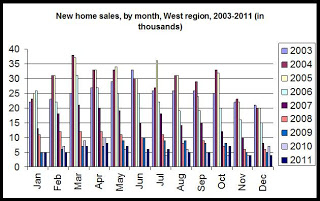
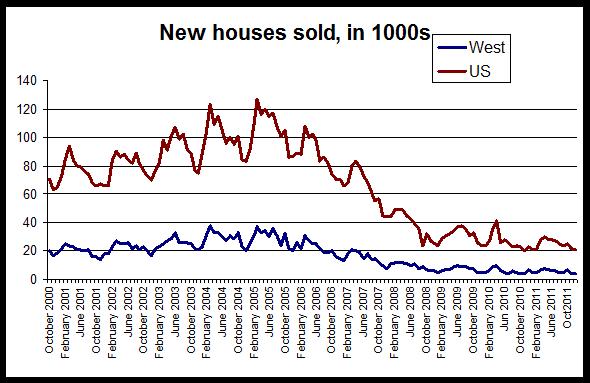
The second graph shows that new home sales continue to fall and have generally followed a downward trend since the middle of the decade.
New home sales peaked during the spring and summer of 2005 and have trended downward since. The number of new houses sold in the United States is down 89 percent since the peak of March 2005, and new home sales in the West have fallen 83 percent since sales peaked in the region during March 2004.

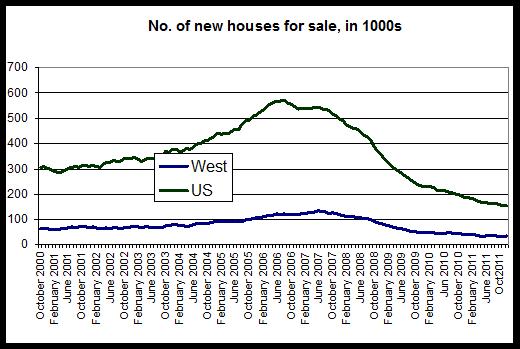
The third graph shows the declines in both US and regional totals in new homes for sale.
The number of new homes for sale has also fallen off considerably. The number of new houses for sale in the West has fallen 74 percent since the total peaked during June 2007, and the same total has fallen 72 percent in the US since the number of new homes for sale peaked in the US during August 2006.
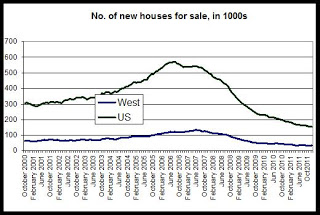
At 34,000, the number of new single-family homes for sale in the West is near the lowest level it's been in more than ten years. No month has shown fewer than 33,000 new homes for sale during the past decade. This reflects very low demand in the face of an ongoing and large number of new foreclosures and low-priced properties in many areas of the West, including Colorado. Although foreclosures have fallen in Colorado in recent years, foreclosure rates remain near historic highs. The national total of new homes for sale during December set a new ten-year low of 156,000.
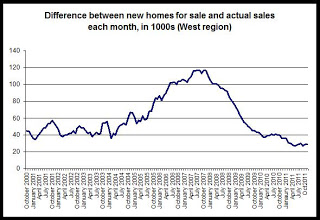
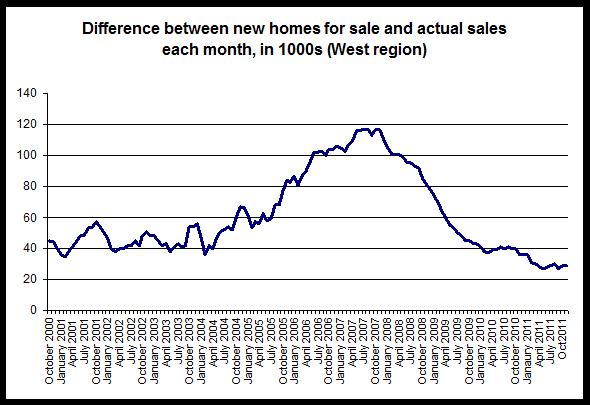
As a final note, we can also look to the new home inventory. In this case, we calculate inventory by subtracting the number of new home sales in a given month from the number of new homes for sale at the end of the previous month. In the final graph, we see that the inventory has essentially been flat since March 2011, hovering near 30,000 homes. There was an inventory of 29,000 homes during December 2011. This is good news for owners of existing homes seeking to sell homes since it suggests that fewer new homes are sitting and waiting to be sold, thus diminishing some of the inventory-driven downward pressure on prices.
The report, which monitors sales activity for newly constructed houses, reported that in the West, new home sales were down 42 percent year over year, with 4,000 sales in December 2011, which was the lowest December total recorded in more than ten years. There were 7,000 sales during December 2010. Nationwide, sales fell 8.6 percent, falling from 23,000 to 21,000 during the same period.
In the West, no month has shown fewer than 4,000 new home sales for the region for any month during the past decade.
For the West region:
The second graph shows that new home sales continue to fall and have generally followed a downward trend since the middle of the decade.
New home sales peaked during the spring and summer of 2005 and have trended downward since. The number of new houses sold in the United States is down 89 percent since the peak of March 2005, and new home sales in the West have fallen 83 percent since sales peaked in the region during March 2004.
The third graph shows the declines in both US and regional totals in new homes for sale.
The number of new homes for sale has also fallen off considerably. The number of new houses for sale in the West has fallen 74 percent since the total peaked during June 2007, and the same total has fallen 72 percent in the US since the number of new homes for sale peaked in the US during August 2006.
At 34,000, the number of new single-family homes for sale in the West is near the lowest level it's been in more than ten years. No month has shown fewer than 33,000 new homes for sale during the past decade. This reflects very low demand in the face of an ongoing and large number of new foreclosures and low-priced properties in many areas of the West, including Colorado. Although foreclosures have fallen in Colorado in recent years, foreclosure rates remain near historic highs. The national total of new homes for sale during December set a new ten-year low of 156,000.
As a final note, we can also look to the new home inventory. In this case, we calculate inventory by subtracting the number of new home sales in a given month from the number of new homes for sale at the end of the previous month. In the final graph, we see that the inventory has essentially been flat since March 2011, hovering near 30,000 homes. There was an inventory of 29,000 homes during December 2011. This is good news for owners of existing homes seeking to sell homes since it suggests that fewer new homes are sitting and waiting to be sold, thus diminishing some of the inventory-driven downward pressure on prices.
Housing News Digest, January 26
Mortgage loan payoffs fall in Springs area
Mortgage loan payoffs — technically referred to as a release of a deed of trust — take place after homes are sold, owners refinance or they complete their purchases by making their last mortgage payment. An increase in payoffs indicates an uptick in buying and selling and the ability of homeowners to qualify for a refinancing; a reduction points the opposite way.
In 2011, mortgage loan payoffs totaled 32,040 in the Springs and surrounding El Paso County, according to the Housing Division report released Wednesday. That was a 6.6 percent drop over the previous year and the lowest number since 30,187 in 2000, when the state began tracking releases of deeds.
Foreclosures keep pushing house prices lower
Foreclosure-related properties, which made up roughly one in five home sales in the third quarter of last year, sold for an average 34 percent less than homes that were not “distressed sales,” according to the latest data from RealtyTrac, a housing data research firm.
Foreclosures accounted for a smaller share of total sales as banks already glutted with properties slowed the pace of new seizures until they could unload the houses they already owned. The share of distressed sales also slowed last year following a slowdown in new foreclosures after consumer complaints and lawsuits challenging seizures that resulted from “robo-signing” and other questionable document practices
Manufactured-housing portfolio sells for $330 million
A 16-property, multistate manufactured-housing portfolio with nearly half of its sites in Colorado sold for $330 million, the brokers announced Wed- nesday.
ARA National Manufactured Housing Group said Chicago-based Hometown America sold the portfolio to the American Manufactured Communities REIT.
The Inn Between in Longmont makes a difference for homeless
LONGMONT — Some clients and staff at the Inn Between in Longmont say the nonprofit's 93-year-old main building is haunted by ghosts, but executive director Donna Lovatohttp://www.blogger.com/img/blank.gif says it's angels at work and play.
U.S. December New Housing Sales Report
Sales of new single-family houses in December 2011 were at a seasonally adjusted annual rate of 307,000, according to estimates released jointly today by the U.S. Census Bureau and the Department of Housing and Urban Development. This is 2.2 percent (+/-13.2%)* below the revised November rate of 314,000 and is 7.3 percent (+/- 16.6%)* below the December 2010 estimate of 331,000.
Madigan Sues S&P; For Role In Housing Market Meltdown
CHICAGO (STMW) - Illinois Attorney General Lisa Madigan has filed a lawsuit against Standard & Poor’s claiming the credit ratings agency fraudulently gave high ratings to risky mortgage-backed investments in the years prior to the 2008 housing market crash.
The suit, filed Wednesday in Cook County Circuit Court, alleged that S&P; compromised its independence by giving its highest ratings to unworthy, risky investments as a corporate strategy to increase revenue and market share, a release from the AG’s office said.
Wednesday, January 25, 2012
Employment growth during December 2011 hits 5-year high
Colorado gained 80,107 jobs in December 2011 compared to December of 2010, and the non-seasonally-adjusted unemployment rate fell year-over-year from 8.7 percent to 7.9 percent. According to the most recent employment data, collected through the Household Survey and released today by the Colorado Department of Labor and Employment, total employment in December, not seasonally adjusted, rose to 2.504 million jobs. There were also 63,000 more people in the work force during December, compared to December 2010.
The unemployment rate remained largely flat from November to December in spite of job gains due to a relatively large number of workers joining the labor force.
From December 2010 to December 2011, total employment rose 3.3 percent, while the labor force rose 2.3 percent. The total labor force in December included 2.72 million workers.
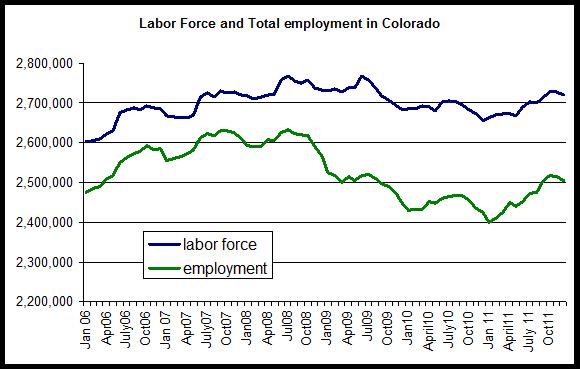
As can be seen in the second graph, total employment and total workforce size have decreased slightly, month-over-month, and have fallen for the past two months. Year over year, both total employment and the labor force rose together. However, both remain well below the July 2008 peak.
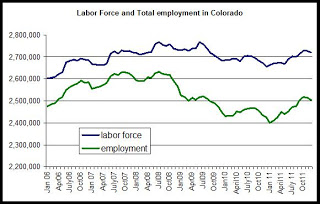
The employment total is now 128,000 jobs below the peak levels experienced during July 2008 when there were 2.63 million employed workers. Compared to the labor force peak in July 2008, the labor force is now down by more than 48,000 workers.
In the third graph is shown the year-over-year comparisons, by percent, for total employment. December 2011 was the sixth month in a row showing a positive year-over-year change in total employment. This followed 33 months in a row of negative job growth in year-over-year comparisons. At 3.3 percent, the year-over-year percent change in total employment was the largest gain since January 2007 and was at a 5-year high in December 2011. Between August 2008 and July 2011, no month posted a positive change in total employment when compared to the same month a year earlier.
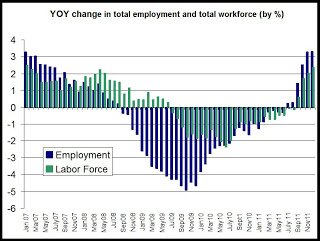
The graph also shows the year-over-change in the labor force. Total labor force size rose from December 2010 to December 2011, and was the fourth time that the labor force has grown, year over year, since June 2009 . The labor force size had shrunk, year over year, for 26 months in a row from July 2009 to August 2011.
These numbers come from the Household Survey employment data, so the size of the workforce is dependent on the number of people stating that they are actively looking for work if not employed. Discouraged workers who have stopped looking for work are excluded. On the other hand, the Household Survey picks up on small business and start-up employment that may be missed by the Establishment Survey, the other commonly-used measure of employment.
The unemployment rate remained largely flat from November to December in spite of job gains due to a relatively large number of workers joining the labor force.
From December 2010 to December 2011, total employment rose 3.3 percent, while the labor force rose 2.3 percent. The total labor force in December included 2.72 million workers.
As can be seen in the second graph, total employment and total workforce size have decreased slightly, month-over-month, and have fallen for the past two months. Year over year, both total employment and the labor force rose together. However, both remain well below the July 2008 peak.
The employment total is now 128,000 jobs below the peak levels experienced during July 2008 when there were 2.63 million employed workers. Compared to the labor force peak in July 2008, the labor force is now down by more than 48,000 workers.
In the third graph is shown the year-over-year comparisons, by percent, for total employment. December 2011 was the sixth month in a row showing a positive year-over-year change in total employment. This followed 33 months in a row of negative job growth in year-over-year comparisons. At 3.3 percent, the year-over-year percent change in total employment was the largest gain since January 2007 and was at a 5-year high in December 2011. Between August 2008 and July 2011, no month posted a positive change in total employment when compared to the same month a year earlier.

The graph also shows the year-over-change in the labor force. Total labor force size rose from December 2010 to December 2011, and was the fourth time that the labor force has grown, year over year, since June 2009 . The labor force size had shrunk, year over year, for 26 months in a row from July 2009 to August 2011.
These numbers come from the Household Survey employment data, so the size of the workforce is dependent on the number of people stating that they are actively looking for work if not employed. Discouraged workers who have stopped looking for work are excluded. On the other hand, the Household Survey picks up on small business and start-up employment that may be missed by the Establishment Survey, the other commonly-used measure of employment.
Latest trends in mortgage loan repayments in Colorado
Today, the Division of Housing released its 2011 year-end report on releases of deeds of trust. Since release activity reflects trends in home purchase and refinance activity they can help us identify some trends in demand for home loans.
The report notes that, in general, release activity responds to movements in the mortgage rate in ways very similar to that seen in mortgage refinance activity. For example, in the first chart, we see that there was a surge in release activity in 2003.
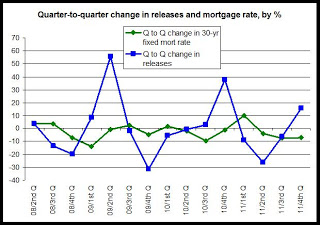
The first graph shows the quarter-to-quarter changes in the 30-yr fixed mortgage rate and in the number of releases. The quarterly data goes back to 2008. Release activity tends to move in the opposite direction of trends in the mortgage rate. In general, the blue line will move above zero following a period in which the green line is below zero. So, after growth in the mortgage rate turned negative during the 4th q of 2008, release activity moved above zero, topping out at a growth rate of more than 50 percent. In other words, a dip in the mortgage rate produced a surge in release activity. A similar phenomenon can then be seen again following the third quarter of 2010, and then again following the third quarter of 2011. Note, however, that the increase in release activity gets smaller after each period of declining mortgage rates. The effect of pushing down the mortgage rate appears to be diminishing when it comes to release activity.
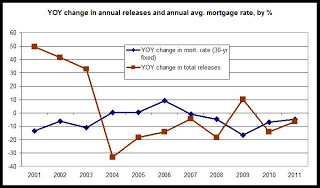
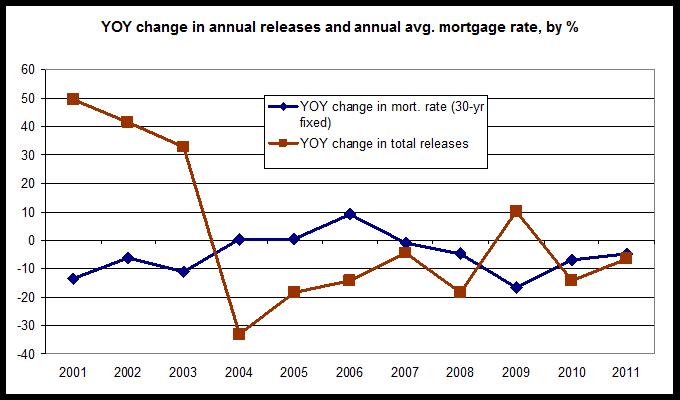
The second graph shows the same measure, except on a year-to-year basis. Given the longer time period, in the annual data, there is not the lag we see in the quarterly data. A year that shows falling mortgage rates shows a rise in release activity, in most cases.
Note that 2001, 2002, and 2003 all showed drops in the mortgage rate, which was mirrored by significant increases in release activity. Mortgage rate growth then turned positive and release activity dropped. We then see mortgage rate growth turn negative again in 2008 and 2009 as the financial crisis became a factor. This produced a bump in release activity during 2009.
Note, however that in 2010 and 2011, the mortgage rate moved downward, but so did release activity, which is contrary to the usual trend, and suggests that further declines in the mortgage rate are not producing the usual surges in release activity.
See the full report here.
The report notes that, in general, release activity responds to movements in the mortgage rate in ways very similar to that seen in mortgage refinance activity. For example, in the first chart, we see that there was a surge in release activity in 2003.
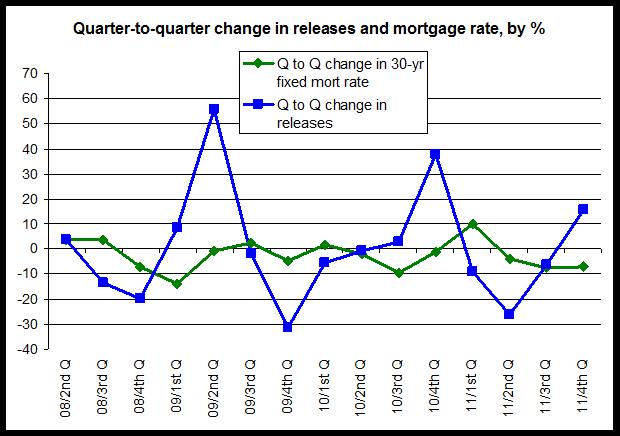
The first graph shows the quarter-to-quarter changes in the 30-yr fixed mortgage rate and in the number of releases. The quarterly data goes back to 2008. Release activity tends to move in the opposite direction of trends in the mortgage rate. In general, the blue line will move above zero following a period in which the green line is below zero. So, after growth in the mortgage rate turned negative during the 4th q of 2008, release activity moved above zero, topping out at a growth rate of more than 50 percent. In other words, a dip in the mortgage rate produced a surge in release activity. A similar phenomenon can then be seen again following the third quarter of 2010, and then again following the third quarter of 2011. Note, however, that the increase in release activity gets smaller after each period of declining mortgage rates. The effect of pushing down the mortgage rate appears to be diminishing when it comes to release activity.
The second graph shows the same measure, except on a year-to-year basis. Given the longer time period, in the annual data, there is not the lag we see in the quarterly data. A year that shows falling mortgage rates shows a rise in release activity, in most cases.
Note that 2001, 2002, and 2003 all showed drops in the mortgage rate, which was mirrored by significant increases in release activity. Mortgage rate growth then turned positive and release activity dropped. We then see mortgage rate growth turn negative again in 2008 and 2009 as the financial crisis became a factor. This produced a bump in release activity during 2009.
Note, however that in 2010 and 2011, the mortgage rate moved downward, but so did release activity, which is contrary to the usual trend, and suggests that further declines in the mortgage rate are not producing the usual surges in release activity.
See the full report here.
Economic Update: National Assoc. of Residential Property Managers
For those at the NARPM meeting who wanted larger graphs, here are the slides for the economic update I presented to the Denver Chapter of the National Association of Residential Property Managers.
Mortgage loan payoffs fall in 2011, hit ten-year low
The number of mortgage loans paid off in Colorado was down 6.4 percent during 2011 compared to 2010, although loan payoffs rose from the third quarter to the fourth quarter of 2011. According to a new report released today by the Colorado Division of Housing, public trustees in Colorado released a total of 235,749 deeds of trust during 2011, falling from 2010’s total of 251,861. Typically, a release of a deed of trust occurs when a real estate loan is paid off whether through refinance, sale of property or because the owner has made the final payment on the loan. Release activity declines as refinance and home-sale activity falls.
For the fourth quarter alone, the number of deeds of trust released this year fell 27.3 percent. Releases fell from 80,265 during 2010’s fourth quarter to 58,340 during the same period this year. On the other hand, releases rose from the third quarter of 2011 to the fourth quarter, rising 15.5 percent from the third quarter’s total of 50,506.
“Real estate activity perked up a bit during the fourth quarter, which would reflect some very recent growth in employment and some mild increases in home prices.” said Ryan McMaken, spokesman for the Colorado Division of Housing. “But overall, the fourth quarter’s activity wasn’t enough to keep 2011 from being another flat year,”
According to the report, the number of deeds of trust released during 2011 was the smallest annual release total reported since the state began keeping release records in 2000. Release activity peaked during 2003 when there were 733,373 releases reported in the counties surveyed. The unusually large number of loan payoffs from 2002 through 2005 reflects a period of declining mortgage rates and increasing new home construction that led to a swift rise in home purchase activity and refinancing. From 2003 to 2011, however, loan payoffs fell 67 percent.
In spite of falling mortgage rates since 2008, loan payoff activity has fallen.
“Ten years ago, even a small decline in the mortgage rate would have produced quite a bit of new refinance and sales activity,” McMaken said. “But since 2008, tighter lending standards and a drop in the number of eligible buyers has prevented a sizable surge in new activity in spite of record-low rates.”
Trends in release activity varied by county. From 2010 to 2011, release totals fell in all counties surveyed except Douglas, Jefferson, Morgan, Park, Summit and Teller counties. All counties surveyed reported increases in activity from the third quarter to the fourth quarter of 2011. In general, the counties with higher real estate prices tended to report either increases in release activity, or smaller rates of decline. For example, from 2010 to 2011, some of the largest declines in release activity were found in Mesa, Pueblo, and Weld counties, which tend to have lower real estate prices than counties that reported increases such as Summit, Teller and Douglas Counties.
Totals for releases of deeds of trust are collected quarterly by the Colorado Division of Housing. This report tracks releases of deeds of trust as reported by public trustees in Colorado. The report includes twenty-one counties which are chosen based on population size and to ensure that as many regions of the state as possible are represented. More than 90 percent of all occupied households in Colorado are within the twenty-one counties chosen.
A deed of trust is similar to a mortgage and is a lien on real property to secure payment of an indebtedness. The deed of trust contains a grant of the property to the public trustee for the benefit of the holder. The deed of trust is released when the debt is paid in full.
Housing News Digest, January 25
Mortgage loan payoffs hit 10-year low
The number of mortgage loans paid off in Colorado was down 6.4 percent in 2011 compared with 2010, according to a new report from the Colorado Division of Housing.
A total of 235,749 deeds of trust were released in 2011, falling from 2010's total of 251,861, the report states.
Typically, a release of a deed of trust occurs when a real estate loan is paid off, which can include a refinancing, a sale of the property or because the owner has made the final payment on the loan. Release activity declines as refinance and home-sale activity falls.
Read more: Mortgage loan payoffs hit 10-year low - The Denver Post http://www.denverpost.com/breakingnews/ci_19817386#ixzz1kU5AYnZX
Read The Denver Post's Terms of Use of its content: http://www.denverpost.com/termsofuse
Survey Aims At Solving Homelessness
COLORADO SPRINGS, Colo. -- More than 70 volunteers, including 12 Fort Carson troops, gathered in Colorado Springs to conduct a survey of the homeless population in town. The survey was aimed at gathering a headcount of the homeless individuals as well as recording demographic information from that population.
The survey is conducted in compliance with requirements set forth by the U.S. Department of Housing and Urban Development.
Crowne Plaza hotel focus of court battle
One of the oldest and largest hotels in the Colorado Springs area, the Crowne Plaza, could end up in new management hands as the result of financial and legal battles.
The hotel’s owners, Stamford Real Estate (Colorado Springs) LLC and Harrell Colorado Operating Co. LLC, defaulted in July after failing to repay a $30.8 million loan used to buy and remodel the property. The 500-room hotel at 2886 S. Circle Drive remains open. But the default prompted Wells Fargo Bank to ask 4th Judicial District Judge Gregory Werner on Jan. 11 to name a Florida hotel executive as receiver for the property. Wells Fargo is trustee for a Boston-based trust that owns the loan.
Anxiety Mounts Over Maturing Real Estate Loans
Borrowers and lenders are starting to grapple with the billions of dollars in commercial real estate loans made during the boom year of 2007 that are coming due this year, in a greatly contracted economy.
Experts have warned of a rash of recapitalizations, refinancings and building sales. In New York City alone, nearly $70 billion worth of commercial mortgages that were bundled together and issued as collateral for bonds are maturing this year. Of those, $26 billion, or 37.4 percent, are five-year loans that were originated during the height of the real estate bubble, when underwriting standards were loosest, according to data from the research firm Trepp LLC.
Obama Answers Bernanke Plea With Refinancing Plan: Mortgages
President Barack Obama answered Ben S. Bernanke's appeal for more action to fix the U.S. housing market that's restraining the economic recovery by proposing a plan to help borrowers reduce their monthly mortgage payments.
Obama is sending Congress legislation that would allow homeowners to tap record-low borrowing costs, potentially boosting housing as he seeks re-election this year. The proposal could save participants about $3,000 a year, Obama said in his State of the Union speech to Congress.
Friday, January 20, 2012
NAR: Median home price in U.S. West declines, existing home sales fall
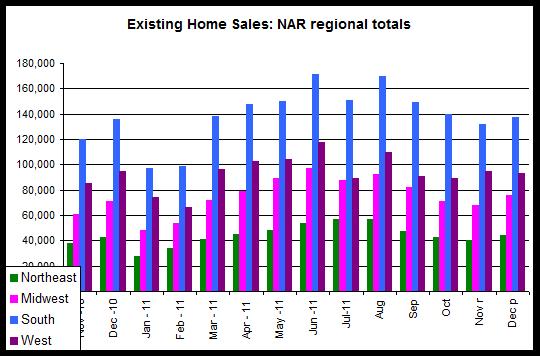
The median home price in the West region of the U.S., which includes Colorado, rose 0.3 percent from December 2010 to December 2011. According to new existing home sales data, released today by the National Association of Realtors, the median home price rose only in the West region and fell in all other regions. The median price fell the most in the Midwest where it declined 7.9 percent from December 2010 to December 2011.
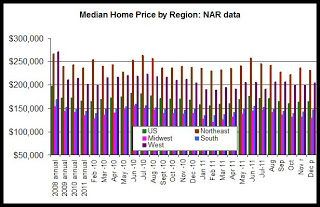
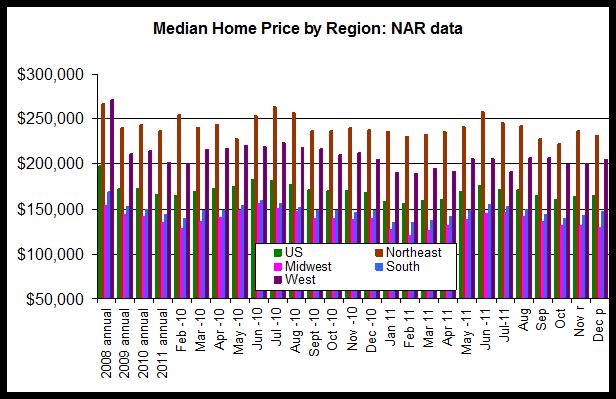
The first graph shows median home prices for all regions plus the U.S. The median home price in the West during the past six months has ranged from $191,000 to $208,000. The median price was $205,200 during December 2011, and during December of 2010, the median price for the region was $204,500.
Nationally, home prices fell 2.5 percent, year over year.
Note: The median home price numbers were not affected by the major revision in home sales data. As explained here, home sales numbers were recently revised downward by 14 percent by the National Association of Realtors. Past estimates of home sales had proven to overstate home sales in recent years. The revision attempts to re-benchmark the data to make it more accurate.
According to the revised data, home sales transactions (closings) fell 2.1 percent in the West region, while nationally, sales rose 1.4 percent during the same period. The West reported the only drop in home sales among all regions, falling from 95,000 during December 2010 to 93,000 during December 2011 (not seasonally adjusted). In the Midwest region, where sales rose the most, the year-over-year increase was 7.0 percent.
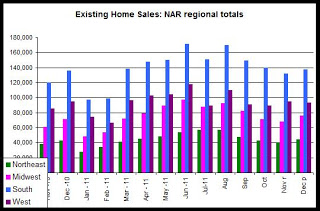
The second graph shows closings by region. All regions except the West showed a month-over-month increase from November to December. Sales fell 2.1 percent from November to December, while sales in the Midwest rose 11.8 percent.
Overall, December's sales activity was higher than was the case during December of last year, except in the West.
In the West, the recent price declines, broadly speaking, are in agreement with other home price indices such as CoreLogic, Case-Shiller, and the FHFA HPI which also show price declines. See here for more. However, these home price indices indicate that home prices are slowly flattening out and may turn slightly positive in coming months.
Conclusions: As can be seen in the first graph, home prices during recent months are down from where they were a year earlier, and the median price in the West is still below the annualized median prices for 2008, 2009 and 2010. However, December's median price in the West was above the 2011 annual median price, which was $201,300.
The first graph shows median home prices for all regions plus the U.S. The median home price in the West during the past six months has ranged from $191,000 to $208,000. The median price was $205,200 during December 2011, and during December of 2010, the median price for the region was $204,500.
Nationally, home prices fell 2.5 percent, year over year.
Note: The median home price numbers were not affected by the major revision in home sales data. As explained here, home sales numbers were recently revised downward by 14 percent by the National Association of Realtors. Past estimates of home sales had proven to overstate home sales in recent years. The revision attempts to re-benchmark the data to make it more accurate.
According to the revised data, home sales transactions (closings) fell 2.1 percent in the West region, while nationally, sales rose 1.4 percent during the same period. The West reported the only drop in home sales among all regions, falling from 95,000 during December 2010 to 93,000 during December 2011 (not seasonally adjusted). In the Midwest region, where sales rose the most, the year-over-year increase was 7.0 percent.
The second graph shows closings by region. All regions except the West showed a month-over-month increase from November to December. Sales fell 2.1 percent from November to December, while sales in the Midwest rose 11.8 percent.
Overall, December's sales activity was higher than was the case during December of last year, except in the West.
In the West, the recent price declines, broadly speaking, are in agreement with other home price indices such as CoreLogic, Case-Shiller, and the FHFA HPI which also show price declines. See here for more. However, these home price indices indicate that home prices are slowly flattening out and may turn slightly positive in coming months.
Conclusions: As can be seen in the first graph, home prices during recent months are down from where they were a year earlier, and the median price in the West is still below the annualized median prices for 2008, 2009 and 2010. However, December's median price in the West was above the 2011 annual median price, which was $201,300.
Housing News Digest, January 20
Housing industry headed north
After five rough years for the construction industry and the housing market, small glimmers of hope arise from the ashes of the Great Recession.
With low interest rates, a housing glut and 448 homes sold last year, Teller County is experiencing the trickle-down effect of the nation’s housing market on the move. “If we continue to sell what we did last year, we’ll knock this housing situation down considerably,” said Carl Andersen, of Andersen Enterprises in Woodland Park. “Those are very encouraging numbers. So I do think Teller County is on the verge of a slow moderate recovery in the housing market.”
Grower Linked To Listeria Fined On Migrant Housing
The federal agency said Eric Jensen, owner of Jensen Farms, of Holly, rented migrant workers unsanitary, overcrowded rooms at a motel he owns. Inspectors said many rooms lacked beds, laundry facilities and smoke detectors. Jensen faces $4,250 in civil penalties.
The fine was not linked to the outbreak.
Housing authority will get $13K from town for project
The Windsor Housing Authority will receive $13,000 from the Town of Windsor with the possibility of more fee waivers to come.
During last Monday night's town board work session, board members said they'd like to see a resolution at the next regular meeting approving the WHA's request for $13,000 from the town to create organizational policies to enhance management operations and efficiencies.
Tough economy doesn’t stop Porter Homes
Circumstances, hard work and perhaps a bit of divine providence have led Nate Porter with Porter Homes down an interesting career path.
He came to Grand Junction as a baseball player for Mesa State College, as Colorado Mesa University was known in 1999. By the time he graduated in 2002, he was ready to take a break from education and told an acquaintance he wanted to build custom log homes.
Colorado Real Estate Commission pulls property manager’s license
The Colorado Real Estate Commission yanked the real estate license of a Fort Collins property manager after an investigation found the manager allegedly mishandled rent money owed to property owners, the Colorado Division of Real Estate said Thursday.
The commission voted unanimously to suspend the real estate license of Sherry Jefcoat, also known as Sherry Eichman. She runs Legend Real Estate Services LLC of Fort Collins.
Thursday, January 19, 2012
Corelogic: Colorado home prices flat, Denver metro rises
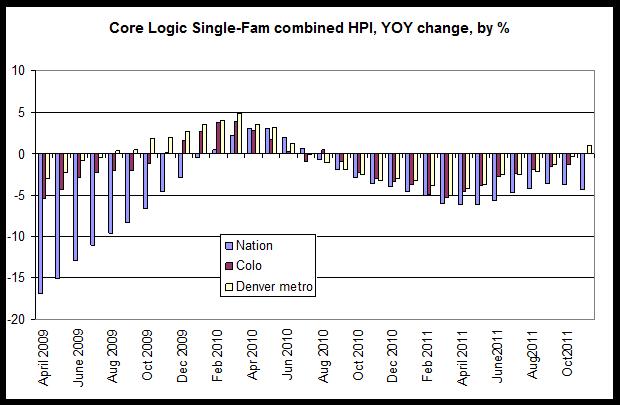
Home prices in Colorado fell 0.05 percent from November 2010 to November 2011, continuing a downward trend in home prices in Colorado and nationwide. Nevertheless, the degree to which home prices have declined has lessened each month for the past nine months. According to the November Home Price Index (HPI), released last week by CoreLogic, the year-over-year decline for Colorado was the smallest decline in 15 months, while the Denver metro area reported the first year-over-year increase in 18 months.
Nationally, the index fell 4.32 percent, and it rose 01.01 percent in the Denver-Aurora-Broomfield metro area during the same period.
The first graph shows the year-over-year changes for the past 32 months in the US, Colorado and the Denver metro area. Over the past two years, the general trend in all three areas has been shaped by the home buyer tax credit, which was introduced in 2008 and expired in April 2010. Clearly, home prices climbed throughout the duration of the tax credit period, but declined after the credit's expiration.
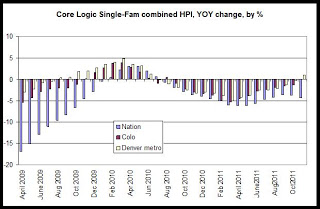
During most months in the past two years, the Colorado and metro Denver HPI have performed better (from a property owner's perspective) than the national HPI. The national HPI has declined more than the local HPIs in each month since September 2010.
This data for November suggests that, although the year-over-year declines have lessened in magnitude, home prices have not yet turned around in Colorado as of November 2011. Metro Denver, on the other hand, has now shown a year-over-year increase. The Core-logic HPI for metro Denver is the first home price index among the major national indices that has shown a year over year increase for the region during the past 12 to 15 months. Local Realtor data, as well as the Case-Shiller data, all show that in year-over-year comparisons, home prices continue to fall when compared to the same month in the prior year. However, the Corelogic year-over-year changes are now close enough to zero to suggest that home prices are no longer declining, but are essentially flat in many markets.
New pending home sales data from NAR suggests some new strength in home sales transactions at the regional level in some areas, but in Colorado statewide, home sales activity through November remains about equal with 2009.
See the home price data archive for more.
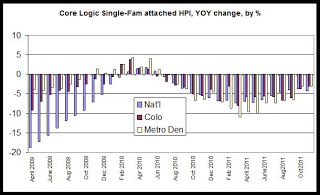
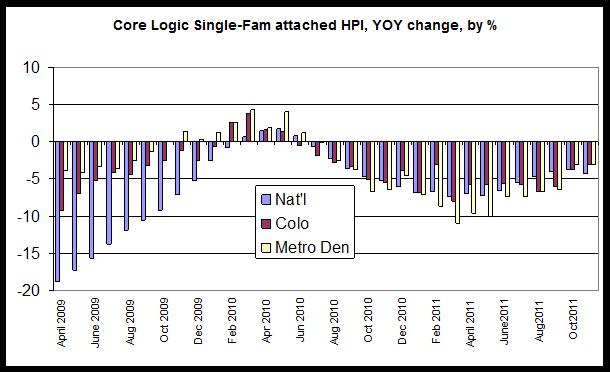
Corelogic also provides one of the few publicly-available indices that looks at home prices in attached homes such as condos and townhomes. Among attached homes, home prices have fallen significantly more than is the case for all single-family properties. Although the combined single-family Colorado index fell by 0.05 percent, year-over-year for November, the same index for attached housing fell by 3.08 percent. In the metro Denver area, the index for attached homes fell 3.12 percent. As with the single-family combined index, the national rate of decline for attached homes - 4.32 percent - was larger than the Colorado and Denver metro rates.
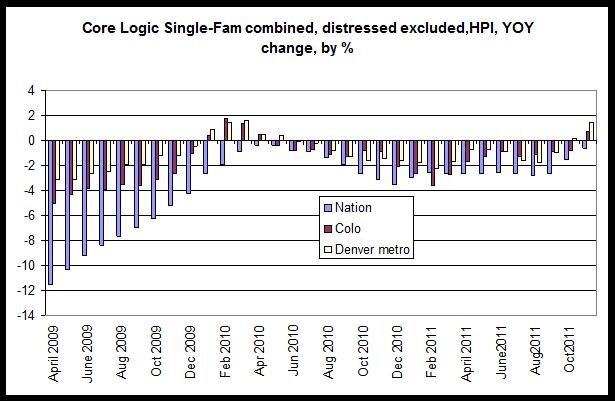
And finally, Corelogic provides a look at home prices with distressed properties excluded.
With distressed properties excluded, home prices actually increased from November 2010 to November 2011, with the Colorado index rising 0.75 percent year over year. During the same period, the national index fell 0.6 percent and the metro Denver index rose 1.5 percent.
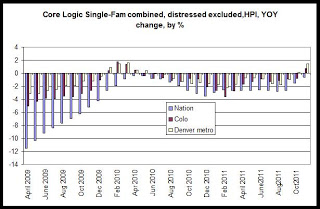
The CoreLogic HPI is a three-month weighted average of September, October and November (with November weighted the most) and is not seasonally adjusted.
Nationally, the index fell 4.32 percent, and it rose 01.01 percent in the Denver-Aurora-Broomfield metro area during the same period.
The first graph shows the year-over-year changes for the past 32 months in the US, Colorado and the Denver metro area. Over the past two years, the general trend in all three areas has been shaped by the home buyer tax credit, which was introduced in 2008 and expired in April 2010. Clearly, home prices climbed throughout the duration of the tax credit period, but declined after the credit's expiration.
During most months in the past two years, the Colorado and metro Denver HPI have performed better (from a property owner's perspective) than the national HPI. The national HPI has declined more than the local HPIs in each month since September 2010.
This data for November suggests that, although the year-over-year declines have lessened in magnitude, home prices have not yet turned around in Colorado as of November 2011. Metro Denver, on the other hand, has now shown a year-over-year increase. The Core-logic HPI for metro Denver is the first home price index among the major national indices that has shown a year over year increase for the region during the past 12 to 15 months. Local Realtor data, as well as the Case-Shiller data, all show that in year-over-year comparisons, home prices continue to fall when compared to the same month in the prior year. However, the Corelogic year-over-year changes are now close enough to zero to suggest that home prices are no longer declining, but are essentially flat in many markets.
New pending home sales data from NAR suggests some new strength in home sales transactions at the regional level in some areas, but in Colorado statewide, home sales activity through November remains about equal with 2009.
See the home price data archive for more.
Corelogic also provides one of the few publicly-available indices that looks at home prices in attached homes such as condos and townhomes. Among attached homes, home prices have fallen significantly more than is the case for all single-family properties. Although the combined single-family Colorado index fell by 0.05 percent, year-over-year for November, the same index for attached housing fell by 3.08 percent. In the metro Denver area, the index for attached homes fell 3.12 percent. As with the single-family combined index, the national rate of decline for attached homes - 4.32 percent - was larger than the Colorado and Denver metro rates.
And finally, Corelogic provides a look at home prices with distressed properties excluded.
With distressed properties excluded, home prices actually increased from November 2010 to November 2011, with the Colorado index rising 0.75 percent year over year. During the same period, the national index fell 0.6 percent and the metro Denver index rose 1.5 percent.
The CoreLogic HPI is a three-month weighted average of September, October and November (with November weighted the most) and is not seasonally adjusted.
Remodeling activity in U.S. West outpaces other regions in November
Residential remodeling activity increased 33.4 percent in the Western U.S. from November 2010 to November 2011. According to the November 2011 Residential Buildfax Remodeling Index, released this week by BUILDERadius, The Western U.S. showed the largest rate of increase, by far, in its index for November 2011, outpacing all other regions and the U.S. as a whole.
According to Buildfax's November 2011 release:
In November, all regions except the northeast posted year-over-year gains. The West was up 43.7 points (43%) year-over-year while the Midwest was up 14 points (13%) year-over-year. The South was up 8.9 points (10.6%) year-over-year, and the Northeast was down 5.3 points (6.8%) year-over-year.
In the graph, we see that the year-over-year percent change in the western region has outpaced all other regions and the U.S. as a whole for the past six months. Growth rates have been solid in recent months. November 2011's year-over-year change was considerably larger than November 2010's year over year increase.
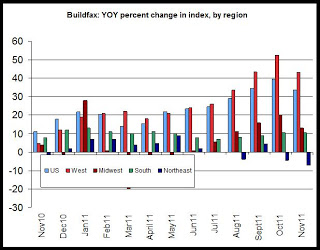
Overall, the report suggests substantial increases in the amount of residential remodeling activity in the economy. Often, remodeling activity reflects an availability of household capital for some construction and home-improvement activities while there may be an absence of the large amounts of household capital necessary for relocation and new home purchases. The solid increases in recent months suggest an increasing willingness on the part of homeowners to spend on remodeling. Home sales data, meanwhile, suggests that fewer buyers mare making the decision to actually purchase a new home.
The Buildfax press release states that the rise in remodeling activity in most of the nation reflects a national trend in which homeowners have been spending on remodeling as an alternative to home home purchases in a market in which it is difficult to sell one's home.
As we've seen in recent data for new home sales and housing starts, new home construction remains at historic lows. Many homeowners turn to remodeling projects, as is reflected in recent Buildfax reports.
The exception is the Northeast region, which has shown only slight growth and some declines in recent months.
As a supplement, I've included the second graph which shows the year-over-year change in the numeric value of the index by region.
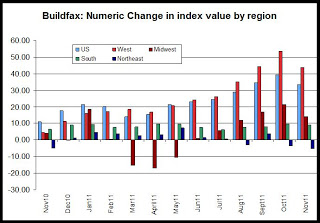
About the BuildFax Remodeling Index
The BuildFax Remodeling Index is based on construction permits filed with local building departments across the country. The index tracks the number of properties permitted. The national and regional indexes all have an initial value of 100 set in April of 2004, are based on a three-month moving average, and are not seasonally adjusted.
According to Buildfax's November 2011 release:
In November, all regions except the northeast posted year-over-year gains. The West was up 43.7 points (43%) year-over-year while the Midwest was up 14 points (13%) year-over-year. The South was up 8.9 points (10.6%) year-over-year, and the Northeast was down 5.3 points (6.8%) year-over-year.
In the graph, we see that the year-over-year percent change in the western region has outpaced all other regions and the U.S. as a whole for the past six months. Growth rates have been solid in recent months. November 2011's year-over-year change was considerably larger than November 2010's year over year increase.
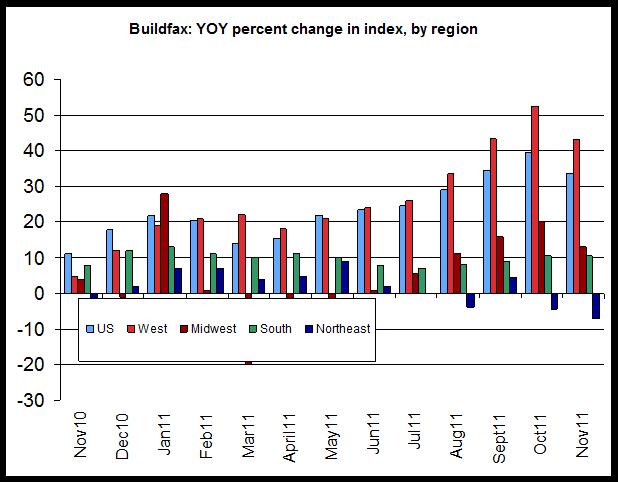
Overall, the report suggests substantial increases in the amount of residential remodeling activity in the economy. Often, remodeling activity reflects an availability of household capital for some construction and home-improvement activities while there may be an absence of the large amounts of household capital necessary for relocation and new home purchases. The solid increases in recent months suggest an increasing willingness on the part of homeowners to spend on remodeling. Home sales data, meanwhile, suggests that fewer buyers mare making the decision to actually purchase a new home.
The Buildfax press release states that the rise in remodeling activity in most of the nation reflects a national trend in which homeowners have been spending on remodeling as an alternative to home home purchases in a market in which it is difficult to sell one's home.
As we've seen in recent data for new home sales and housing starts, new home construction remains at historic lows. Many homeowners turn to remodeling projects, as is reflected in recent Buildfax reports.
The exception is the Northeast region, which has shown only slight growth and some declines in recent months.
As a supplement, I've included the second graph which shows the year-over-year change in the numeric value of the index by region.
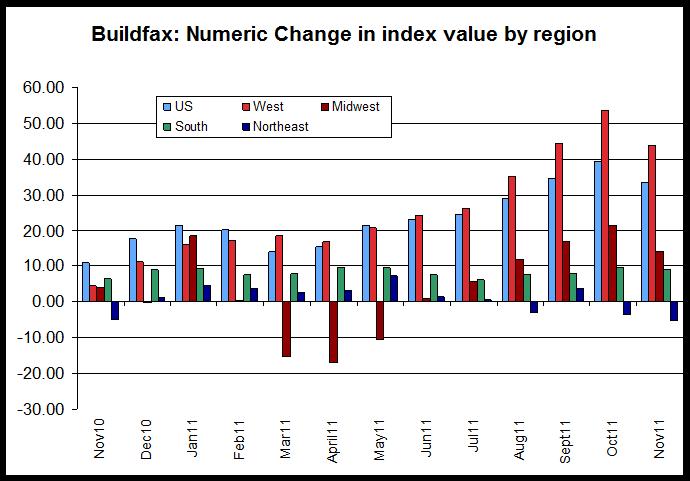
About the BuildFax Remodeling Index
The BuildFax Remodeling Index is based on construction permits filed with local building departments across the country. The index tracks the number of properties permitted. The national and regional indexes all have an initial value of 100 set in April of 2004, are based on a three-month moving average, and are not seasonally adjusted.
Consumer prices in West up in December, topping post-recession December stats
The Bureau of Labor Statistics released today the December CPI for US urban areas and regions. In the West region, from December 2010 to December 2011, the CPI increased 2.7 percent. This is an increase over the year-over-year increases for November during 2008, 2009 or 2010, during which the change in CPI never exceeded 2.1 percent.
In the first graph, we can see that the CPI growth in December 2011 was the largest annual change for December since 2007, prior to the financial crisis of 2008. 2004 through 2007 showed higher annual changes, reflecting much more robust economic growth during that period.
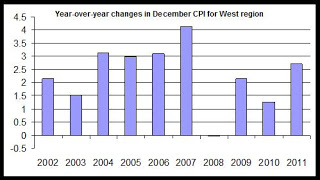
The price increases are being largely driven by transportation costs, such as gasoline. Transportation prices increased by 4.5 percent, year over year. Food costs and apparel also increased significantly, rising 4.1 percent and 3.8 percent, respectively.
Housing prices were restrained at a year-over-year increase of 1.8 percent. Although increases in rent have exceeded 5 percent in many areas of the state, the housing component of CPI also reflects declining home prices, which indirectly mitigate the increases in rent levels within the index.
Recent price increases will impact household calculations and attitudes on spending as many households conclude that discretionary spending will need to be scaled back in the face of increasing food and transportation costs.
This in turn will have effects on home purchase activity as well. Note: In addition to the issue of disposable income is the issue of interest rates. Should the Federal Reserve conclude that inflation does need to be addressed, the resulting increase in interest rates would also push down home purchase activity. (Recent declines in the mortgage rate have not spurred large amounts or refinance or purchase activity, as noted in the Division of Housing's analysis of releases of deeds of trust.
Last Friday, CNBC reported that the Fed's FOMC is seriously considering more quantitative easing which could spur additional inflation.
The second graph shows year-over-year changes in CPI for all months since 2002. If current trends continue, CPI growth has generally stalled around 3 percent since March 2011
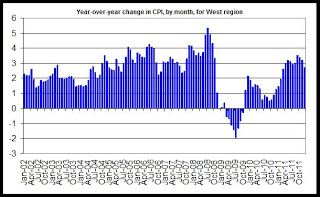
Nationally, the CPI was unchanged for the third month in a row:
In the first graph, we can see that the CPI growth in December 2011 was the largest annual change for December since 2007, prior to the financial crisis of 2008. 2004 through 2007 showed higher annual changes, reflecting much more robust economic growth during that period.
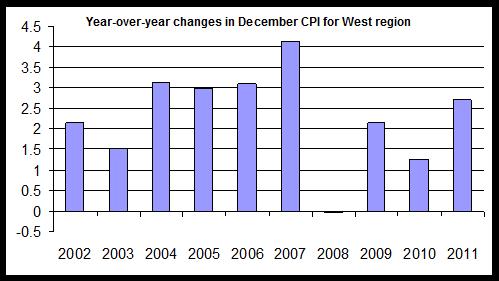
The price increases are being largely driven by transportation costs, such as gasoline. Transportation prices increased by 4.5 percent, year over year. Food costs and apparel also increased significantly, rising 4.1 percent and 3.8 percent, respectively.
Housing prices were restrained at a year-over-year increase of 1.8 percent. Although increases in rent have exceeded 5 percent in many areas of the state, the housing component of CPI also reflects declining home prices, which indirectly mitigate the increases in rent levels within the index.
Recent price increases will impact household calculations and attitudes on spending as many households conclude that discretionary spending will need to be scaled back in the face of increasing food and transportation costs.
This in turn will have effects on home purchase activity as well. Note: In addition to the issue of disposable income is the issue of interest rates. Should the Federal Reserve conclude that inflation does need to be addressed, the resulting increase in interest rates would also push down home purchase activity. (Recent declines in the mortgage rate have not spurred large amounts or refinance or purchase activity, as noted in the Division of Housing's analysis of releases of deeds of trust.
Last Friday, CNBC reported that the Fed's FOMC is seriously considering more quantitative easing which could spur additional inflation.
The second graph shows year-over-year changes in CPI for all months since 2002. If current trends continue, CPI growth has generally stalled around 3 percent since March 2011
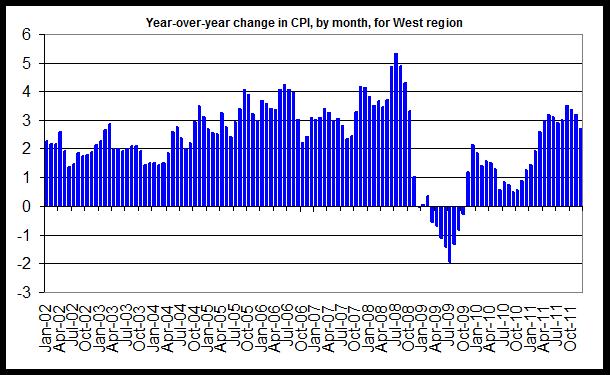
Nationally, the CPI was unchanged for the third month in a row:
The Consumer Price Index for All Urban Consumers (CPI-U) was unchanged in December on a seasonally adjusted basis, the U.S. Bureau of Labor Statistics reported today. Over the last 12 months, the all items index increased 3.0 percent before seasonal adjustment.
Similar to last month, the energy index declined in December and offset increases in other indexes. The gasoline index declined for the third month in a row and the household energy index declined as well.The food index rose in December, with the index for food at home turning up after declining last month.
Housing starts in U.S. West flat, multifamily starts up slightly
Housing starts in the West Census region of the US, which includes Colorado, were unchanged from a year earlier during December, counting both single-family and multi-family units. According to new housing construction and housing starts data released today by the US Census Bureau, there were approximately 8,700 housing units started in the West during December 2011. Of the new units started, 5,700 were single-family structures and 3,000 were structures containing more than one housing unit.
Nationally, housing starts rose 23 percent during the same period, with total housing starts rising to a total of 41,800.
Total housing starts remain well below peak levels both nationally and in the West. December 2011 housing starts in the West were 84 percent below the peak reached during May 2004. Nationally, December 2011 was 78 percent below peak levels. The national peak in housing starts was reached during May 2005.
Multifamily starts have rebounded more than single-family starts. In the West, single-family starts are 88 percent below peak levels while multifamily starts are only 70 percent below peak levels.
The West census region includes California, so given the size of the West census region, the fact that total housing starts are at 8,700 indicates that new home construction continues to be very light throughout the region. Housing starts totals ranging from 35,000 to 45,000 were common from 2004 to 2006.
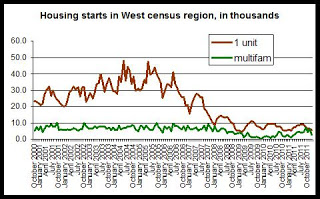
The first graph shows the difference between single-family starts and starts for structures with more than one housing unit. Both remain near ten-year lows, and single-family starts fell 1.7 percent from December 2010 to December 2011. Starts for structures with more than one unit, however, increased by 3.4 percent during the same period, rising from 2,900 units during December 2010, to 3,000 units during December of this year. Given recent data showing strength in the demand for rental-housing, the housing starts data may suggest that developers of rental housing are beginning to move forward with construction of new multifamily structures. Nevertheless, the weakness in growth during December suggests that new starts in multifamily units continue to face headwinds.
The second graph shows month-by-month comparisons in housing starts for each year in the West. December's housing starts total was a 29 percent decrease from November. Nationally, the decline during the same period was 19 percent. These month-over-month declines produced gloom among industry representatives who took the declines to mean a lack of hoped-for growth in housing starts.
As can be seen in the second graph, December housing starts were tied for the second-lowest December total reported during the past decade, and was the lowest total reported since February 2011.
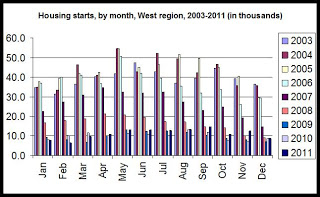
More sustained growth was visible in starts for structures with more than one housing unit. December was the fourth month in a row in which multifamily housing starts grew, year over year. As can be seen in the third graph, the December 2011 multifamily total for starts has exceeded the totals for both 2009 and 2010 but remains below every other December total since 2002.
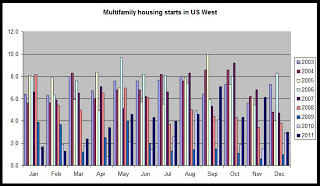
This data suggests that multifamily starts have established a clear growth trend over the past several months, but that this will not proceed without some weak spots, as was seen during December. Single-family starts clearly continue to face obstacles to recovery.
Nationally, housing starts rose 23 percent during the same period, with total housing starts rising to a total of 41,800.
Total housing starts remain well below peak levels both nationally and in the West. December 2011 housing starts in the West were 84 percent below the peak reached during May 2004. Nationally, December 2011 was 78 percent below peak levels. The national peak in housing starts was reached during May 2005.
Multifamily starts have rebounded more than single-family starts. In the West, single-family starts are 88 percent below peak levels while multifamily starts are only 70 percent below peak levels.
The West census region includes California, so given the size of the West census region, the fact that total housing starts are at 8,700 indicates that new home construction continues to be very light throughout the region. Housing starts totals ranging from 35,000 to 45,000 were common from 2004 to 2006.
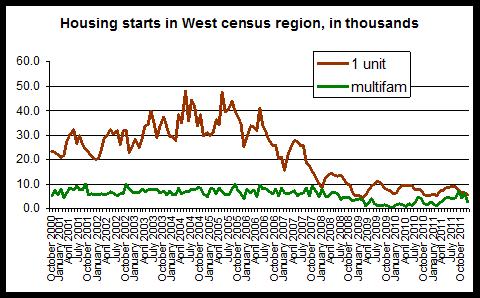
The first graph shows the difference between single-family starts and starts for structures with more than one housing unit. Both remain near ten-year lows, and single-family starts fell 1.7 percent from December 2010 to December 2011. Starts for structures with more than one unit, however, increased by 3.4 percent during the same period, rising from 2,900 units during December 2010, to 3,000 units during December of this year. Given recent data showing strength in the demand for rental-housing, the housing starts data may suggest that developers of rental housing are beginning to move forward with construction of new multifamily structures. Nevertheless, the weakness in growth during December suggests that new starts in multifamily units continue to face headwinds.
The second graph shows month-by-month comparisons in housing starts for each year in the West. December's housing starts total was a 29 percent decrease from November. Nationally, the decline during the same period was 19 percent. These month-over-month declines produced gloom among industry representatives who took the declines to mean a lack of hoped-for growth in housing starts.
As can be seen in the second graph, December housing starts were tied for the second-lowest December total reported during the past decade, and was the lowest total reported since February 2011.
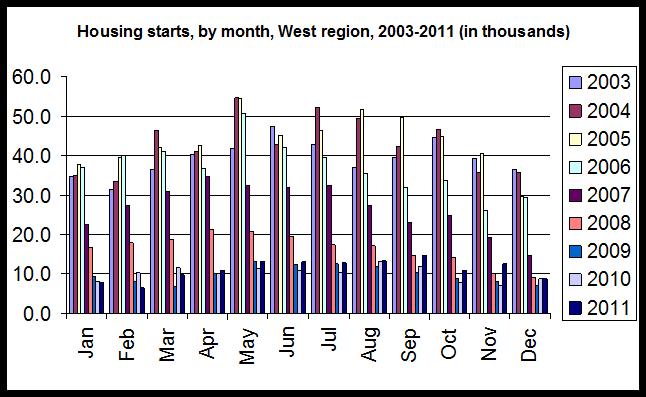
More sustained growth was visible in starts for structures with more than one housing unit. December was the fourth month in a row in which multifamily housing starts grew, year over year. As can be seen in the third graph, the December 2011 multifamily total for starts has exceeded the totals for both 2009 and 2010 but remains below every other December total since 2002.
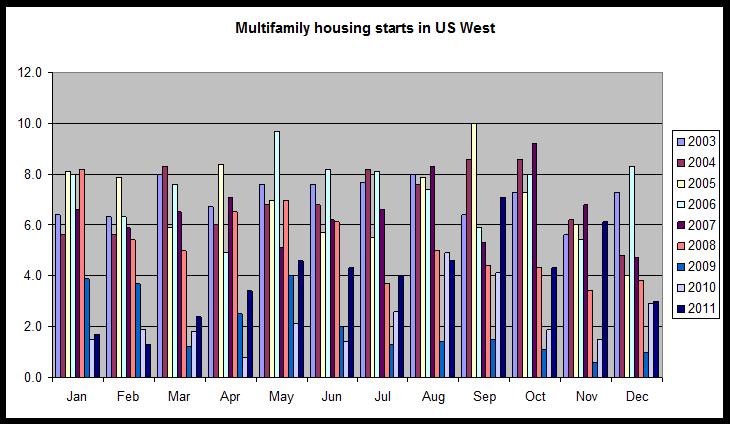
This data suggests that multifamily starts have established a clear growth trend over the past several months, but that this will not proceed without some weak spots, as was seen during December. Single-family starts clearly continue to face obstacles to recovery.
Housing News Digest, January 19
Ag housing was ‘worth the wait’
The grand opening of Alta Vista de la Montaña in North Delta last week culiminated four years of effort to provide safe, decent and affordable rental housing for agricultural workers in the area.
During the grand opening ceremony on Jan. 12, funding partner Jamie Spakow, USDA Rural Development, acknowledged the challenges in finding the right location, the right funding sources and the best development team for the project.
Housing starts fell in December, capping a grim year
U.S. housing starts fell in December as groundbreaking on rental properties posted a big decline, splashing some cold water on hopes the still-weak housing sector could boost economic growth this year.
The Commerce Department said Thursday housing starts fell 4.1 percent last month to a seasonally adjusted annual rate of 657,000 units. Economists polled by Reuters had forecast housing starts edging down to a 680,000-unit rate in December.
Pueblo, Fort Collins lead economic comeback in Colorado
Pueblo and Fort Collins — which suffered lighter job losses in the downturn than much of the rest of the state — are expected to be the first metro areas in Colorado to recover their lost jobs.
But it could take another three years before Denver and Colorado Springs do so, and Grand Junction may not regain peak employment until after 2017, according to a study released Wednesday by the U.S. Conference of Mayors.
Mortgage rates hit another record low, housing struggles
WASHINGTON - The average rate on the 30-year fixed mortgage fell again this week to a record low. The eighth record low in a year is attracting few takers because most who can afford to buy or refinance have already done so.
Some real estate pros take aim at anti-piracy legislation
Think of all the shared information: multiple listing services, photos, videos. Can you verify the copyrights of all the content? One unknown copyright infringement, like finding a needle in a sky-high haystack, could mean your whole site being removed, blocked, if this legislation passes, critics say.
Dr. Jim Gaines, a researcher at Texas A&M;'s Real Estate Center, said that this legislation could have severe ramifications for the real estate industry. He mentioned possible data-sharing restrictions, like multiple listing service info on Craigslist, as an example.
Freddie Mac says the average rate on the 30-year fixed mortgage dipped to 3.88% this week, down from the old record of 3.89% one week ago.
Housing May Turn the Corner in 2012: CoreLogic
CoreLogic’s chief economist Mark Fleming says housing statistics and the duration of the downturn to date indicate 2012 may be the year the housing market begins to turn the corner.
In the first release of CoreLogic’s new MarketPulse newsletter Wednesday, Fleming explained his rationale for such an assessment.
He notes that housing is an industry with long business cycles. Regional housing recessions have typically taken anywhere from three to five years to find their bottom, and Fleming says the national housing recession has behaved similarly in that it has bounced along a bottom for the past two years.
Wednesday, January 18, 2012
Year-end 2011 Housing Snapshot now available
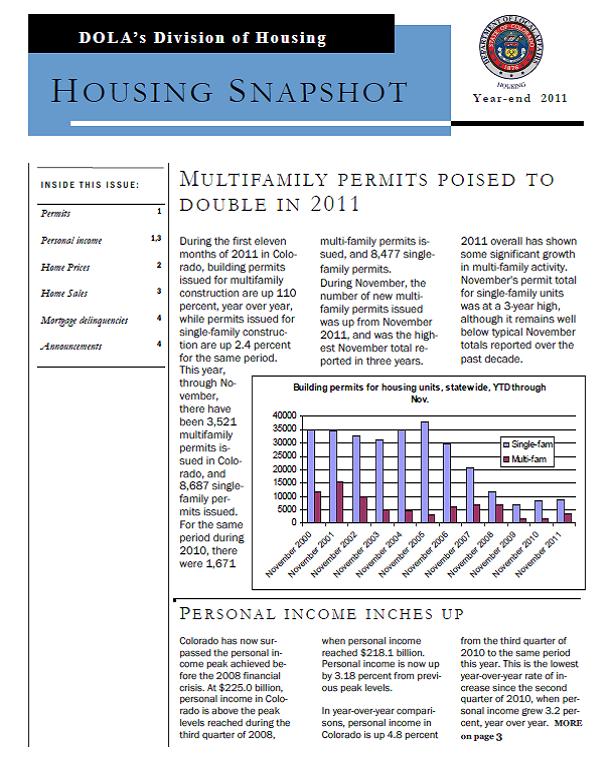
The statewide Housing Snapshot for year-end 2011 is available here.
At four pages, the Housing Snapshot is a very concise summary of recent housing trends. It's published 6 times a year to provide a quick snapshot of housing trends in Colorado for the non-expert.
Industry employment trends in Colorado since 2007
New employment information for December will be available in early February. Before those numbers, come out, however, we can take a quick look at employment trends in various industries. These numbers are based on employment totals through November 2011.
Employment growth by industry is important because it can give us some idea of whether or not job growth is occurring in traditionally high-wage industries or low-wage industries.
In the first graph, one of the first things we notice is that jobs in the construction industry are down considerably over both the last three years and the last five years. Over the past five years, construction jobs in Colorado have declined by almost 36 percent, and they've dropped by more than 12 percent over the past three years. This change reflects a drop of about 60,000 jobs since 2007.
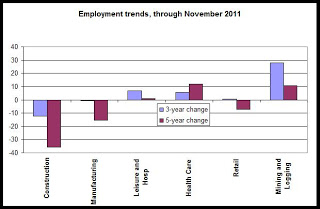
Mining and logging, on the other hand has shown a significant increase, but this industry is much smaller, and the 27 percent increase in jobs since 2009 reflects an increase of only 7,000 jobs. The construction industry now employs about 109,000 workers while mining and logging employs about 29,000 workers.
Two of the largest industries in the state, and two industries in which growth has been positive in recent years, are health care, and leisure and hospitality. Growth has been positive in both industries in both 3-year and 5-year time spans. Leisure and hospitality has added about 3,000 jobs since 2007 while health care has added about 26,000 jobs during the same period.
The second graph shows general trends in total employment in five industries since Janaury 2007. Construction and manufacturing are down while health care and leisure and hospitality are up. Retail trade has been largely flat.
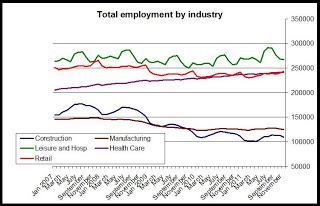
The loss of so many jobs in construction, which has traditionally been an industry that provides relatively high wages to workers with limited educational levels, will likely have an overall negative impact on aggregate wages. At the same time, recent gains in leisure and retail jobs appear to be tapering off.
(These totals, from the Colorado Dept. of Labor and employment, are not seasonally adjusted.)
Employment growth by industry is important because it can give us some idea of whether or not job growth is occurring in traditionally high-wage industries or low-wage industries.
In the first graph, one of the first things we notice is that jobs in the construction industry are down considerably over both the last three years and the last five years. Over the past five years, construction jobs in Colorado have declined by almost 36 percent, and they've dropped by more than 12 percent over the past three years. This change reflects a drop of about 60,000 jobs since 2007.

Mining and logging, on the other hand has shown a significant increase, but this industry is much smaller, and the 27 percent increase in jobs since 2009 reflects an increase of only 7,000 jobs. The construction industry now employs about 109,000 workers while mining and logging employs about 29,000 workers.
Two of the largest industries in the state, and two industries in which growth has been positive in recent years, are health care, and leisure and hospitality. Growth has been positive in both industries in both 3-year and 5-year time spans. Leisure and hospitality has added about 3,000 jobs since 2007 while health care has added about 26,000 jobs during the same period.
The second graph shows general trends in total employment in five industries since Janaury 2007. Construction and manufacturing are down while health care and leisure and hospitality are up. Retail trade has been largely flat.
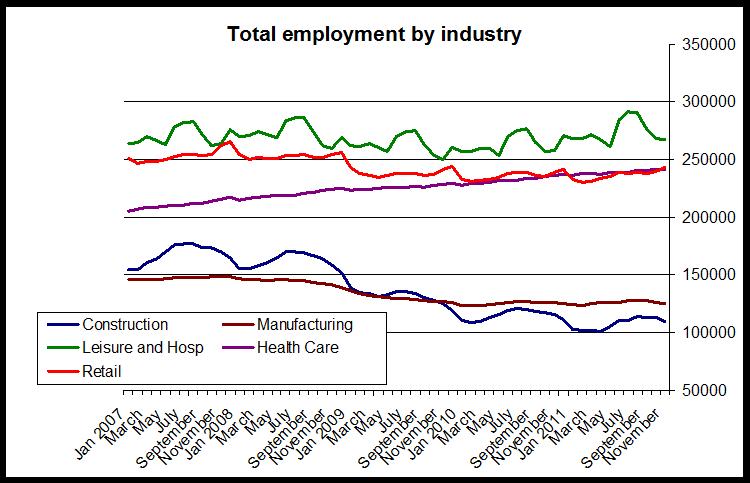
The loss of so many jobs in construction, which has traditionally been an industry that provides relatively high wages to workers with limited educational levels, will likely have an overall negative impact on aggregate wages. At the same time, recent gains in leisure and retail jobs appear to be tapering off.
(These totals, from the Colorado Dept. of Labor and employment, are not seasonally adjusted.)
Colorado leisure and hospitality jobs recover, construction falls again
According to November's employment data, released by the Colorado Department of Labor and Employment, overall employment in Colorado rose for the fifth month in a row in November. Thanks partially to continued declines in the labor force, the unemployment rate also fell to 7.8 percent.
At the Division of Housing, we keep an eye on industries that are often connected to affordable housing and real estate trends.
Today, we'll look at job creation in the following industries: construction, leisure and hospitality, and retail.
Construction is a key indicator since it is connected to housing production. The construction jobs examined below also include non-residential construction.
In the first chart, we can see that as of November 2011, construction jobs remain near the July 2011 low of 103,400 construction jobs. Construction jobs in November remain near October 2011's eight-month high, but remain well below peak levels. Since construction jobs peaked during July 2007, construction jobs have fallen 36 percent, or 62,000 jobs. Although November's totals were up month to month, totals were down compared to November of last year by 6,200 jobs.
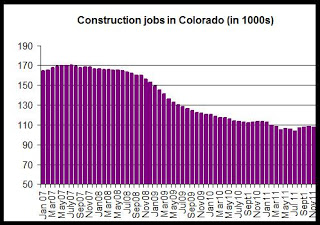
Unlike many industries, construction jobs did not drop to an initial low and then rebound. Overall, total construction employment has continued to drop since 2007.
Retail jobs, and jobs in the leisure and hospitality industry are key factors in the rural resort economies, and are also important statewide as sources of income for low-income households. In the chart below, we see that retail jobs have recovered somewhat but have not returned to peak levels.
Leisure and hospitality jobs, on the other hand, have recovered to a significant degree since early 2010 and leisure jobs have now exceeded 2008's peak levels.
In leisure and hospitality, total jobs are now up 0.8 percent, or about 8,200 jobs, over the June 2008 peak. From November 2010 to November 2011, total jobs increased 3.7 percent, or about 10,000 jobs.
Retail jobs have not recovered as much as those in leisure and hospitality. From November of last year to November 2011, total employment in retail is up about 4,300 jobs. Since the April 2008 peak, retail jobs are down 7.6 percent, or about 17,500 jobs.
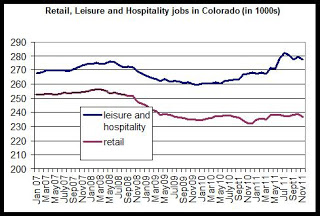
(Data is seasonally adjusted.)
At the Division of Housing, we keep an eye on industries that are often connected to affordable housing and real estate trends.
Today, we'll look at job creation in the following industries: construction, leisure and hospitality, and retail.
Construction is a key indicator since it is connected to housing production. The construction jobs examined below also include non-residential construction.
In the first chart, we can see that as of November 2011, construction jobs remain near the July 2011 low of 103,400 construction jobs. Construction jobs in November remain near October 2011's eight-month high, but remain well below peak levels. Since construction jobs peaked during July 2007, construction jobs have fallen 36 percent, or 62,000 jobs. Although November's totals were up month to month, totals were down compared to November of last year by 6,200 jobs.

Unlike many industries, construction jobs did not drop to an initial low and then rebound. Overall, total construction employment has continued to drop since 2007.
Retail jobs, and jobs in the leisure and hospitality industry are key factors in the rural resort economies, and are also important statewide as sources of income for low-income households. In the chart below, we see that retail jobs have recovered somewhat but have not returned to peak levels.
Leisure and hospitality jobs, on the other hand, have recovered to a significant degree since early 2010 and leisure jobs have now exceeded 2008's peak levels.
In leisure and hospitality, total jobs are now up 0.8 percent, or about 8,200 jobs, over the June 2008 peak. From November 2010 to November 2011, total jobs increased 3.7 percent, or about 10,000 jobs.
Retail jobs have not recovered as much as those in leisure and hospitality. From November of last year to November 2011, total employment in retail is up about 4,300 jobs. Since the April 2008 peak, retail jobs are down 7.6 percent, or about 17,500 jobs.
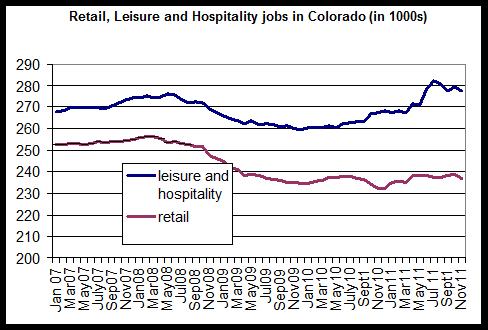
(Data is seasonally adjusted.)
Median single- fam home prices: Denver up, Colorado and Pikes Peak down
Median home prices for single-family homes fell in Colorado and in the Pikes Peak region, but rose in the state's two largest market areas. According to median home price data for November, released by the Colorado Association of Realtors, the median home price for single-family homes in the Denver area was $232,700 during, which is an increase of 1.9 percent from November of 2010. Statewide, the median home price was $211,300 during November, a drop of 2.1 percent from the same month last year. The median price in the Pikes Peak region fell 7.4 percent, year over year, falling to $185,300 during November.
The first graph shows the median single-family home price for the state and for the metro Denver and Pikes Peak regions. Median home prices fell dramatically in all three measures following the financial crisis of late 2008, but moved back up quickly by mid-2009. Since mid-2009, however, median home prices have been largely flat in metro Denver, but have shown a slight drift upward. In the pikes peak region, on the other hand, the median price remains well below peak levels, ranging from 15 percent to 20 percent in recent months. Statewide, as is typical, the median price has been more volatile, but has not recovered as much as the metro Denver median. Statewide, sales prices are likely being pushed down by declining markets in western Colorado and in the central mountains.

The metro Denver area, where the median price is 12 percent below its June 2007 peak levels, has recovered the most. Metro Denver prices appear to have stabilized since 2009 and the median price generally moves between 220K and 240K. Following an initial recovery in late 2009, the statewide median price has shown a largely downward trend since early 2010. The statewide median price is now 14 percent below its June 2006 peak, and fell below 200K during most months of the past year. The Pikes peak median price is 19 percent below its July 07 peak and has been generally flat since late 2009, moving between 180K and 200K.
During recent months, with the exception of metro Denver in November, the median prices appear to have entered negative territory when compared to the same months of the previous year. As can be seen in the second graph, the year-over-year changes in all three areas have been generally negative each month for the past six months.
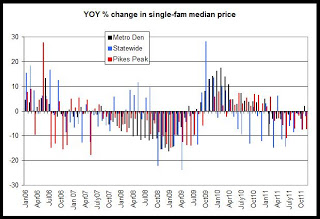
This downward trend is mirrored in other home prices indices for Colorado such as the Case-Shiller, CoreLogic and FHFA indices. See here for past analyses using other indices. The year over year declines shown here tend to be larger than those of the other indices, and is likely due to differences in method.
The home price data provided by the Colorado Association of Realtors is based on home sales transactions that are listed in the MLS systems for each area and do not include for-sale-by-owner transactions or new homes sold directly by home builders.
The first graph shows the median single-family home price for the state and for the metro Denver and Pikes Peak regions. Median home prices fell dramatically in all three measures following the financial crisis of late 2008, but moved back up quickly by mid-2009. Since mid-2009, however, median home prices have been largely flat in metro Denver, but have shown a slight drift upward. In the pikes peak region, on the other hand, the median price remains well below peak levels, ranging from 15 percent to 20 percent in recent months. Statewide, as is typical, the median price has been more volatile, but has not recovered as much as the metro Denver median. Statewide, sales prices are likely being pushed down by declining markets in western Colorado and in the central mountains.
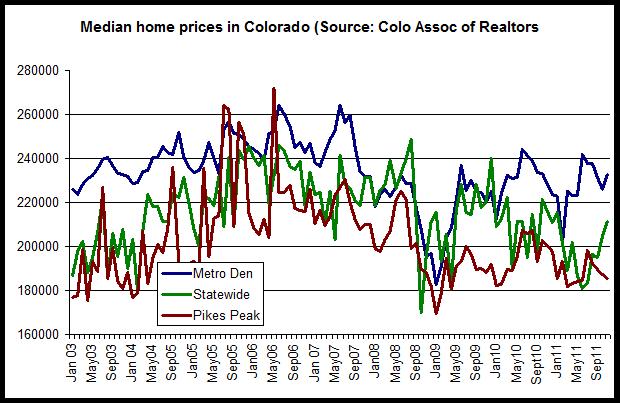
The metro Denver area, where the median price is 12 percent below its June 2007 peak levels, has recovered the most. Metro Denver prices appear to have stabilized since 2009 and the median price generally moves between 220K and 240K. Following an initial recovery in late 2009, the statewide median price has shown a largely downward trend since early 2010. The statewide median price is now 14 percent below its June 2006 peak, and fell below 200K during most months of the past year. The Pikes peak median price is 19 percent below its July 07 peak and has been generally flat since late 2009, moving between 180K and 200K.
During recent months, with the exception of metro Denver in November, the median prices appear to have entered negative territory when compared to the same months of the previous year. As can be seen in the second graph, the year-over-year changes in all three areas have been generally negative each month for the past six months.
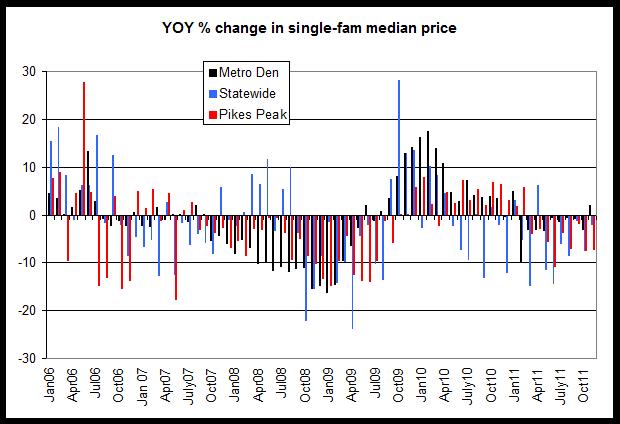
This downward trend is mirrored in other home prices indices for Colorado such as the Case-Shiller, CoreLogic and FHFA indices. See here for past analyses using other indices. The year over year declines shown here tend to be larger than those of the other indices, and is likely due to differences in method.
The home price data provided by the Colorado Association of Realtors is based on home sales transactions that are listed in the MLS systems for each area and do not include for-sale-by-owner transactions or new homes sold directly by home builders.
Housing News Digest, January 18
Denver economy falters in global comparison
Denver - along with most other metro areas in the United States - fared poorly in a report ranking the world’s fastest-growing economies released today by the Brookings Institution .
The performance of the Denver-area’s economy was among the weakest, with a 0.9 percent drop in income since 2010 and a 0.5 percent increase in employment. That puts Denver at No. 174 on the Brookings Institution’s list of 200.
Bohemian grants 36 nonprofits $517,574
Pat Stryker's Bohemian Foundation awarded $517,574 to 36 nonprofits through its fall Pharos Fund Grant Round.
The 36 nonprofit organizations are all involved with helping improve the quality of education and well-being of children, teens and families and promote community engagement, the foundation said in a news release.
Housing sales expected to rise in 2012
According to local realtor Jean Wheaton of Re/Max properties in the Tri-Lakes area there were 429 single family homes sold in 2010 and 400 sold in 2011. This includes new and existing homes. The average price for a single family home was $379,907 in 2010 and $375,387 in 2011 with the average price per square foot decreasing slightly.
The overall sales in Colorado Springs are up 3.5 percent from last year. Additionally, the inventory of unsold homes dropped 25.5 percent in Colorado Springs to 3,255 which is only a five-month supply at the December sales rate.
Calpers to sell housing portfolio: report
Calpers, the biggest U.S. public pension fund, will sell the portfolio for $500 to $600 million, the Journal said, citing people familiar with the deal.
Calpers bought the property over the course of five years starting in 2002 and is likely suffering a loss of as much as 30 to 50 percent as the deal values each home site at no more than about $35,000, the Journal said.
National Apartment Vacancy To Dip Down to 5% by Year End
So says a 2012 National Apartment Report, which was released by Marcus & Millichap. Tight supply conditions exist, especially in metros with high barriers to entry, says the report. “Foreclosures in the single-family market, the inability of most Americans to meet mortgage financing requirements and households choosing rental housing for lifestyle reasons or employment mobility contributed to a net rise in apartments.”
Tuesday, January 17, 2012
Home sales totals turn positive in Colorado, metro Denver, Colorado Springs
The number of single-family home sales closings increased again in November in metro Denver, the Pikes Peak Region, and statewide. According to home sales information released by the Colorado Association of Realtors, the number of single-family closings rose 11.6 percent in metro Denver during November, compared to November of last year. Over the same period, closings rose 13.6 percent statewide, and 19.1 percent in the Pikes Peak region. Statewide in November, there were 4,467 closings. 2,471 of them were in the metro Denver region and 646 occurred in the Pikes Peak region.
The number of closings in all three measures has increased, year over year, each month for the past five months.
This recent growth trend has also begun to show up in the 12-month moving averages used to track trends in home sales. The highly-cyclical nature of home sales trends makes it difficult to track multi-year trends in home sales. The addition of the homebuyer tax credits from 2008 to 2010 further complicated the picture. So, I have smoothed out the sales totals using a 12-month moving average for each month.
In the first graph, we see the moving average in home sales compared to year-over-year changes in the average for the metro Denver area. The trend in home sales closing has been downward since mid-2005 and accelerated in early 2009. From March 2008 until September 2011, every month showed a negative year-over-year change in home sales. In November, the year-over-year change was positive for the second time in 46 months, with an increase of 1.7 percent. As indicated by the moving averages themselves, overall home sales numbers have been generally flat since early 2009.
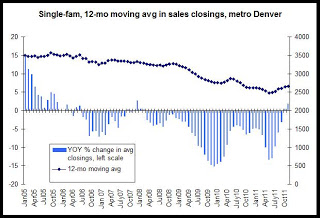
The second graph shows the same measurements for Colorado statewide. The year-over-year change in the statewide average for home sales turned positive in November for the second time in 14 months. Statewide, transactions moved into positive territory in response to the homebuyer tax credits that were were offered in 2009 and 2010, but moved into negative territory again after the expiration of the credits. The statewide moving average increased 3.7 percent in November, year over year.
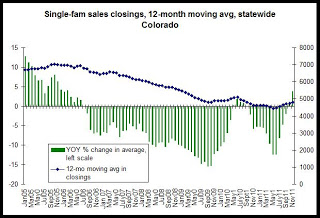
The third graph shows the same measures for the Pikes Peak region. The homebuyer tax credit produced much larger changes in the regional trends in the Pikes Peak region than in metro Denver or statewide. The year over year change in November was positive, making it the first time in thirteen months that the year-over-year change in average sales has been positive. Excluding the run-up in home sales produced by the tax credit in 2009 and 2010, the average in home sales has been largely flat since mid-2009 in the Pikes Peak region, but has turned slightly upward in recent months.
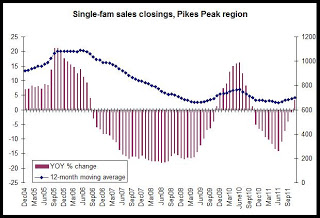
The analysis of moving averages in home sales activity indicates that the markets continue to stabilize in metro Denver, the Pikes Peak region, and statewide. Overall activity has been flat since 2009, but recent upward trends suggest that sales activity will continue to build at least in the near term. Sales totals, however, are likely to continue to be well below peak levels for at least the next year.
The number of closings in all three measures has increased, year over year, each month for the past five months.
This recent growth trend has also begun to show up in the 12-month moving averages used to track trends in home sales. The highly-cyclical nature of home sales trends makes it difficult to track multi-year trends in home sales. The addition of the homebuyer tax credits from 2008 to 2010 further complicated the picture. So, I have smoothed out the sales totals using a 12-month moving average for each month.
In the first graph, we see the moving average in home sales compared to year-over-year changes in the average for the metro Denver area. The trend in home sales closing has been downward since mid-2005 and accelerated in early 2009. From March 2008 until September 2011, every month showed a negative year-over-year change in home sales. In November, the year-over-year change was positive for the second time in 46 months, with an increase of 1.7 percent. As indicated by the moving averages themselves, overall home sales numbers have been generally flat since early 2009.
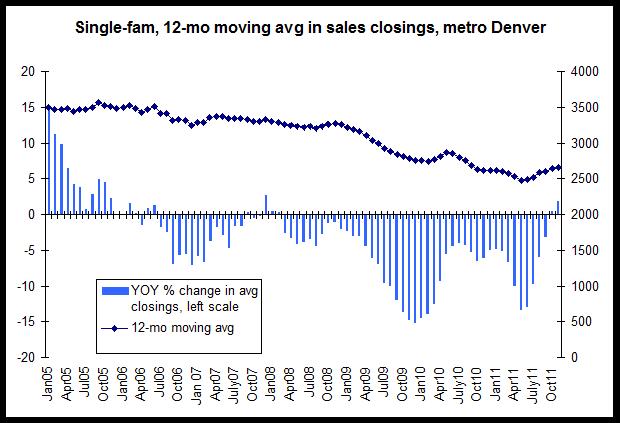
The second graph shows the same measurements for Colorado statewide. The year-over-year change in the statewide average for home sales turned positive in November for the second time in 14 months. Statewide, transactions moved into positive territory in response to the homebuyer tax credits that were were offered in 2009 and 2010, but moved into negative territory again after the expiration of the credits. The statewide moving average increased 3.7 percent in November, year over year.
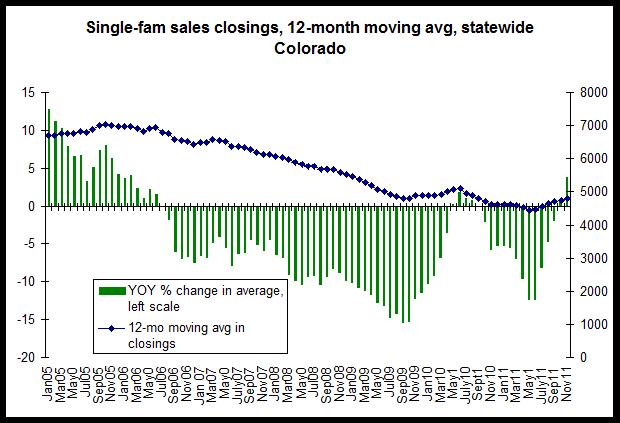
The third graph shows the same measures for the Pikes Peak region. The homebuyer tax credit produced much larger changes in the regional trends in the Pikes Peak region than in metro Denver or statewide. The year over year change in November was positive, making it the first time in thirteen months that the year-over-year change in average sales has been positive. Excluding the run-up in home sales produced by the tax credit in 2009 and 2010, the average in home sales has been largely flat since mid-2009 in the Pikes Peak region, but has turned slightly upward in recent months.
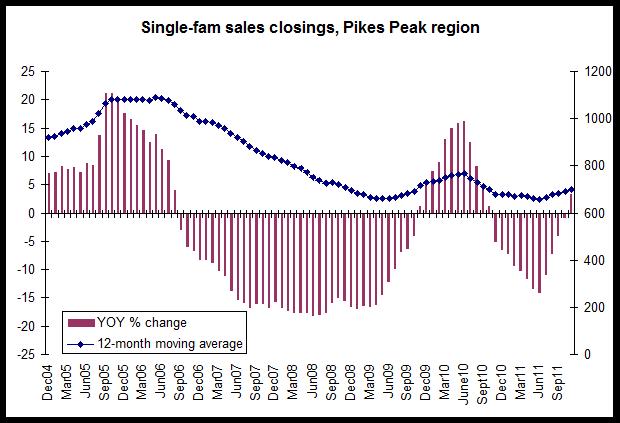
The analysis of moving averages in home sales activity indicates that the markets continue to stabilize in metro Denver, the Pikes Peak region, and statewide. Overall activity has been flat since 2009, but recent upward trends suggest that sales activity will continue to build at least in the near term. Sales totals, however, are likely to continue to be well below peak levels for at least the next year.
Multifamily permits in Colorado up 110 percent through November 2011
During the first eleven months of 2011 in Colorado, building permits issued for multifamily construction are up 110 percent, year over year, while permits issued for single-family construction are up 2.4 percent for the same period.
This year, through November, there have been 3,521 multifamily permits issued in Colorado, and 8,687 single-family permits issued. For the same period during 2010, there were 1,671 multi-family permits issued, and 8,477 single-family permits.
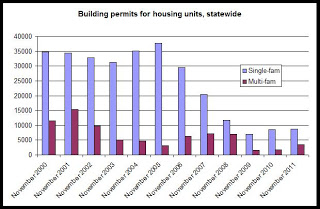
For the month of November alone, single-family permits are up, year-over-year, by 14.3 percent, and multi-family permits are up by 66 percent. There were 724 single-family permits and 186 multi-family permits issued during November 2011. There were 633 single-family permits and 112 multi-family permits issued during November 2010.
The second graph shows that overall, both multi-family and single-family permits in November were at levels below what were typical over the past decade, but that both are increasing.
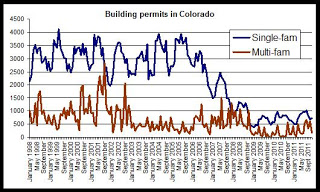
During November, the number of new multi-family permits issued was up from November 2011, and was the highest November total reported in three years. 2011 overall has shown some significant growth in multi-family activity.
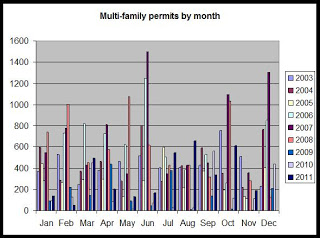
Growth in single-family permit activity suggests there is some hope among single-family homebuilders, but that demand is restrained. November's permit total for single-family units was at a 3-year high, although it remains well below typical November totals reported over the past decade.
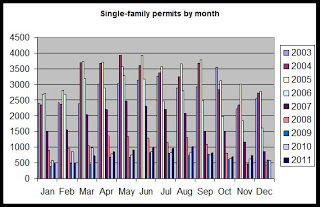
Conclusions: This data further reinforces the notion that interest in new multifamily construction continues to increase at a much faster rate than interest in single-family construction.
This year, through November, there have been 3,521 multifamily permits issued in Colorado, and 8,687 single-family permits issued. For the same period during 2010, there were 1,671 multi-family permits issued, and 8,477 single-family permits.
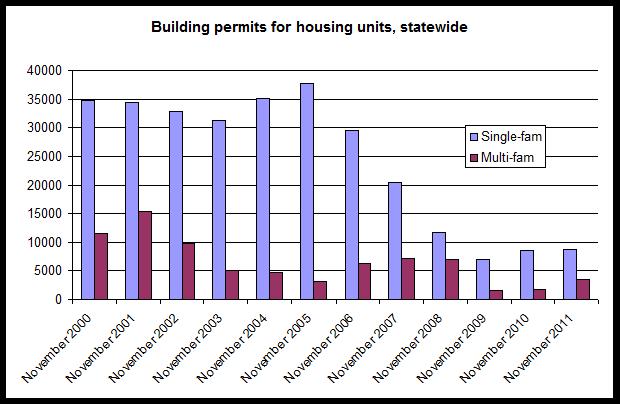
For the month of November alone, single-family permits are up, year-over-year, by 14.3 percent, and multi-family permits are up by 66 percent. There were 724 single-family permits and 186 multi-family permits issued during November 2011. There were 633 single-family permits and 112 multi-family permits issued during November 2010.
The second graph shows that overall, both multi-family and single-family permits in November were at levels below what were typical over the past decade, but that both are increasing.
During November, the number of new multi-family permits issued was up from November 2011, and was the highest November total reported in three years. 2011 overall has shown some significant growth in multi-family activity.
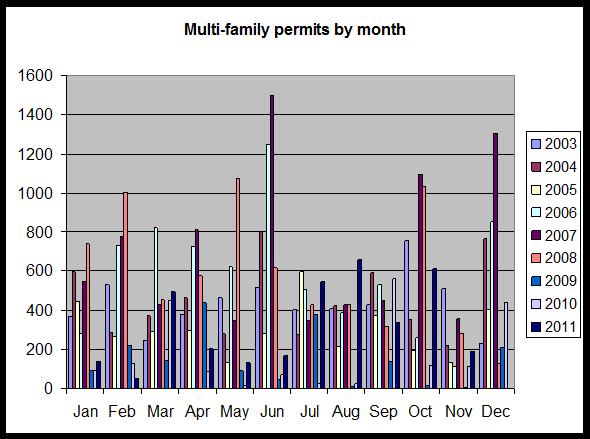
Growth in single-family permit activity suggests there is some hope among single-family homebuilders, but that demand is restrained. November's permit total for single-family units was at a 3-year high, although it remains well below typical November totals reported over the past decade.
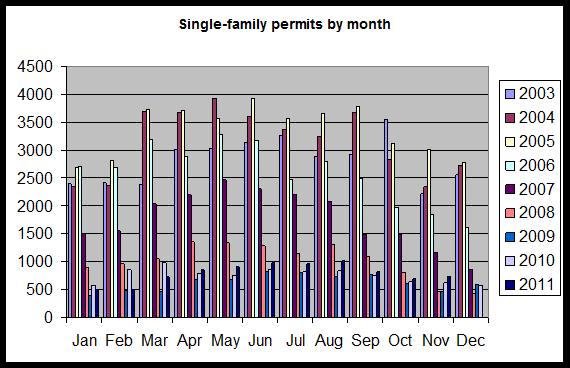
Conclusions: This data further reinforces the notion that interest in new multifamily construction continues to increase at a much faster rate than interest in single-family construction.
Median condo and townhome prices flatten statewide and in Colo Springs area
The median price for condos and townhomes in the metro Denver area increased 0.7 percent, year over year, in November of this year. According to home price information for condos and townhomes, released by the Colorado Association of Realtors, the median price in the region rose to $125,900 from last November's median price of $125,000. Statewide, the median price fell 8.18 percent, falling from November 2010's price of $136,600 to November 2011's price of $125,400. In the Pikes Peak region, the median price rose 0.8 percent to $127,500 during November, rising from November 2010's price of $126,400.
Condo and townhome prices remain well below peak median prices in each region. The statewide median price for condos and townhomes in November was down 46 percent from the March 2006 peak of $236,200. In metro Denver, the median price in November was down 22 percent from the July 06 peak of $163,300, and the Pikes Peak-area median price for condos and townhomes in November was down 21 percent from the September 2007 peak of $162,300.
The first graph shows the median home price in each area for each month since 2006.
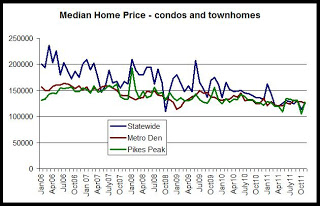
Condo and townhome prices do not appear to have stabilized as single-family homes have, and median prices appear to be continuing a slow downward trend. The substantial declines in statewide median prices for condos and townhomes are likely being pushed downward by significant drops in median prices for condos and townhomes in many mountain regions following the 2008 financial crisis.
The second graph shows year over year changes in median home prices for condos and townhomes. The last two months have shown some very small increases in all three areas, although it remains to be seen whether these brief increases will become a trend. Until October 2011, all three areas had reported declines in the median home price every month since February 2011. The overall trend in home prices among condos and townhomes over the past year has been down, although the recent increase in metro Denver does point toward some added stability in the Denver metro market.
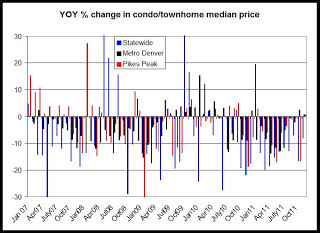
Condo and townhome prices remain well below peak median prices in each region. The statewide median price for condos and townhomes in November was down 46 percent from the March 2006 peak of $236,200. In metro Denver, the median price in November was down 22 percent from the July 06 peak of $163,300, and the Pikes Peak-area median price for condos and townhomes in November was down 21 percent from the September 2007 peak of $162,300.
The first graph shows the median home price in each area for each month since 2006.
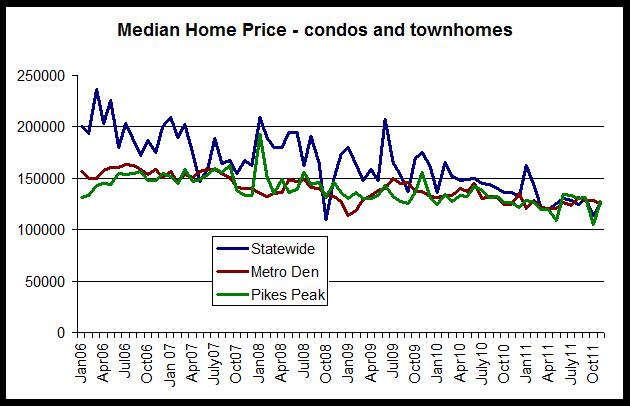
Condo and townhome prices do not appear to have stabilized as single-family homes have, and median prices appear to be continuing a slow downward trend. The substantial declines in statewide median prices for condos and townhomes are likely being pushed downward by significant drops in median prices for condos and townhomes in many mountain regions following the 2008 financial crisis.
The second graph shows year over year changes in median home prices for condos and townhomes. The last two months have shown some very small increases in all three areas, although it remains to be seen whether these brief increases will become a trend. Until October 2011, all three areas had reported declines in the median home price every month since February 2011. The overall trend in home prices among condos and townhomes over the past year has been down, although the recent increase in metro Denver does point toward some added stability in the Denver metro market.
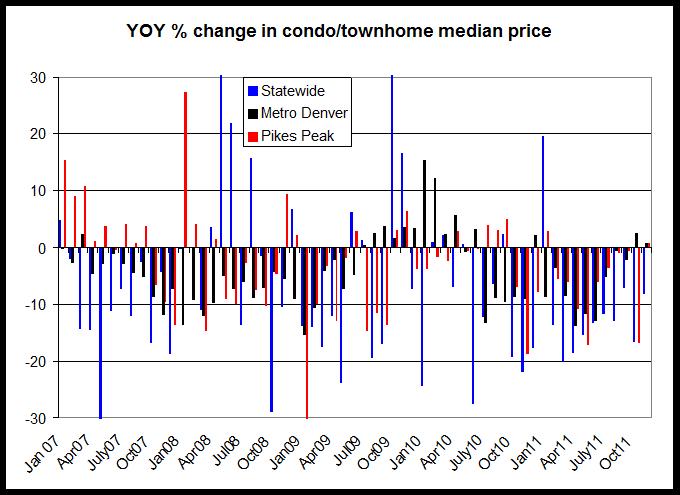
Condo and townhome sales in Colorado: statewide sales inch up, Colo Springs sales stall
Condo and townhome sales in metro Denver and statewide increased, year over year, for the fifth month in a row in November. According to condo and townhome sales data released by the Colorado Association of Realtors, sales increased statewide 2.3 percent in November 2011 from the same month a year earlier. They increased 3.6 percent in metro Denver over the same period. In the Pikes Peak region, on the other hand, November sales decreased 30.9 percent. In November, there were 924 sales statewide. 600 of them were in metro Denver and 67 were in the Pikes Peak region.
This recent growth trend in statewide and metro Denver sales is now seen in the 12-month moving averages used to track trends in home sales. The highly-cyclical nature of home sales trends makes it difficult to track multi-year trends in home sales. The addition of the homebuyer tax credits from 2008 to 2010 further complicated the picture. So, I have smoothed out the sales totals using a 12-month moving average for each month.
The first graph shows the 12-month moving averages in total condo and townhome sales in metro Denver and statewide. The overall trends since 2007 is clearly downward, although average statewide sales have largely stabilized since late 2009. Until recently, the moving average for condo and townhome sales had continued to move downward through late 2010 and most of 2011, although there have been some gains in recent months. The moving average in statewide sales increased 2.2 percent while the metro Denver average fell 1.9 percent. Nevertheless, the metro Denver decrease was the smallest year-over-year drops since October 2010.
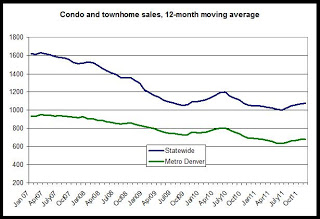
The second graph shows year-over-year changes in the 12-month condo and townhome sales average. We see increases during 2010 following the end of the homebuyer tax credit period. The year-over-year changes moved back into negative territory by early 2011, and the year-over-year change in the moving average, in both metro Denver and statewide, has remained negative for the past twelve months. The magnitude of the the decline for each month has lessened in both areas over the past five months. Statewide, the year-over-year change in the moving average in condo and townhome sales moved into positive territory for the first time in a year, although the annual change in metro Denver sales remained negative.
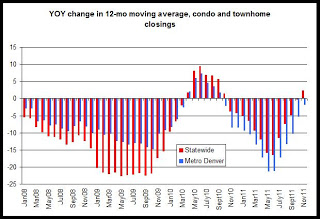
In the Pikes peak region, similar trends hold, although the homebuyer tax credits seem to have had a broader impact with the year over year change in sales remaining in positive territory for 15 months in a row. As can be seen in the third graph, sales activity has since declined. With a drop of 16 percent, November's year over year change was the largest decline reported since June 2009. This suggests that sales activity for condos and townhomes in the region continues to face headwinds.
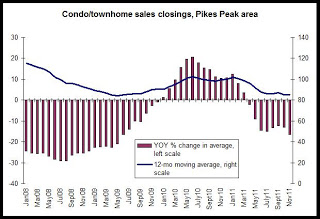
This recent growth trend in statewide and metro Denver sales is now seen in the 12-month moving averages used to track trends in home sales. The highly-cyclical nature of home sales trends makes it difficult to track multi-year trends in home sales. The addition of the homebuyer tax credits from 2008 to 2010 further complicated the picture. So, I have smoothed out the sales totals using a 12-month moving average for each month.
The first graph shows the 12-month moving averages in total condo and townhome sales in metro Denver and statewide. The overall trends since 2007 is clearly downward, although average statewide sales have largely stabilized since late 2009. Until recently, the moving average for condo and townhome sales had continued to move downward through late 2010 and most of 2011, although there have been some gains in recent months. The moving average in statewide sales increased 2.2 percent while the metro Denver average fell 1.9 percent. Nevertheless, the metro Denver decrease was the smallest year-over-year drops since October 2010.
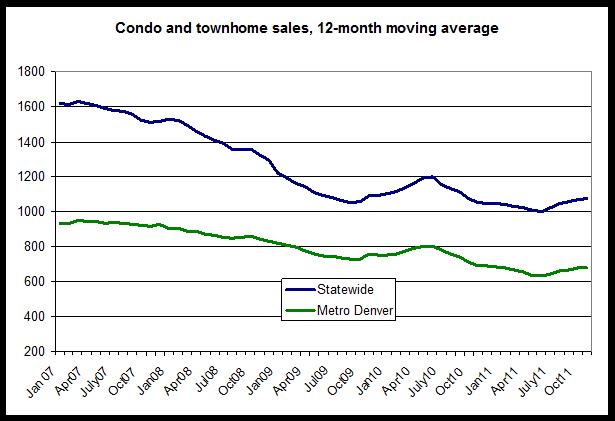
The second graph shows year-over-year changes in the 12-month condo and townhome sales average. We see increases during 2010 following the end of the homebuyer tax credit period. The year-over-year changes moved back into negative territory by early 2011, and the year-over-year change in the moving average, in both metro Denver and statewide, has remained negative for the past twelve months. The magnitude of the the decline for each month has lessened in both areas over the past five months. Statewide, the year-over-year change in the moving average in condo and townhome sales moved into positive territory for the first time in a year, although the annual change in metro Denver sales remained negative.
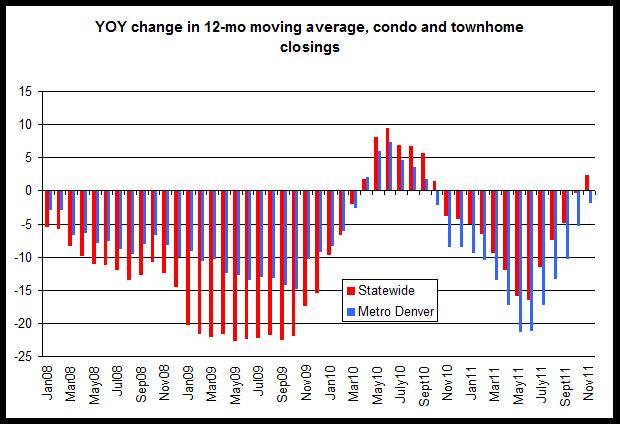
In the Pikes peak region, similar trends hold, although the homebuyer tax credits seem to have had a broader impact with the year over year change in sales remaining in positive territory for 15 months in a row. As can be seen in the third graph, sales activity has since declined. With a drop of 16 percent, November's year over year change was the largest decline reported since June 2009. This suggests that sales activity for condos and townhomes in the region continues to face headwinds.

Subscribe to:
Posts (Atom)