Monday, February 28, 2011

Home prices flat across much of Colorado in latest FHFA data

The Federal Housing Finance Agency last week released its house price index (HPI) numbers for the fourth quarter of 2010. The FHFA HPI is not as closely watched as the Case-Shiller data, but unlike the Case-Shiller index, FHFA offers home price index values for all metro areas of Colorado.

See here for the 4th Q report.

In the first chart, we see that house prices in Colorado have been more stable than national prices, and that there was much less of a bubble in Colorado. From the 4th quarter of 2009 to the 4th quarter of 2010, the house price index is down 1.3 percent in the US and it is down 1.0 percent in Colorado. The US index is down 10.9 percent since it peaked during the first quarter of 2007, and the Colorado index is down 4.5 percent since it peaked during the first quarter of 2008.


In the metropolitan markets of Colorado, the changes in the index levels are:


The chart shows the different price index changes over the past two quarters and over 1-year and 5-year periods. The chart is rather self-explanatory, and as can seen, over the past five years, price declines have been generally moderate in Colorado's metro areas.

The final chart shows the index curve for each metro area:


Conclusions: The FHFA data, coupled with the most recent Case-Shiller data (analysis here)further confirms that, while home prices are generally declining in Colorado, the continued decreases are continuing at a measured pace. There are presently no signs of a swift or large drop in home prices in regions of Colorado. Even Grand Junction, which was hit with a rather severe drop in prices following the financial panic of 2008, has moderated in recent quarters. On the other hand, there are few signs of sustained or significant price increases either.

The FHFA sums up the national situation as follows:

U.S. house prices fell in the fourth quarter of 2010 according to the Federal Housing Finance Agency’s (FHFA) seasonally adjusted purchase-only house price index (HPI). The HPI, calculated using home sales price information from Fannie Mae- and Freddie Mac-acquired mortgages, was 0.8 percent lower on a seasonally adjusted basis in the fourth quarter than in the third quarter of 2010. The unadjusted national decline was 2.2 percent. Over the past year, seasonally adjusted prices fell 3.9 percent from the fourth quarter of 2009 to the fourth quarter of 2010.

FHFA’s seasonally adjusted monthly index for December was down 0.3 percent from its November value. The monthly increase for the October-to-November period was revised downward from an initial estimate of 0.0 percent to -0.3 percent.

“Lingering unemployment and elevated inventories of for-sale homes contributed to the
ongoing decline of house prices,” said FHFA Acting Director Edward J. DeMarco.


Note: FHFA’s purchase-only and all-transactions HPI track average house price changes in repeat sales or refinancings on the same single-family properties. The purchase-only index is based on more than 6 million repeat sales transactions, while the all-transactions index includes more than 42 million repeat transactions. Both indexes are based on data obtained from Fannie Mae and Freddie Mac for mortgages originated over the past 36 years. The index values shown here all are not-seasonally-adjusted data from the all-transactions HPI.

January new home sales in US drop again to record lows, remain flat in West

New single-family home sales fell again in the US, but where flat in the “West” region which includes Colorado, according to a new report released by the Census Bureau.

The report, which monitors sales activity for newly constructed houses, reported that in the West, new home sales were flat, year over year, remaining at 5,000 in January for the third year in a row, while nationwide, sales dropped off 21 percent falling from 24,000 to 19,000 during the same period.

In January, new home sales tied for the lowest volume in at least a decade. The first chart shows monthly new home sales totals for each month since 2003. January’s total of 5,000 new homes sold tied with January 2010 and January 2009, and is near 4,000, the lowest monthly total recorded in the last decade.

The chart shows that since May 2010, the number of new homes sold has totaled between 4,000 and 6,000 homes each month. For the West region:


The drop off in home sales is likely tied to the end of the new home buyer tax credit which expired in April. The second chart shows that in both the West and in the US, new home sales were pushed up by the tax credit, and then fell quickly after April 2010.


New home sales and new home inventory continue to fall and have generally followed a downward trend since the middle of the decade.

New home sales peaked during the spring and summer of 2005 and have trended downward since. The number of new houses sold in the United States is down 85 percent since the peak of March 2005, and new home sales in the West have fallen 87 percent since sales peaked in the region during March 2004.

The third chart shows the declines in both US and regional new home sales.


The number of new homes for sale has also fallen off considerably. The number of new houses for sale in the West has fallen 68 percent since the total peaked during June 2007, and the same total has fallen 67 percent in the US since the number of new homes for sale peaked in the US during August 2006.

The number of homes for sale grew more quickly in the West than in the US, with growth in the West topping 119.6 percent from January 2001 to June 2007, and the total grew 92.2 percent from January 2001 to August 2006. The fourth chart shows the rise of new homes for sale.


The fifth chart shows the difference between the number of homes in the West region for sale at the beginning of a month vs. the number of homes sold during that month. Interestingly, the build up in inventory can be seen as it grows from 2004 to 2007. Historically, it appears that the a “normal” difference between new homes for sale and new homes sold is somewhere between 40,000 and 50,000 homes in the region. This total reaches almost 120,000 homes during the peak months, and has now fallen to below 40,000 homes, where the total has remained for the past several months. The build-up in inventory clearly shows a situation in which the construction of new homes was exceeding the purchase of new homes. The difference between new homes for sale and new homes sold has declined considerably in recent year, although this is due primarily to a large decline in new construction, and not to significant increases in demand for new homes.


The Census Bureau only provides new home data at a regional level. Extrapolating to the Colorado is problematic with this data since the West region includes California, Arizona and Nevada, all of which experienced large housing bubbles. Nevertheless, regional banks, builders and housing providers will gain insights into how Colorado fits into the larger Western region.

Inflation-adjusted rents for single-family/condo units declines

The Denver-Boulder-Greeley CPI increased 17.6 percent from the third quarter of 2001 to the third quarter of 2010. Over the same period, the average rent for single-family homes and rental condos in Denver metro increased 8.9 percent. In other words, average rents did not keep up with inflation over the past decade.

Here we see average rents in single-family homes and rental condos in metro Denver. Rental data is current through the fourth quarter of 2010 and is based on Division of Housing data:


If we adjust for inflation, we see that from the third quarter of 2001 to the third quarter of 2010, real rents declined from $955 to $884, a change of -7.3 percent. The decline in real rents was especially severe from 2003 to 2006 as large amounts of new home construction continually added new housing stock to the market. It was also unusually easy to finance a new home purchase during this period, so overall demand for rental housing declined and pushed down real rents.

Note: the Denver-Boulder-Greeley CPI is only released twice per year, so CPI values are not available for every quarter in which rents are measured.


As a final note, however, we should consider movements in median incomes, as compared to rents. The houshold income data provided by the Colorado Department of Local Affairs shows that incomes, when adjusted for inflation, have also been declining. In the third chart we see that median renter incomes declined 20 percent from 2001 to 2010, while homeowner median incomes declined 6 percent.

State of Colorado Public Housing Agency Annual Plan Public Notice

The plan will be submitted to the U.S. Department of Housing and Urban Development (HUD), Region VIII on April 15th, 2011, following.

The plan has been available on the internet since February 11, 2011 at http://dola.colorado.gov/cdh/section8/PHA%20Plan/2011PHAPlan.pdf
A public hearing has been scheduled by the Colorado Department of Local Affairs. The hearing will be held on Tuesday, March 29, 2011 in Denver, 1313 Sherman St., Room 518 Conference Room from 2:00-3:00.

Written comments must be received by April 8th, 2011, at the Colorado Division of Housing, 1313 Sherman Street, Room 500, Denver CO, 80203, ATTN: Autumn Gold. To submit comments via E-mail, please send to Autumn Gold [email protected].

Friday, February 25, 2011

Partners in Housing Awarded $23,500

Partners in Housing, Inc. received a $23,500 CHDO operating grant to conduct due diligence for the development of and/or acquisition and rehabilitation of multi-family rental units in Colorado Springs. CHDO operating funds will be used for predevelopment activities including: researching and analyzing of financing options, evaluating proformas, reviewing contracts, coordinating legal documents, and evaluating property management options. PIH has 19 years experience with service-enriched transitional and affordable rental developments for families in Colorado Springs and has over a 75% "graduation rate" from their programs.

Town of Bayfield awarded $50,000

The Town of Bayfield was awarded a $50,000 CDBG planning grant to pass through to the La Plata Homes Fund,a CDFI formed by the La Plata County Regional Housing Alliance (a multijurisdictional housing authority. Of the $50,000 award, $15,000 will be used for accounting staff salaries and benefits and the cost of a CPA while revising accounting systems for the CDFI and RHA, $25,000 for counsultant fees, $7,500 for legal and audit expenses, and $2,500 for the Town of Bayfield for administration costs in submitting and managing the grant. Consultants will implement a land development strategy to include a housing development loan fund and support program. The strategy will also involve information sharing to promote projects and involve develoment entities, including local non-profit agencies, under equitable smart growth policies.

Foreclosure assistance phone bank: Monday on Rocky Mountain PBS

A message from the Colorado Foreclosure Hotline:

On Monday, February 28th, between 4-6:30pm the Colorado Foreclosure Hotline and Rocky Mountain PBS will host the second phone bank alerting consumers on loan modification fraud.

This particular phone bank is designed to alert homeowners on the warning signs of loan modification fraud, assist homeowners who believe they have been a victim of loan modification fraud, and connect troubled homeowners with our HUD-approved housing counselors for free assistance.

Please encourage your clients or constituents to contact the RMPBS phone bank on Monday at 877-667-6727 where they have the ability to speak directly and immediately with a trained housing professional within our community.

Thank you for your assistance in spreading the word about this important campaign and thank you to all of those who have volunteered for the phone bank!

Thursday, February 24, 2011

Upcoming fair housing training from RCAC

see below for an upcoming training on fair housing from RCAC.

From RCAC:

Click here to register online: http://www.rcac.org/events.aspx?668

I am sending information I hope you will share for an upcoming training April 5,6,7th that we are doing in partnership with HUD Region VIII - Community Planning Department for all of Region VIII (CO,WY,MT, UT, SD, ND). The training will be held at the Historic Plains Hotel in Cheyenne, WY. If you live outside of Region VIII and want to take this important training, please register and we will advise if there is sufficient space to accommodate you. Please feel free to share this information with other agencies who are interested in this training.

The training will cover Section 3, Section 504, Fair Housing and Analysis to Impediments in depth. We expect when you have completed the training you will be able to go back to your programs and have the tools and information necessary to implement a viable plan.

Please sign up as soon as possible. You will note the block of hotel rooms offered at a special rate expires on March 11th , so please make your room reservations early. If you have questions, please feel free to contact me or Jennifer Siegel @ 303-455-7882.

You can register online at www.rcac.org/training and events or you can fax your registration in as directed. There is no charge to attend the training. Register early as space is somewhat limited. We look forward to seeing you there.

Connie Baker Wolfe
Regional Housing Manager
Rural Community Assistance Corporation (RCAC)
4251 Kipling Street, Suite 325
Wheat Ridge CO 80033
303-455-7882
303-455-7916
[email protected]


Click here to register online: http://www.rcac.org/events.aspx?668

Wednesday, February 23, 2011

New REALTOR data shows increase among modestly-prices homes

The National Association of REALTORS released its Janaury home sales data today. NAR does not provide data specific to the Denver, since Denver is not among the 19 local markets that NAR tracks.

NAR does provide some regional data for the west.

According to NAR:

Existing-home sales in the West rose 7.9 percent to an annual level of 1.37 million in January and are 7.0 percent above January 2010. The median price in the West was $193,200, down 5.7 percent from a year ago.


Nationally, home prices fared slightly better:

Single-family home sales rose 2.4 percent to a seasonally adjusted annual rate of 4.69 million in January from 4.58 million in December, and are 4.9 percent higher than the 4.47 million level in January 2010. The median existing single-family home price was $159,400 in January, down 2.7 percent from a year ago
.

Regionally, the most growth in sales activity was found among the homes with the lowest prices:


Locally, Luxury homes sales have been increasing, however, as reported here by John Rebchook.

Also, interestingly, this release comes a day after CoreLogic criticized NAR for inflating its sales numbers.

Tuesday, February 22, 2011

Single-family rental vacancies at all-time low of 2 percent

Click here for the full report.

Vacancies in for-rent condos, single-family homes, and other small properties across metro Denver fell 63 percent from the fourth quarter of 2009 to a new low of 2.0 percent during 2010’s fourth quarter. According to a report released Wednesday by the Colorado Division of Housing, the vacancy rate was 5.5 percent during the fourth quarter of 2009, and was 2.9 percent during the third quarter of 2010. The fourth quarter’s vacancy rate is the lowest metro-wide rate reported since the report was started in 2004.

The average number of days on the market for single-family rentals and similar properties fell from 53.9 days during the fourth quarter of 2009 to 38.2 days during the fourth quarter of 2010. The number of days on the market also fell from 2010’s third-quarter average of 36.0 days.

At the county level, the lowest vacancy rates were found in Douglas County and in the Boulder/Broomfield area. The vacancy rate was 0.9 percent in Douglas County, and there were no vacancies among the units surveyed in Boulder County.

The highest county-wide vacancy rate, found in Adams County, was 3.6 percent.

Vacancy rates for all counties surveyed were: Adams, 3.6 percent; Arapahoe, 1.3 percent; Boulder/Broomfield, 0.0 percent; Denver, 3.0 percent; Douglas, 0.9 percent; and Jefferson, 1.3 percent.

“Vacancies are certainly low and properties are renting up quickly,” said Susan Melton, owner of Assured Management in Lakewood. “In the past, the speed at which these homes rent up would tell us that the rent’s too low, but it turns out that it’s been difficult to push rents right now.”

Median rents were largely flat across the metro area in spite of declining vacancies.

The median rent for single-family and similar properties rose year-over-year to $975.00 during 2010’s fourth quarter, rising 1.0 percent from 2009’s fourth-quarter rate of $965.00. The fourth quarter’s median rent was down 2.0 percent from 2010’s third-quarter median rent of $995.00. Median rents are not adjusted for inflation.

“Part of the reason that it’s been hard to push rents is because new inventory continues to come into the market constantly,” Melton said. “We continue to see plenty of situations in which a homeowner has to move away, but decides that now is not a good time to sell. So, that property ends up being rented out and the inventory goes up, giving renters the opportunity to bargain hunt.”

Median rents for all counties were: Adams, $1135.00; Arapahoe, $920.00; Boulder/Broomfield, $1307.50; Denver, $900.00; Douglas, $1350.00; and Jefferson, $895.00.

Coming tomorrow: Single-family vacancy and rent data for Metro Denver

Be sure to check the blog tomorrow for 2010's 4th quarter information.

Building Permits in 2010 near 10-year lows

The total number of building permits issued in Colorado rose from 2009’s low, but permits remained at unusually low levels, with both single-family permits and multi-family permits well below totals reported earlier in the decade.

Single-family permits in 2010 rose 20.9 percent from 2009’s low of 7,484, increasing to 9,050. Nevertheless, 2010’s total is down 77.6 percent from 2005’s peak of 40,430 permits.

Multi-family permits also increased in 2010, rising 18.5 percent from 1,780 permits issued during 2009, to 2,110 issued during 2010. Multi-family permits most recently peaked in 2007 with 8,378 permits and the total number of permits issued in 2010 is down 74.8 percent below the 2007 peak.


As single-family building began to drop off in 2006 and 2007, multifamily began to pick up, but then sharply declined with the deepening of the recession in 2008.

The second chart shows the monthly totals for building permits issued since 1998.


There were 573 single-family permits issued during December 2010. The most active December in recent years for single-family permits was December 2005 when there were 2,780 permits.

There were 439 multi-family permits issued in December 2010. The most active December in recent years was December 2007 when 1,302 multi-family permits were issued.

In recent months, while single-family permits have continued to fall, multifamily permits have shown some signs of life with the largest number of December permits issued since December 2007.

Single-family permits, on the other hand, have dropped to levels not much above the low reached during January 2009 when only 392 single-family permits were issued.

Finally, for a more detailed look at multifamily permits, we can see in chart 3 that the overall volume of new permits being issues in multifamily continues to be quite low.

However, in the four months from September 2010 though December 2010, 1,227 multi-family permits were issued, which is only slightly fewer permits than were issued during the previous 12 months from August 2009 to August 2010, when 1,248 permits were issued.

During 2009 and 2010, there were some months in which almost no multi-family permits were issued in Colorado at all. Permits bottomed out in November 2009 when 5 multifamily permits were issued statewide.


In previous posts, we have discussed the repercussions of such a small amount of new construction in multi-family housing. [See this video. See page 2 of this.] Since permits are a helpful indicator of future construction, it stands to reason that new construction will continue to be at historic lows for the short term, which will in turn drive up rents and keep vacancy rates low.

Denver's Case-Shiller home price index declines for sixth month in a row

Case-Shiller’s home price index for the Denver area fell 0.7 percent from November to December, and fell 2.4 percent , year over year from December 2009 to December 2010.

According to the Case-Shiller report, released today by Standard and Poor's, and containing data up through December, 13 of the 20 metro areas measured by the report showed larger declines than the Denver area.

In year over year comparisons for December, Detroit showed the largest drop, with a decline of 9.1 percent, while the index in Atlanta fell 8.0 percent. The index rose the most in Washington, DC where it increased 4.1 percent, year over year. The index also rose 1.7 percent in San Francisco. Home price indices fell in 18 of the 20 cities included in the study.

The first chart shows trends in the Case-Shiller index for the Denver area and for the 20-city composite index. It is clear that Denver did not experience the kind of price bubble that occurred in many other metropolitan areas, and consequently, the index has not fallen nearly as far in Denver compared to the larger composite.


The 20-city composite is down 31 percent since it peaked in July 2006, but the Denver index is down only 11.5 percent from its August 2006 peak.

The second chart compares year-over-year changes in the Denver area index and in the 20-city composite. The Denver index did not achieve the rates of growth experienced by the national index, but the Denver index did not experience comparable rates of decline following the onset of the national recession either. Overall, the index has been less volatile in Denver than has been the case for the 20-city composite. Year-over-year growth in the 20-city composite during December was negative with a decrease of 2.4 percent. The Denver area index’s fall of 2.4 percent is the sixth month in a row in which the growth rate has been negative. In the 20-city index, on the other hand, the year-over-year change has only been negative for the most recent three months.


While Denver’s index has been largely stable, note that for the previous 24 months, only 8 months have shown a positive year-over-year change.

The last chart compares the actual index value for the Denver area with the year-over-year change. Note that for July through December, the change has fallen below zero, and likely reflects the end of the homebuyer tax credit’s end which has translated into a fall in demand and a decline in the home price index. The upward trend in the index in response to the tax credit is clear during late 2009 and early 2010.


Nationally, Case-Shiller has raised the possibility of a double dip in real estate prices as indices nationwide dip further and are nearing the same levels that were experienced during the trough of the market during late 2008 and early 2009.

Case-Shiller’s take on the most recent data:

We ended 2010 with a weak report. The National Index is down 4.1% from the fourth quarter of 2009 and 18 of 20 cities are down over the last 12 months. Both monthly Composites and the National Index are moving closer to their 2009 troughs. The National Index is within a percentage point of the low it set in the first quarter of 2009. Despite improvements in the overall economy, housing continues to drift lower and weaker.” says David M. Blitzer, Chairman of the Index Committee at Standard & Poor's. “Unlike the 2006 to 2009 period when all cities saw prices move together, we see some differing stories around the country. California is doing better with gains from their low points in Los Angeles, San Diego and San Francisco. At the other end is the Sun Belt - Las Vegas, Miami, Phoenix and Tampa. All four made new lows in December. Also seeing renewed weakness are some cities that were among the last to reach their peaks including Atlanta, Charlotte, Portland OR and Seattle, where news lows were also seen. Dallas, which peaked late, has so far stayed above its low marked in February 2009.

Friday, February 18, 2011

Notes on lending and banking conditions for Feb 2011

Multifamily rental housing in Colorado continues to tighten up in Colorado, as we've noted here. However, in the short term, there is little to indicate that much multifamily construction is one the way. As we've noted on this blog before, the number of new permits being pulled is at the lowest its been in more than a decade.

So what will be necessary for more construction? Industry experts tell us that multifamily owners will need to see several quarters, or even several years, of solid rent increases before financial institutions will begin to provide loans for multifamily construction. Rent growth has been weak in recent years, so multi-family owners now seem to be making up for lost time in terms of rent growth.

Another important factor is the fact that the banks remain risk averse in the face of a large number of non-performing loans. Low-interest rates also continue to encourage lending institutions to hold excess reserves.

In the charts below, we'll look at some of the indicators available to us through the FRED database at the Saint Louis Federal Reserve.

If banks continue to be reluctant to make loans on multifamily construction without evidence of solid returns on collected rents, it isn't difficult to see why.

Chart one shows the ratio of non-performing loans among larger banks in the mountain region. The ratio of non performing loans is at a new high, and has surpassed the ratio from the days of the Savings and Loan crises.

[Note: Percentage of nonperforming loans equals total nonperforming loans divided by total loans. Nonperforming loans are those loans that bank managers classify as 90-days or more past due or nonaccrual in the call report.]

The data below on non-performing loans runs through September 2010.


Graph 2 shows the same ratio, except this time it's for smaller-sized banks, also within the mountain region. We can see that the ratio has reached slightly higher than is the case with the larger banks, although the current ratio does not much exceed that reached during the S&L; crisis. Not unexpectedly, the data suggests that, at least according to this measure, proportionally speaking, smaller banks have been more heavily impacted by nonperforming loans in recent years.


Graphs 1 and 2 show all loans, but Graph 3, which shows commercial loans only, shows that the overall ratio of nonperforming loans is lower for commercial loans than for all loans. This suggests that residential mortgage loans (and also consumer debt) are performing more poorly than commercial loans. This is also for the mountain region. The fact that commercial loans may be slightly more resilient than other types of loans may also lead to more willingness to make loans on multifamily construction than on single-family for-sale construction in the near term and medium term. However, while commercial loans are relatively better-performing, the non-performing loan ration does remain at unusually high rates.


Graph 4 shows the outcome of a situation in which loans on residential real estate have been performing poorly. Data for the mountain region only is not available, but this national graph shows that the amount of funds being loaned for real estate is down considerably. This can include non-residential real estate of course, but the graph does suggest that in the current environment, banks will continue to be cautious in making loans for new real estate.


Finally, in Graph 5, we note an additional consequence of a lending environment affected by low interest rates and poorly-performing loans. This is national data:

Thursday, February 17, 2011

New foreclosure filings in Colorado fall to eight-month low

Click here for the full report.

Foreclosure sales at auction dropped to an eight-month low in Colorado’s metropolitan counties during January. According to a report released today by the Colorado Division of Housing, foreclosure filings in Colorado’s metropolitan counties were down 1.1 percent from January 2010 to January of this year. Total filings in January fell from 2,729 to 2,699, year over year.

Foreclosure sales at auction also fell with total sales dropping 21.8 percent from 1,917 sales in January 2010 to 1,499 sales in January of this year.

From December 2010 to January 2011, foreclosure filings fell 6.7 percent, and foreclosure sales at auction rose 11.7 percent.

Foreclosure filings are now at the lowest monthly total reported since June 2010. Foreclosure sales at auction, while down from January 2010, increased for the second month in a row as lenders sped up the processing of foreclosures. Sales increased following last October’s “slowdown” initiated by some lenders in response to the “robo-signing” controversy that caused some mortgage companies to suspend the processing of foreclosures.


Foreclosure filings are the initial filing that begins the foreclosure process, and foreclosure sales totals are the total number of foreclosures that have been sold at auction at the end of the foreclosure process.

The counties with the largest decreases in foreclosure filings from January 2010 to January 2011 were Boulder County and Mesa County, where filings decreased by 29.9 percent and 18.6 percent, respectively. Douglas County reported the largest rise in new filings with an increase of 68.8 percent, year over year.

Year over year, all counties showed decreases in January’s foreclosure sales at auction except Douglas County and Mesa County. From January 2010 to January 2011, foreclosure sales rose 2.4 percent and 12.9 percent in Douglas County and Mesa County, respectively. In all other counties measured during the same period, sales fell 18 percent or more.

The county with the highest rate of foreclosure sales was Weld County with a rate of 690 households per foreclosure sale. Mesa County came in second with 702 households per foreclosure sale. The lowest rate was found in Broomfield County where there were 6,450 households per foreclosure sale.

The Division of Housing’s monthly foreclosure report surveys foreclosure activity in the twelve largest counties of Colorado. The report is a supplement to the Division’s quarterly foreclosure report that includes all counties in Colorado.

Colorado has 14th-smallest foreclosure inventory in US

[See here for more 4th Q 2010 delinquency survey analysis - "Colorado continues to improve faster than nation with decline in mortgage delinquencies"]

The percentage of Colorado mortgage loans in foreclosure fell to 2.53 percent during the fourth quarter of 2010, falling from 2009’s fourth-quarter rate of 2.81 percent. According to a report released today by the Mortgage Bankers Association, however, in spite of recent year-over-year declines in the foreclosure inventory, the proportion of Colorado mortgage loans in foreclosure rose this year from the third quarter to the fourth quarter, increasing from 2.4 percent to 2.53 percent.

The increase in foreclosure inventory from the third quarter to the fourth was also experienced nationally.

Compared to the proportion of loans in foreclosure for all states, Colorado’s totals are lower than national percentages. Nationally, 4.63 percent of loans nationwide were in a state of foreclose during the fourth quarter of 2010. Year-over-year trends are up nationally with 2010’s fourth-quarter percentage being an increase from the fourth quarter of 2009 when the total percentage of loans in foreclosure was 4.58. Nationally, foreclosing loans also rose from the third quarter to the fourth quarter of 2010 with an increase from 4.39 percent to 4.63 percent.


Only 13 states reported a smaller percentage of loans in foreclosure than Colorado. North Dakota reported the smallest percentage of foreclosing mortgages with 1.11 percent. Alaska placed slightly behind North Dakota with 1.13 percent of loans in foreclosure.

States reporting the highest percentages of loans in foreclosure included Nevada and Florida with percentages of 10.06 percent and 14.18 percent, respectively.

Short-term delinquencies dropped in both Colorado and nationally from the fourth quarter of last year to the fourth quarter this year. In Colorado, 30-day delinquencies fell from 2.64 percent to 2.44 percent, year over year, while nationwide, they fell from 3.63 percent to 3.49 percent during the same period.


Nationwide, the percentage of loans in foreclosure during the third quarter has outpaced Colorado since 2008. Prior to 2008, Colorado reported a larger percentage of foreclosing loans than was the case nationally, but since 2008, the percentage of foreclosing loans has grown more nationally than in Colorado each year. From the third quarter of last year to the third quarter of this year, the foreclosure inventory shrank faster in Colorado than nationally.

Colorado has repeatedly fallen in state-by-state comparisons in recent years. In 2007, for example, Colorado was often found to be in the top 15 states for foreclosures. Colorado has since dropped to 36th place.

This has also been the case in 30-day delinquencies and in the total combined percentage of loans that are in foreclosure or are 90-days delinquent.

Prior to 2008, Colorado experienced a large amount of foreclosure and delinquency activity before the rest of the nation making it one of the top states in the nation for foreclosures. Since 2008, other states like Nevada, California and Florida have outpaced Colorado and have moved national percentages above Colorado’s.

Colorado continues to improve faster than nation with decline in mortgage delinquencies

[See here for more 4th Q 2010 analysis - "Colorado has 14th-smallest foreclosure inventory in US"

The National Mortgage Bankers Association released its 2010 fourth quarter data today, and MBA's economist essentially declared that nationally, the bottom had been reached in mortgage delinquencies:

Jay Brinkmann, MBA’s chief economist said “These latest delinquency numbers represent significant, across the board decreases in mortgage delinquency rates in the US. Total delinquencies, which exclude loans in the process in foreclosure, are now at their lowest level since the end of 2008. Mortgages only one payment past due are now at the lowest level since the end of 2007, the very beginning of the recession. Perhaps most importantly, loans three payments (90 days) or more past due have fallen from an all-time high delinquency rate of 5.02 percent at the end of the first quarter of 2010 to 3.63 percent at the end of the fourth quarter of 2010, a drop of 139 basis points or almost 28% over the course of the year. Every state but two saw a drop in the 90-plus day delinquency rate and the two increases were negligible. ”

“While delinquency and foreclosure rates are still well above historical norms, we have clearly turned the corner. Despite continued high levels of unemployment, the economy did add over 1.2 million private sector jobs during 2010 and, after remaining stubbornly high during the first half of 2010, first time claims for unemployment insurance fell during the second half of the year. Absent a significant economic reversal, the delinquency picture should continue to improve during 2011,” Brinkmann said.


In analyzing this data, we can also note that Colorado continues to improve faster than the nation with its delinquency rate. In numerous comparisons with the national rate, Colorado's delinquencies and foreclosure inventory rates continue to remain well below national rates, and have improved more.

Here I have plotted out the percentages for 30-day delinquencies for each quarter. Note that for the United States, the 30-day delinquency rate for the 2010's fourth quarter has fallen 9.4 percent from the peak reached during the third quarter of 2008. In Colorado, the situation has improved even more, with 30-day delinquencies now down 12.2 percent from the peak reached during the third quarter of 2009.


Interestingly, the 30-day delinquency rat peaks during the third or fourth quarter of each year in recent years. In Colorado in 2010, the rate peaked during the 3rd quarter at 2.55 percent, but fell to 2.44 percent during the fourth quarter, making the fourth quarter the lowest 30-day delinquency rate in three quarters.

In the second chart, we see also see continued declines in the percentage of loans that are either in foreclosure or are 90 days delinquent. Nationally, these loans are now down 11.4 percent from the peak reached during the fourth quarter of 2009. Colorado also improved more than the nation in this measure as these loans have dropped 15.7 percent from their own peak which was also reached during the fourth quarter of 2009.


We see in the third chart, however, that among loans that are either in foreclosure or 90-days delinquent, the downward trend for 2010's fourth quarter was being driven by a drop in 90 day delinquencies. We know this because if we pull out just the loans that are in the foreclosure inventory, the percentage actually increased both nationally and in Colorado from the third quarter to the fourth quarter.

We can conclude that although fresh delinquencies have been declining in recent months, the size of the foreclosure inventory has not decreased as a similar pace. This may be due to the "slowdown" in the processing of foreclosures that was put in place in October by some mortgage companies in response to the "robo-signing" controversy. If fewer foreclosures were being processed through the system and sold at auction, this may have led to an increase in the total amount of loans sitting in the foreclosure process. In other words, even if the rate of new delinquencies was declining, if fewer loans were exiting the process due to the slowdown, this could lead to an increase in total inventory. Nevertheless, the foreclosure inventory in Colorado is still down 9.9 percent from the peak reached during the fourth quarter of 2009. On the other hand, the national foreclosure inventory has hit a new high and is now 1.1 percent above the former peak reached during the first quarter of 2010.

Recent articles of interest

Apartment vacancy rates fall sharply in region (02/17/2011)
Loveland had one of the lowest vacancy rates in the state at 3.6 percent, followed by Fort Collins at 4.2 percent. Greeley had a vacancy rate of 5.1 percent, while Colorado Springs had a 7.2 percent vacancy rate and Grand Junction had a 7.5 percent vacancy rate.

The Denver metro area reported a 5.5 percent vacancy rate and Pueblo had a 10.2 percent rate.

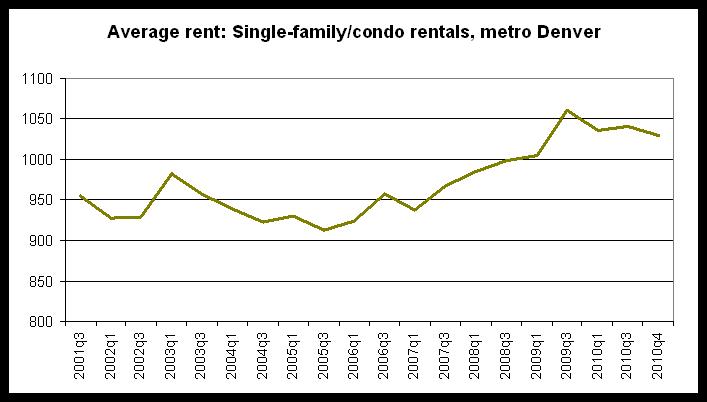
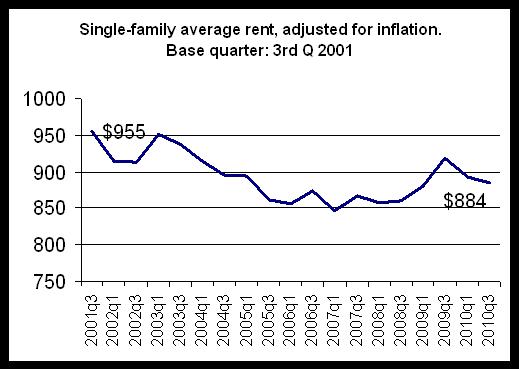
Apartment vacancies fell year-over-year across all six metropolitan areas the state measures. Despite falling vacancies, the report noted that median rents "showed limited growth across the state" in the fourth quarter.

Go to article (Northern Colorado Business Report )

Apartment vacancies in Colorado cities down in Q4 Read more: Apartment vacancies in Colorado cities (02/16/2011)
Apartment vacancies in Colorado urban areas other than Denver fell in the fourth quarter of 2010 from the same period of 2009, according to a report Tuesday from the Colorado Division of Housing that echoed an earlier report on metro Denver.
Tuesday’s report, by University of Denver professor Gordon Von Stroh, said apartment vacancies fell year over year in all six urban areas covered by the apartment survey: Fort Collins, Loveland, Greeley, Grand Junction, Colorado Springs and Pueblo.


Go to article (Denver Business Journal )


Loveland, Fort Collins vacancy rates at 10-year lows (02/16/2011)
During the last three months of 2010, the vacancy rate fell 35 percent in Fort Collins/Loveland to 4.1 percent. The median rent increased 6.2 percent year over year from $821.29 to $872.83 in the fourth quarter.

In real terms, it means there were only 831 available apartments in Fort Collins and Loveland out of almost 20,000 units.
Go to article (Ft Collins Coloradoan )


Vacancies fall for apartments across state (02/16/2011)
Apartment vacancies fell sharply across the state and rents ticked higher during the fourth quarter despite a weak job market, according to a report Tuesday from the Colorado Division of Housing.
Vacancies fell year-over- year in Fort Collins, Loveland, Greeley, Grand Junction and Colorado Springs.

Go to article (Denver Post )

Affordable housing overwhelmed (02/14/2011)
Record growth in the number of low-income Americans who now pay more than half their monthly income for rent — a 20 percent increase described in a federal report delivered last week to Congress — is mirrored in the daily realities of communities across Colorado.
It's evident in places like Jefferson County, where about 18,000 people live on incomes of $20,000 or less.
According to federal guidelines, affordable rental housing at that income level is about $480 in monthly rent, and "there are no rental units in this county for that amount," said Linda Barringer, program director for housing and family services at The Family Tree in Wheat Ridge.

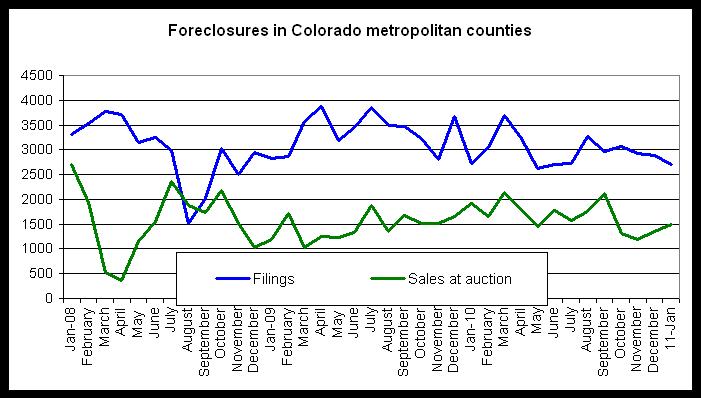
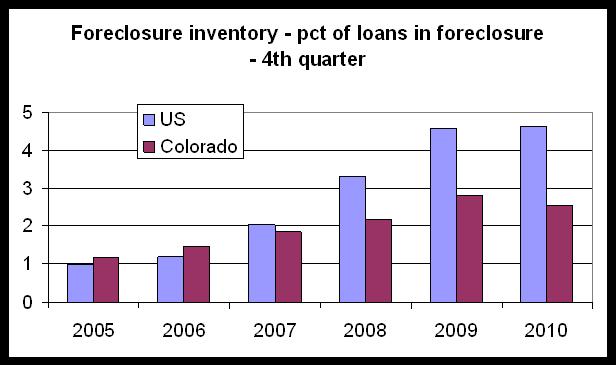
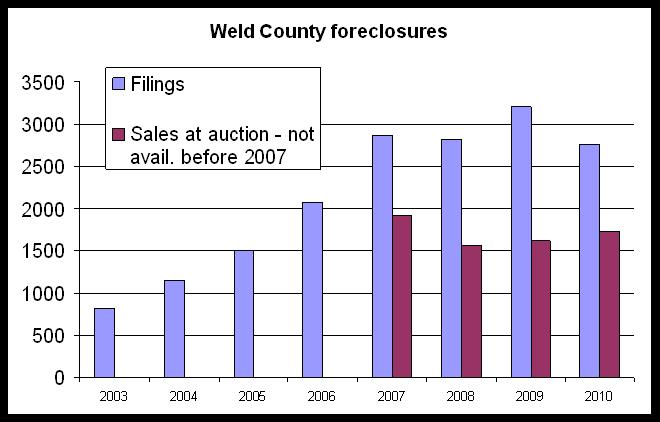
Go to article (Denver Post)


Weld’s foreclosure filings show signs of stabilizing (02/14/2011)
Weld County’s rate of new foreclosure filings and sales at auction continues to stabilize, according to fourth-quarter and year-end data from the Colorado Division of Housing.

Weld’s new filings in the fourth quarter totaled 676, up 8 percent from the 626 in the third quarter. Sales at auction totaled 344 in the last quarter of 2010, down 19.2 percent from 426 in the third quarter. For Colorado, filings increased 1.4 percent in the quarter while sales plummeted 29.2 percent.

“We’re still very, very cautious” about the slowing of foreclosure activity, said Ryan McMaken, spokesman for the housing division.

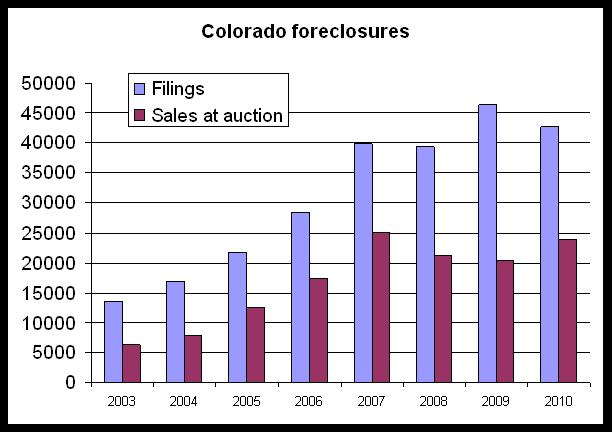
Go to article (Greeley Tribune)


Colo. foreclosures decline in 2010; Boulder County posts lowest rate in metro area (02/11/2011)
Fewer Colorado residents filed for foreclosure last year than in 2009, but state housing officials caution that it's too soon to tell whether a turnaround has taken hold.

The number of foreclosure filings in 2010 fell 8 percent to 46,394, according to a report from the Colorado Division of Housing. Sales of foreclosure properties at auction rose 16.9 percent -- an increase housing officials say was expected because of the record number of Colorado homeowners who defaulted on their mortgages during the past two years.

"It could be that we've moved through that inventory and that sales will actually start to move down," said Ryan McMaken, a Colorado Division of Housing spokesman. "Will 2011 be a year of recovery? I don't know yet."

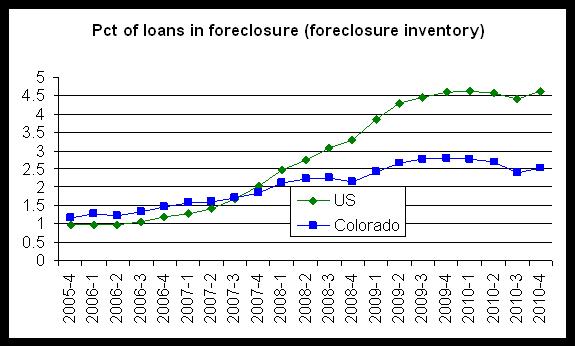
Go to article (Boulder Daily Camera)

Colorado foreclosure activity slows in fourth quarter (02/11/2011)
Foreclosure activity slowed in Colorado during the fourth quarter, remaining at high but not record levels for 2010, according to a report Thursday from the Colorado Division of Housing.
"We saw a fairly significant drop-off in foreclosure sales," said Ryan McMaken, who compiled the data from public trustees and county treasurers.

Go to article (Denver Post )

Foreclosure woes hit hard in Teller County (02/11/2011)
Many homeowners who moved to scenic Teller County to escape city life couldn’t escape foreclosure woes last year.

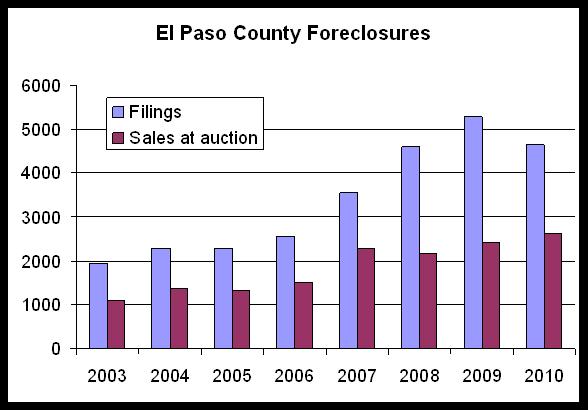
Teller County, west of Colorado Springs, had one completed foreclosure for every 48.4 households in 2010 — the sixth worst rate among the state’s 64 counties, according to a report released Thursday by the Colorado Division of Housing.

A completed foreclosure refers to a home or property that went through the state’s foreclosure process and was sold to a lender or a third-party investor.

Go to article (Colorado Springs Gazette)

Housing Division: Colorado foreclosure filings drop in Q4, 2010 Read more: Housing Division: Colora (02/11/2011)
Foreclosure filings for Colorado in 2010’s fourth quarter were down 4.8 percent from the same period of 2009, indicating some recovery in the state’s real estate market, but continuing challenges because of unemployment, according to a Colorado Division of Housing report released Thursday.
Filings, which are the beginning of the foreclosure process in this state, dropped to 10,736 in last year’s final period from 11,282 year over year.

Go to article (Denver Business Journal )

Larimer County reports slowdown in foreclosure filings, sales (02/11/2011)
Larimer County outpaced the state of Colorado in slowing the trend of foreclosure filings and sales in the last three months of 2010, showing some resiliency even as the unemployment rate continues to rise.

The number of homes entering the foreclosure process and those homes sold at foreclosure auction both dropped in Larimer County at the end of the year, according to a new report issued by the Colorado Division of Housing.

Go to article (Ft Collins Coloradoan )

Tuesday, February 15, 2011

Colorado apartment vacancies fall, rents rise

Click here for full report

Apartment vacancies fell across Colorado as rents rose during the fourth quarter of 2010, signaling a surprising amount of growth in demand for housing in spite of limited wage and job growth. According to a report released today by the Colorado Division of Housing, from the fourth quarter of 2009 to the fourth quarter of 2010, vacancies fell year-over-year in all six metropolitan areas of the state measured by the survey, including Fort Collins, Loveland, Greeley, Grand Junction and Colorado Springs.

The largest drop in the vacancy rate was found in Grand Junction where, year-over-year, the rate fell 43 percent from 13.2 percent to 7.5 percent. During the same period, the vacancy rate fell 30 percent in Greeley and 35 percent in the Fort Collins/Loveland area.

The metro Denver vacancy rate, reported last month in a separate survey, also fell year-over-year from 7.7 percent to 5.5 percent during the fourth quarter.

“The Denver area and northern Colorado have some of the tightest markets right now, said Ryan McMaken, a spokesman for the Division of Housing. “It’s not surprising that Fort Collins, which has one of the strongest job markets, also has some of the lowest vacancy rates.”

Vacancy rates in all metropolitan areas were Colorado Springs, 7.2 percent; Ft. Collins/Loveland, 4.1 percent; Grand Junction, 7.5 percent; Greeley, 5.1 percent; Pueblo, 10.2 percent.

In spite of falling vacancies, median rents showed limited growth across the state for the fourth quarter. The Fort Collins/Loveland area was the only area showing substantial increases in median rents. In the Fort Collins/Loveland region overall, the median rent increased 6.2 percent year-over-year from $821.29 to $872.83 during the fourth quarter. In Loveland, the median rents rose 22 percent from $751.00 to $916.45 during the same period. In all other metro areas, the median rent either fell or rose by less than 2 percent. In Greeley, the average rent fell 0.4 percent from $619.58 to $616.79, year-over-year. The median rent also fell 0.6 percent in Grand Junction.

“We’ve still only seen significant rent increases in certain areas of the state,” said Gordon Von Stroh, a professor of business at the University of Denver, and the report author. “But I do expect to see rent growth become more common and more widespread as time goes on.”

Median rents in all metropolitan areas measured were Colorado Springs, $711.12, Ft. Collins/Loveland, $872.83; Grand Junction, $637.37; Greeley, $616.79; Pueblo, $483.14.

The metro Denver median rent, measured in a separate survey, was $846.36 for the fourth quarter.

Friday, February 11, 2011

State of Colorado Neighborhood Stabilization Program III: NSP3 Public Notice

State of Colorado Neighborhood Stabilization Program III: NSP3 Public Notice
The Substantial Amendment to the Neighborhood Stabilization Program III (NSP3) Action Plan will be submitted to the U.S. Department of Housing and Urban Development (HUD), Region VIII on February 28, 2011, following a 15-day public comment period. The plan will be available in English and Spanish on the internet February 11, 2011 at http://dola.colorado.gov/cdh/NSP3SubstantialAmend.htm.


PUBLIC NOTICE AND NOTICE OF PUBLIC HEARING: Neighborhood Stabilization Program III: NSP3

The full text of the Public Hearing Notice follows:
The Substantial Amendment to the Neighborhood Stabilization Program III (NSP3) Action Plan will be submitted to the U.S. Department of Housing and Urban Development (HUD), Region VIII on February 28, 2011, following a 15-day public comment period. The Plan is required under the Dodd-Frank Wall Street Reform and Consumer Protection Act (2010) in order to receive $6,518,947 in Federal funds from the program. A Continuation of Intergovernmental Joint Cooperation Agreement has been executed to combine into one grant the following entitlements:

State of Colorado: $5,098,309
City of Colorado Springs: $1,420,638

The Action Plan is available for public comment Friday, February 11 through Friday, February 25, 2011. The proposed plan is linked below, in English and Spanish.

A public hearing has been scheduled by the Colorado Department of Local Affairs for the Action Plan document. The hearing will be held on Thursday, February 24, 2011 in Denver, 1313 Sherman St., Room 318 Conference Room at 9:00 a.m. The plan will be available for review on the internet February 11, 2011 at http://dola.colorado.gov/cdh/NSP3SubstantialAmend.htm. A copy of the complete document to be submitted to HUD will also be available for public review during regular office hours from February 11, 2011 through Friday, February 25, 2011 at the following Department of Local Affairs regional offices.


Northeastern area office,
Fort Morgan, (970) 867-4961

Southeastern area office,
Pueblo, (719) 544‑6577

Northwestern office,
Grand Junction, (970) 248‑7310

Southwestern office,
Durango, (970) 247‑7311

Northern Mountains office,
Silverthorne, (970) 668-6160

South Central office,
Alamosa, (719) 589‑2251

North Central office,
Loveland, (970) 679‑4501

Central office, field offices.
Golden, (303) 273‑1787

If special accommodations are needed, please call Alison O’Kelly at (303) 866-3409 for the public meeting. The Department of Local Affairs TDD Number is (303) 866-5300.

Written comments must be received by February 25, 2011, at the Colorado Division of Housing, 1313 Sherman Street, Room 500, Denver CO, 80203, ATTN: Alison O’Kelly. To submit comments via E-mail, please send to Alison O’Kelly at [email protected].

December foreclosure totals for metro counties now available

Yesterday we posted the fourth quarter 2010 foreclosure totals for all Colorado counties. Click here for the monthly totals, plus graphs of movements in monthly totals for metro counties.

A selection:

Findings

Comparing year-over-year from 2009 to 2010, foreclosure filings in December decreased 21.3 percent with totals falling from 3,674 to 2,893.

December 2010 foreclosure sales (completed foreclosures) were down compared to December 2009 with a decrease of 19.2 percent from 1,661 to 1,342.

Year-to-date (January through December) this year, foreclosure filings increased 9.6 percent compared to the same period last year, and foreclosure sales increased 5.6 percent.

Foreclosure filings increased slightly from November to December with filings falling 1.3 percent, while foreclosure sales at auction rose 12.3 percent during the same period.


Full report here.

Regional analysis of recent foreclosure totals

I've made some regional comparisons of foreclosure totals since 2003 based on Division of Housing and Public Trustee Association data:

The first graph shows Colorado as a whole. Note that following 2007, Colorado began to decline in both filings and sales. This was at least partly due to a significant increase in the amount of foreclosure prevention activity going on in Colorado. Note also that the initial build-up in foreclosures from 2003-2007 is all pre-recession. Layoffs did not become a significant factor in Colorado's economy until 2008.


By the end of 2008, however, layoffs were an increasing factor, and by 2009, the number of foreclosure filings was pushed up. Then, in 2010, the number of foreclosure sales increased as the expected response to a large number of new filings. In other words, Colorado is still dealing with the large number of foreclosures that entered the pipeline in 2009 due to layoffs.

The area that has shown the most improvement as a region is the core of the metro Denver area. Note in chart 2 that in Adams/Arapahoe/Denver, totals have never topped the initial 2007 peak.


Graphs 3 and 4 show the behavior of foreclosures in Weld County and El Paso County. Neither have seen the sorts of slow improvement enjoyed in the metro Denver core.


We do find a noticable difference in the trends when we look to the Western Slope and to the rural resort counties. I've put together Grand, Eagle, Summit and Garfield Counties to get a sense of the trend in counties that traditionally have been connected to rural resort economies. Foreclosures in these counties are up considerably since 2008. In fact, foreclosure sales in the rural resort sample are up 401 percent since 2008, and filings are up 182 percent since 2008.


In the final chart, we see Mesa County which has also seen a lot of growth in foreclosures since the recession set in there in 2008. Much of this was due to job losses from a drop in oil and gas activity in 2008. Foreclosure sales are up 860 percent since 2008, and filings are up 278 percent since 2008.

Thursday, February 10, 2011

Fewer new foreclosures filed in 2010, but more foreclosures going to auction

Fewer new foreclosures filed in 2010, but more foreclosures going to auction

Click here for full report.

New foreclosure filings fell to 10,736 in Colorado during 2010’s fourth quarter, falling 4.8 percent from 2009’s fourth-quarter total of 11,282. According to a report released Thursday by the Colorado Division of Housing, foreclosure sales at auction, the event that completes the foreclosure process, also dropped during the fourth quarter, falling from 5,466 to 4,691 year-over-year for the fourth quarter.

2010 year-end totals for new foreclosure filings also fell, with filings falling 8.0 percent. There were 46,394 filings in 2009 and 42,692 filings in 2010. Year-end totals for foreclosure sales at auction, on the other hand, increased 16.9 percent from 20,437 during 2009 to 23,891 during 2010.

2010’s filings total is the second-largest ever recorded, coming in behind 2009’s record total of 46,394. Foreclosure filings surged in 2009 in response to recession-driven layoffs in late 2008 and early 2009.

Foreclosure sales at auction, however, peaked during 2007 at 25,054 sales. Sales totals then fell in 2008 and 2009, but surged again in 2010.

Although 2010 foreclosure totals were at near record highs, the report also noted that new foreclosure filings have been largely declining over the past eighteen months. According to the report, “[r]ecently-collected quarterly and monthly totals indicate that foreclosure filings continue to fall from peak levels, and 2010’s fourth-quarter total for foreclosure filings remains 14 percent below 2009’s third-quarter peak.”

While some regions of Colorado saw some improvement in 2010, some areas continued to experience continued growth in foreclosures. All Front Range metropolitan counties reported drops in foreclosure filings in 2010. From 2009 to 2010, Adams County filings fell 13.4 percent while Denver County filings fell 17.7 percent. Foreclosure filings in Pueblo County fell 11.9 percent during the same period. In Mesa County, the most populous county on the Western Slope, foreclosure filings increased 29.6 percent from 2009 to 2010, while filings in Garfield County and La Plata County increased 64 percent and 9.3 percent, respectively.

At the same time, all Front Range metropolitan counties except Denver County reported year-over-year increases in foreclosure sales at auction. Comparing 2009 to 2010, sales rose 4.3 percent and 13.1 percent in Adams County and Arapahoe County, respectively, and fell 7.3 percent in Denver County. During the same period, sales rose 173.0 percent in Mesa County and rose 36 percent in La Plata County.

Foreclosure sales are opened foreclosures that have proceeded through the full foreclosure process to final sale at public auction. Filings denote the beginning of the foreclosure process, and once a foreclosure is filed, the borrower has at least 110-120 days to work with the lender to avoid a completed foreclosure. It is during this period that borrowers work with lenders and housing counselors to work out loan modifications, short sales, or other ways of withdrawing the foreclosure.

The full report is available on the Division of Housing blog: http://divisionofhousing.blogspot.com/

# # #

Friday, February 4, 2011

Weld County receives $340,000

The Department of Local Affairs has announced that $340,000.00 in HOME Investment Partnerships Program (HOME) funds has been awarded to Weld County for the following project:

Accessible Space, Inc. (ASI) has been awarded a HOME grant of $340,000 to assist in the new construction of seventeen (17) units of affordable, accessible rental housing in Greeley, Weld County, with the following unit mix: fourteen (14) one bedroom units and three (3) two bedroom units. Sixteen (16) of the units are for households at 50% AMI or less. One unit will be non-income restricted for the Resident Manager. This project will utilize HUD 811 Capital Advance funding for income-eligible individuals with disabilities (i.e. mobility impairments and/or selfcare limitations) and includes rental assistance for the sixteen (16) affordable units, thus allowing residents to pay no more than 30% of their adjusted gross income for rent. Accessible Space, Inc. will manage and complete the construction of this project and will also provide all resident services for the households.

2010 Year-end Housing Snapshot

At four pages, the Housing Snapshot is a very concise summary of recent housing trends. It's published 6 times a year to provide a quick snapshot of housing trends in Colorado for the non-expert.

Click here for the latest issue.

Wednesday, February 2, 2011

New video: The effects of the end of the homebuyer tax credit

[Okay, so the Charts of the Week haven't exactly been "of the week" lately, but they'll now begin appearing more frequently again.]

This week's video looks at how single-family home sales have fared since the end of the homebuyer tax credit. The number of homes sold in the second half of 2010 were at historic lows as the number of buyers fell off significantly following the end of the tax credit.