Colorado urban foreclosure sales at 19-month low (11/23/2010)
Foreclosure sales at auction in Colorado’s largest counties fell to a 19-month low in October as the mortgage industry slowed down action on foreclosures, the state Division of Housing reported Monday.
Foreclosure sales in Colorado’s 12 urban counties totaled 1,308 in October, a decline of 38 percent from September’s total of 2,111 and down 13.8 percent from October 2009’s tally of 1,518, the report said.
Foreclosure dropping across Colorado (11/23/2010)
Those are both signs the Larimer County economy is bumping along, improving slowly.
Foreclosure sales statewide dropped to a 19-month low in the state's metropolitan counties, including Larimer and Weld, during October, making October's sales total the smallest since March 2009, according to a report released Monday by the Colorado Division of Housing.
For the first 10 months of the year, filings are down 16.2 percent while sales are up 17.2 percent, a sign that foreclosed homes are coming off the inventory
Region's foreclosure filings, sales fall in October
DENVER - Weld, Larimer and Denver counties have had the biggest decreases in foreclosure filings in the state through October, according to a report by the Department of Local Affairs' Division of Housing.
Weld County's foreclosure filings through October were down 17.3 percent over the same period in 2009, while Larimer County's filings were down by 16.2 percent. Denver County's filings were down by 17.9 percent.
Weld County starts to dig out of slump with a bit of foreclosure relief
Greeley and Weld County, battered with high foreclosure rates during the recession, finally got a dose of good news in third-quarter numbers from the Colorado Division of Housing.
Weld posted declines in both filings and foreclosure sales in the July-through-September statistics, bucking recent trends.
Weld posted 626 foreclosure filings in this year's third quarter compared to 905 in the year-ago period, a drop of 30.8 percent. The county had 685 filings in the second quarter, a 23.4 percent drop from 894 in the year-ago period.
Weld had 426 completed sales in the third quarter compared to 459 in the year-ago period, a 7.2 percent decrease. All of the state's other major counties had increases in year-over-year sales for the quarter.
“It's definitely needed in Weld County,” McMaken said of the latest numbers, “because they've gone on longer than other counties in terms of growing (rates) quarter over quarter over time.”
Tuesday, November 30, 2010
October new home sales fall in the West, US
New single-family home sales fell again in the US and in the “West” region which includes Colorado, according to a new report released by the Census Bureau.
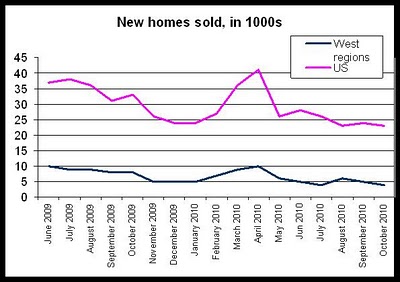
The report, which monitors sales activity for newly constructed houses, reported that in the West, new home sales fell 50 percent, year over year, falling from 8,000 in October 2009 to 4,000 in October 2010, while nationwide, sales dropped off 30 percent falling from 33,000 to 23,000 during the same period.
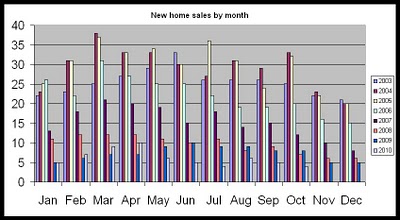
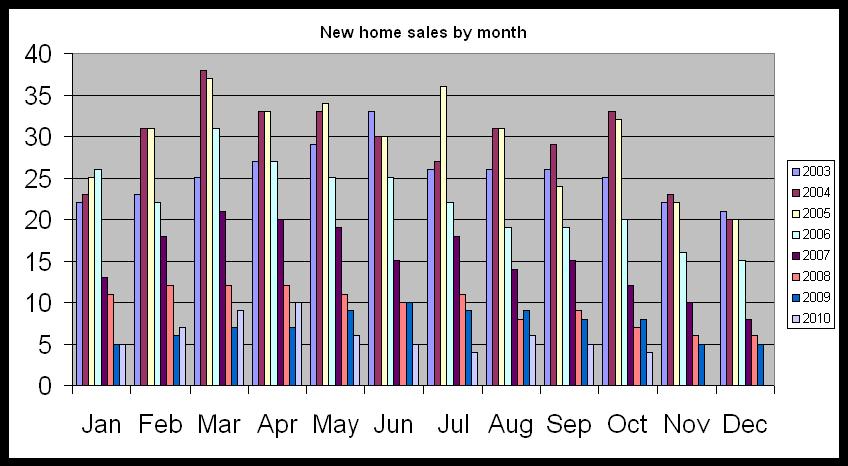
In October, new home sales, tied for the lowest volume in at least a decade. The first chart shows monthly new home sales totals for each month since 2003. October’s total of 4,000 new homes sold tied with July 2010, and is the lowest total since at least the year 2000.
The chart shows that May, June, July, August and September of this year all set new lows in the total number of new homes sold for each month.
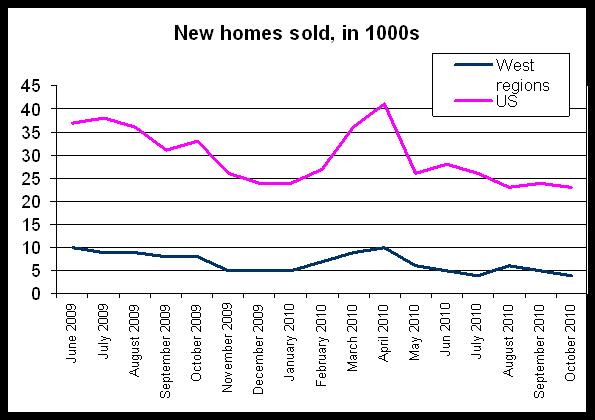
The drop off in home sales is likely tied to the end of the new home buyer tax credit which expired in April. The second chart shows that in both the West and in the US, new home sales were pushed up by the tax credit, and then fell quickly after April 2010.
New home sales and new home inventory continue to fall and have generally followed a downward trend since the middle of the decade.
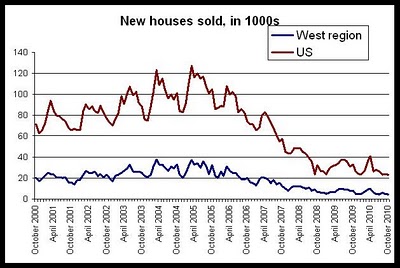
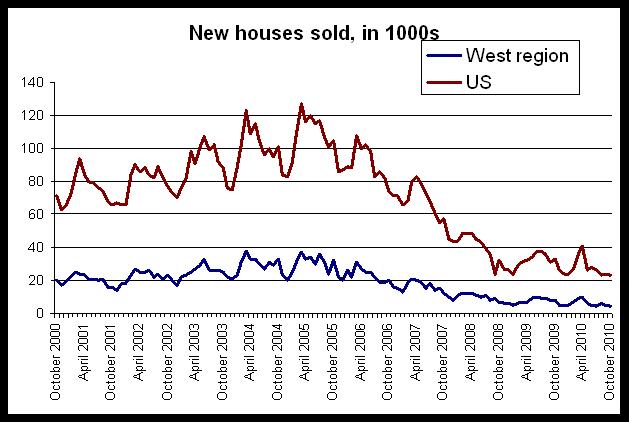
New home sales peaked during the spring and summer of 2005 and have trended downward since. The number of new houses sold in the United States is down 81.8 percent since the peak of March 2005, and new home sales in the West have fallen 89.4 percent since sales peaked in the region during March 2004.
The third chart shows the declines in both US and regional new home sales.
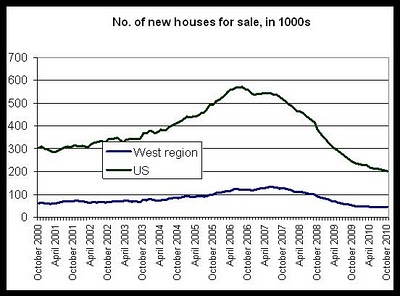
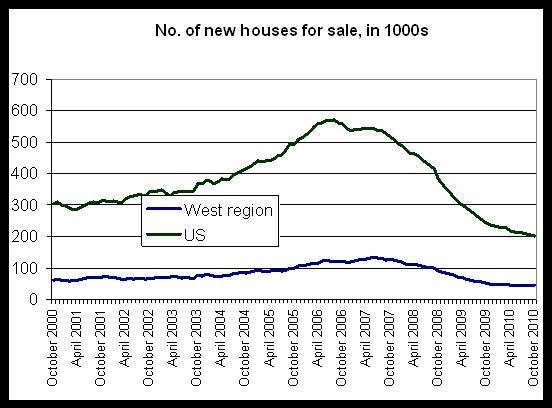
The number of new home sales has also fallen off considerably. The number of new houses for sale in the West has fallen 66.4 percent since the total peaked during June 2007, and the same total has fallen 64.9 percent in the US since the number of new homes for sale peaked in the US during August 2006.
The number of homes for sale grew more quickly in the West than in the US, with growth in the West topping 119.6 percent from January 2001 to June 2007, and the total grew 92.2 percent from January 2001 to August 2006. The fourth chart shows the rise of new homes for sale.
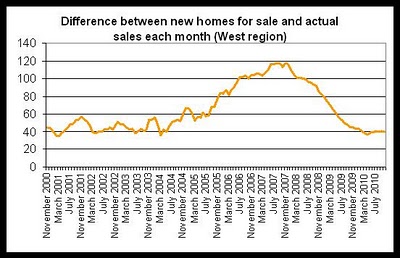
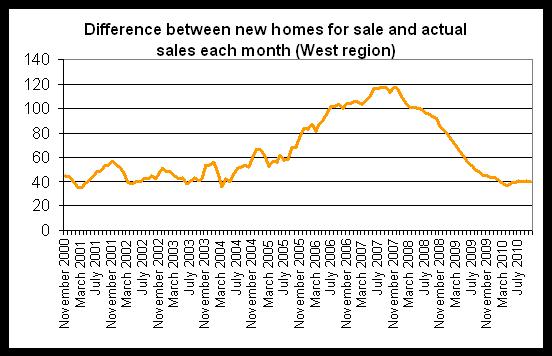
The fifth chart shows the difference between the number of homes in the region for sale at the beginning of a month vs. the number of homes sold during that month. Interestingly, the build up in inventory can be seen as it grows from 2004 to 2007. Historically, it appears that the a “normal” difference between new homes for sale and new homes sold is somewhere between 40,000 and 50,000 homes in the region. This total reaches almost 120,000 homes during the peak months, and has now fallen to approximately 40,000 homes, where the total has remained for the past year. The build-up in inventory clearly shows a situation in which the construction of new homes was exceeding the purchase of new homes. The difference between new homes for sale and new homes sold has declined considerably in recent year, although this is due primarily to a large decline in new construction, and not to significant increases in demand for new homes.
The Census Bureau only provides new home data at a regional level. Extrapolating to the Colorado is problematic with this data since the West region includes California, Arizona and Nevada, all of which experienced large housing bubbles. Nevertheless, regional banks, builders and housing providers will gain insights into how Colorado fits into the larger Western region.
The report, which monitors sales activity for newly constructed houses, reported that in the West, new home sales fell 50 percent, year over year, falling from 8,000 in October 2009 to 4,000 in October 2010, while nationwide, sales dropped off 30 percent falling from 33,000 to 23,000 during the same period.
In October, new home sales, tied for the lowest volume in at least a decade. The first chart shows monthly new home sales totals for each month since 2003. October’s total of 4,000 new homes sold tied with July 2010, and is the lowest total since at least the year 2000.
The chart shows that May, June, July, August and September of this year all set new lows in the total number of new homes sold for each month.
The drop off in home sales is likely tied to the end of the new home buyer tax credit which expired in April. The second chart shows that in both the West and in the US, new home sales were pushed up by the tax credit, and then fell quickly after April 2010.
New home sales and new home inventory continue to fall and have generally followed a downward trend since the middle of the decade.
New home sales peaked during the spring and summer of 2005 and have trended downward since. The number of new houses sold in the United States is down 81.8 percent since the peak of March 2005, and new home sales in the West have fallen 89.4 percent since sales peaked in the region during March 2004.
The third chart shows the declines in both US and regional new home sales.
The number of new home sales has also fallen off considerably. The number of new houses for sale in the West has fallen 66.4 percent since the total peaked during June 2007, and the same total has fallen 64.9 percent in the US since the number of new homes for sale peaked in the US during August 2006.
The number of homes for sale grew more quickly in the West than in the US, with growth in the West topping 119.6 percent from January 2001 to June 2007, and the total grew 92.2 percent from January 2001 to August 2006. The fourth chart shows the rise of new homes for sale.
The fifth chart shows the difference between the number of homes in the region for sale at the beginning of a month vs. the number of homes sold during that month. Interestingly, the build up in inventory can be seen as it grows from 2004 to 2007. Historically, it appears that the a “normal” difference between new homes for sale and new homes sold is somewhere between 40,000 and 50,000 homes in the region. This total reaches almost 120,000 homes during the peak months, and has now fallen to approximately 40,000 homes, where the total has remained for the past year. The build-up in inventory clearly shows a situation in which the construction of new homes was exceeding the purchase of new homes. The difference between new homes for sale and new homes sold has declined considerably in recent year, although this is due primarily to a large decline in new construction, and not to significant increases in demand for new homes.
The Census Bureau only provides new home data at a regional level. Extrapolating to the Colorado is problematic with this data since the West region includes California, Arizona and Nevada, all of which experienced large housing bubbles. Nevertheless, regional banks, builders and housing providers will gain insights into how Colorado fits into the larger Western region.
Home prices decline again in the Denver area according to Case-Shiller
Case-Shiller’s home price index for the Denver area fell 1.0 percent from August to September, and fell 1.6 percent , year-over-year from September 2009 to September 2010.
According to the Case-Shiller data, released today by Standard and Poor's, and containing data up through September, 12 of the 20 metro areas measured by the report showed larger declines than the Denver area.
In year over year comparisons for September, Chicago showed the largest drop, with a decline of 5.6 percent, while the index in Tampa fell 4.3 percent. The index rose the most in San Francisco where it increased 5.5 percent, year over year. The index also rose 5.0 percent in San Diego.
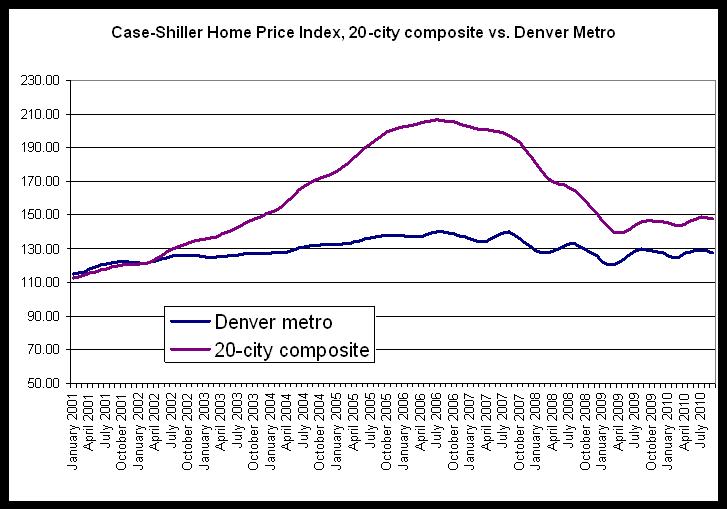
The first chart shows trends in the Case-Shiller index for the Denver area and for the 20-city composite index. It is clear that Denver did not experience the kind of price bubble that occurred in many other metropolitan areas, and consequently, the index has not fallen nearly as far in Denver compared to the larger composite. [Note: The two curves are reversed in this graph. The top curve is the 20-city composite, and the bottom curve is the Denver metro area.]
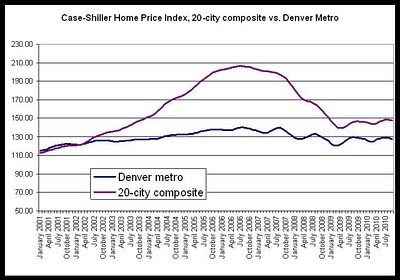
The 20-city composite is down 28.5 percent since it peaked in July 2006, but the Denver index is down only 9.2 percent from its August 2006 peak.
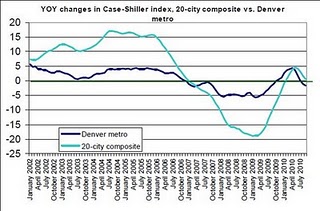
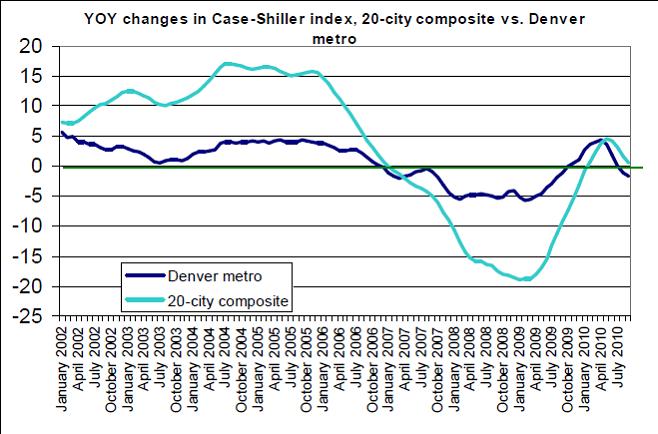
The second chart compares year-over-year changes in the Denver area index andin the 20-city composite. The Denver index did not achieve the rates of growth experienced by the national index, but the Denver index did not experience comparable rates of decline following the onset of the national recession either. Overall, the index has been less volatile in Denver than has been the case for the 20-city composite. Year-over-year growth in the 20-city composite is near zero with an increase of 0.6 percent for September. The Denver area index’s fall of 1.6 percent is the third month in a row in which the growth rate has been negative.
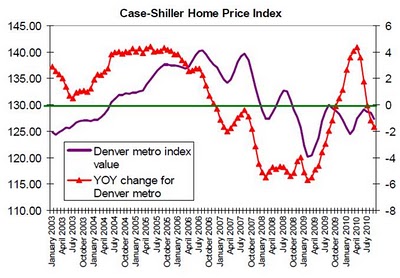
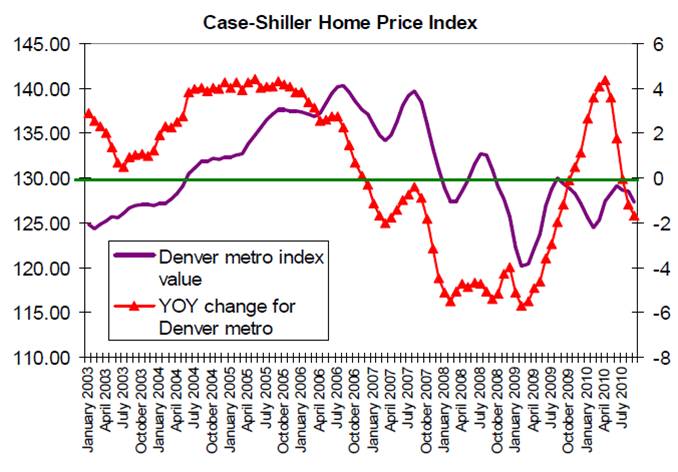
The last chart compares the actual index value for the Denver area with the year-over-year change. Note that for July, August, and September, the change has fallen below zero, and likely reflects the end of the homebuyer tax credit’s end which has translated into a fall in demand and a decline in the home price index. The upward trend in the index in response to the tax credit is clear during late 2009 and early 2010.
Case-Shiller’s take on the most recent data is that it reflects “broad-based declines” in the index:
According to the Case-Shiller data, released today by Standard and Poor's, and containing data up through September, 12 of the 20 metro areas measured by the report showed larger declines than the Denver area.
In year over year comparisons for September, Chicago showed the largest drop, with a decline of 5.6 percent, while the index in Tampa fell 4.3 percent. The index rose the most in San Francisco where it increased 5.5 percent, year over year. The index also rose 5.0 percent in San Diego.
The first chart shows trends in the Case-Shiller index for the Denver area and for the 20-city composite index. It is clear that Denver did not experience the kind of price bubble that occurred in many other metropolitan areas, and consequently, the index has not fallen nearly as far in Denver compared to the larger composite. [Note: The two curves are reversed in this graph. The top curve is the 20-city composite, and the bottom curve is the Denver metro area.]
The 20-city composite is down 28.5 percent since it peaked in July 2006, but the Denver index is down only 9.2 percent from its August 2006 peak.
The second chart compares year-over-year changes in the Denver area index andin the 20-city composite. The Denver index did not achieve the rates of growth experienced by the national index, but the Denver index did not experience comparable rates of decline following the onset of the national recession either. Overall, the index has been less volatile in Denver than has been the case for the 20-city composite. Year-over-year growth in the 20-city composite is near zero with an increase of 0.6 percent for September. The Denver area index’s fall of 1.6 percent is the third month in a row in which the growth rate has been negative.
The last chart compares the actual index value for the Denver area with the year-over-year change. Note that for July, August, and September, the change has fallen below zero, and likely reflects the end of the homebuyer tax credit’s end which has translated into a fall in demand and a decline in the home price index. The upward trend in the index in response to the tax credit is clear during late 2009 and early 2010.
Case-Shiller’s take on the most recent data is that it reflects “broad-based declines” in the index:
"Nationally, home prices are 1.5% below their year-earlier levels. In September, 18 of the 20 MSAs covered by S&P;/Case-Shiller Home Price Indices and both monthly composites were down; and only the two composites and five MSAs showed year-over-year gains. While housing prices are still above their spring 2009 lows, the end of the tax incentives and still active foreclosures appear to be weighing down the market."
Monday, November 29, 2010
House prices fall in most recent Fannie and Freddie data
The Federal Housing and Finance Agency today released its 3rd quarter 2010 report on home prices. FHFA’s House Price Index (HPI) provides home price information for Colorado and seven of its metropolitan areas based on conventional loan data obtained through Fannie Mae and Freddie Mac.
According to the report, Colorado’s HPI fell 3.2 percent during from the second quarter to the third quarter of this year, and fell 2.9 percent year-over-year from the third quarter of last year to the third quarter of this year.
With a drop of 3.2 percent from the second quarter, it is the largest quarterly drop since the 4th quarter of 2008 when the HPI fell 3.8 percent from the previous corner.
The year-over-year change was also the largest since the fourth quarter of 2008 when the HPI fell 4.0 percent year over year from the third quarter of the previous year.
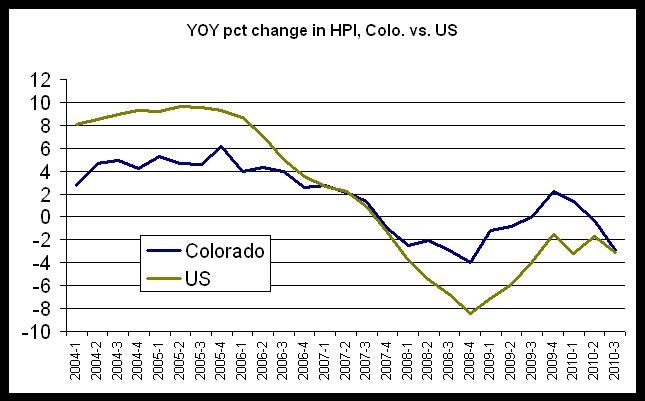
The first chart shows that Colorado has now fallen below zero for two quarters in a row when comparing the HPI with the previous year. The chart also shows, however, that Colorado’s HPI has been more stable than the national HPI in recent quarters, with YOY changes rarely exceeding more than a 2 percent since the first quarter of last year.
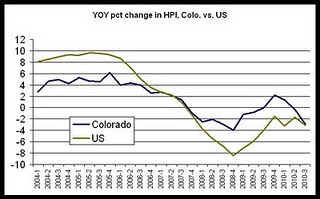
The national HPI fell more than the Colorado HPI following the beginning of the national recession, and the US HPI has yet to show a positive YOY change since the third quarter of 2007.
The second chart shows that since the HPI in both Colorado and the US peaked in the second quarter of 2007, Colorado’s HPI has fallen by 6.2 percent, but the US HPI has fallen by more than 13.9 percent.
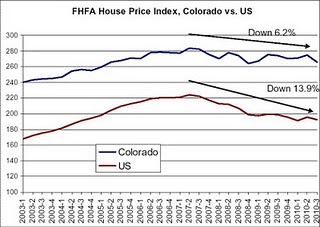
Overall, the data suggests that house prices in Colorado are more stable and have recovered more completely than is the case nationwide.
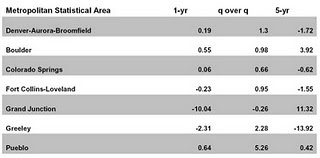
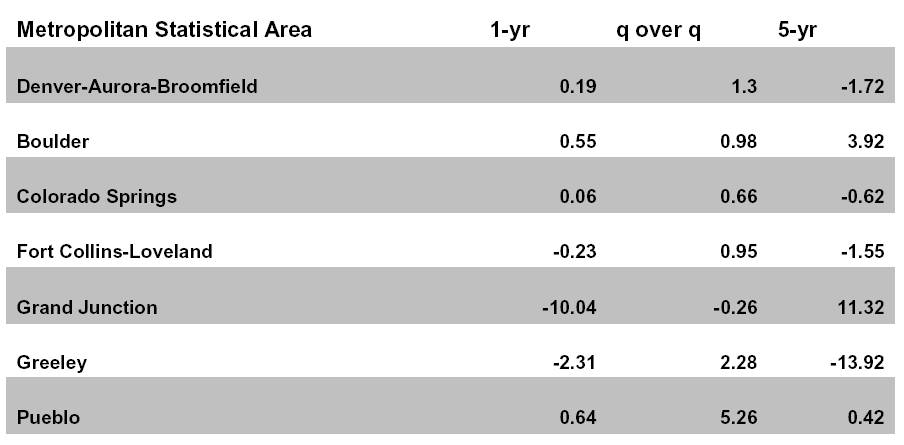
The last chart shows the FHFA’s data for seven metropolitan areas of Colorado. All metro areas except Grand Junction and Greeley show very small changes in the year-over-year comparisons.
Greeley’s home prices continue to experience significant downward pressure, likely as a result of ongoing foreclosure issues. Only recently, has Weld County begun to stabilize in foreclosure activity according to State of Colorado foreclosure data.
Grand Junction’s recent declines in home prices have not been enough to erase previous gains occurring in the past five years.
According to the report, Colorado’s HPI fell 3.2 percent during from the second quarter to the third quarter of this year, and fell 2.9 percent year-over-year from the third quarter of last year to the third quarter of this year.
With a drop of 3.2 percent from the second quarter, it is the largest quarterly drop since the 4th quarter of 2008 when the HPI fell 3.8 percent from the previous corner.
The year-over-year change was also the largest since the fourth quarter of 2008 when the HPI fell 4.0 percent year over year from the third quarter of the previous year.
The first chart shows that Colorado has now fallen below zero for two quarters in a row when comparing the HPI with the previous year. The chart also shows, however, that Colorado’s HPI has been more stable than the national HPI in recent quarters, with YOY changes rarely exceeding more than a 2 percent since the first quarter of last year.
The national HPI fell more than the Colorado HPI following the beginning of the national recession, and the US HPI has yet to show a positive YOY change since the third quarter of 2007.
The second chart shows that since the HPI in both Colorado and the US peaked in the second quarter of 2007, Colorado’s HPI has fallen by 6.2 percent, but the US HPI has fallen by more than 13.9 percent.
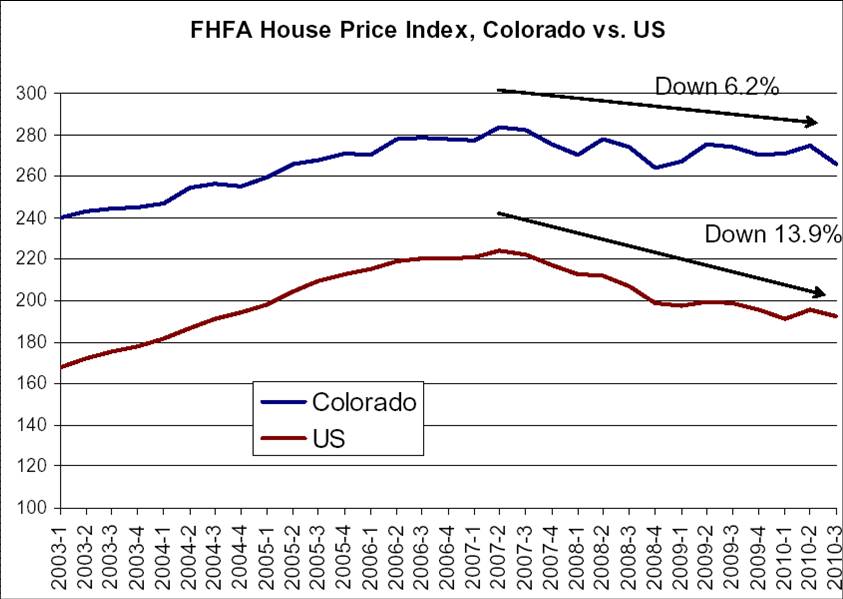
Overall, the data suggests that house prices in Colorado are more stable and have recovered more completely than is the case nationwide.
The last chart shows the FHFA’s data for seven metropolitan areas of Colorado. All metro areas except Grand Junction and Greeley show very small changes in the year-over-year comparisons.
Greeley’s home prices continue to experience significant downward pressure, likely as a result of ongoing foreclosure issues. Only recently, has Weld County begun to stabilize in foreclosure activity according to State of Colorado foreclosure data.
Grand Junction’s recent declines in home prices have not been enough to erase previous gains occurring in the past five years.
Total employment fell in October in Colorado
Colorado lost 19,791 jobs in October, and the non-seasonally-adjusted unemployment rate rose slightly to 8.1 from September’s rate of 8.0 percent. According to the most recent employment data released by the Colorado Department of Labor and Employment, total employment in October, not seasonally adjusted, fell to 2,449,913 jobs.
More than 19,777 people left the work force during the month, which prevented any significant increase in the unemployment rate in spite of job losses, since the number of job losses was roughly equal to the number of people who left the work force.
From October 2009 to October 2010, total employment fell 1.27 percent, contracting by 31,577 jobs, while the labor force shrank 0.23 percent, shedding more than 6,100 workers. The total labor force in October included 2,664,848 workers during October of this year as compared to 2,671,036 during October of last year.
As can be seen in the first graph, both total employment and total workforce size have fallen off in recent months, and both remain well below the 2008 peak.
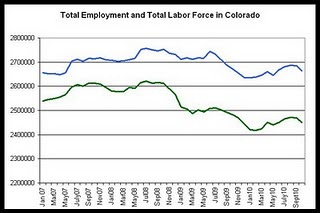
Employment totals are still more than 171,000 below the peak levels experienced during July 2008, when there were 2,621,081 employed workers. Since the peak of the labor market in July 2008, the labor force is still down by more than 91,700.
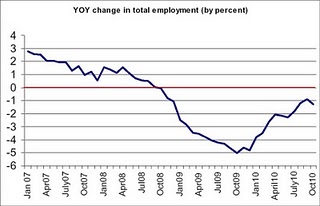
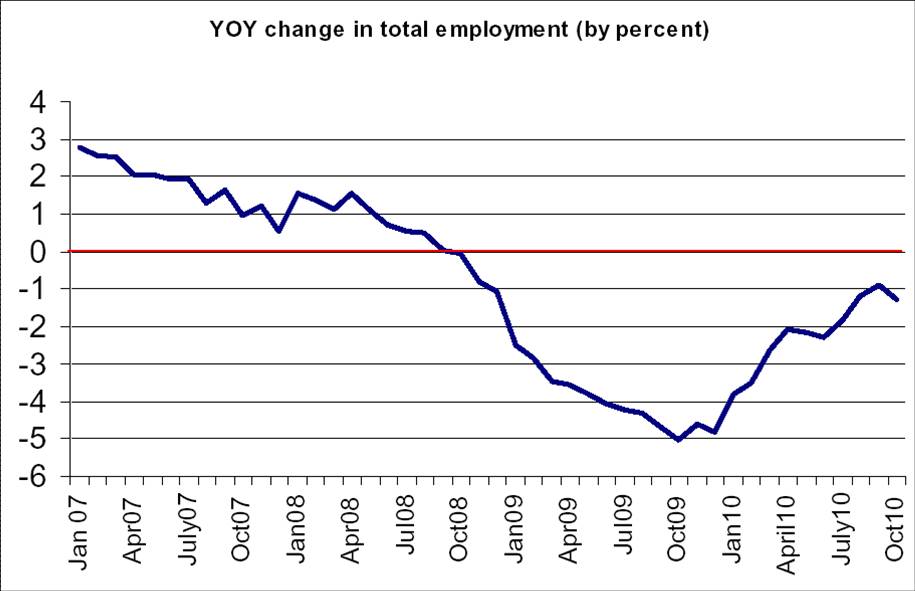
In the second graph is shown the year-over-year comparisons for total employment. Not since September 2008 has Colorado posted a positive change in total employment when compared to a year earlier. Although overall total employment has increased since January 2010, employment totals remain below 2009 totals in each year-over-year comparison.
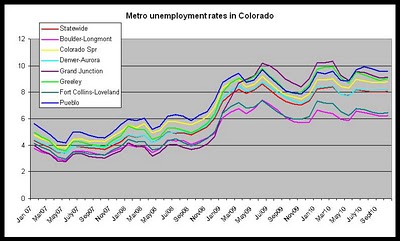
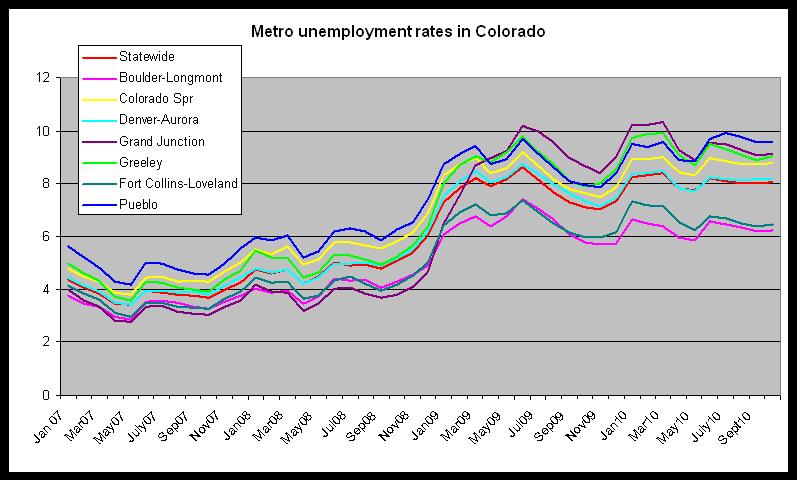
Among Colorado metropolitan areas, Pueblo showed the highest unemployment rate at 9.6 percent, while the Boulder-Longmont and Fort Collins-Loveland areas showed the lowest rates as 6.2 percent and 6.5 percent, respectively.
All metropolitan areas in Colorado, except Boulder-Longmont and Fort-Collins-Loveland, experienced job declines year over year, from October 2009 to October 2010.
The third graph shows unemployment rates in all metro areas for October 2010 were Boulder-Longmont, 6.2 percent; Denver-Aurora, 8.2 percent; Greeley, 9.0 percent; Fort Collins-Loveland, 6.5 percent; Grand Junction, 9.1 percent; Pueblo, 9.6 percent.
Notice that Grand Junction shifted from having the lowest rate to having the highest rate in early 2009.
The national jobless rate, seasonally adjusted, was 9.6 percent for October, and the state’s seasonally adjusted unemployment rate was 8.4 percent for the same period.
Industry information
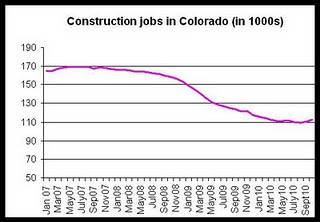
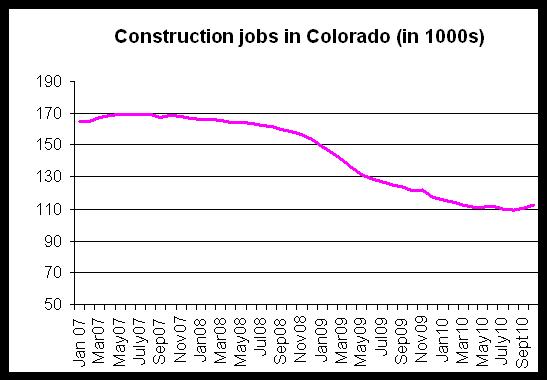
Construction jobs in Colorado increased slightly in Colorado gaining almost 2,000 jobs during October, but compared year over year, construction jobs were down by 9,000 jobs, and they are down 57,000 jobs since the peak of the construction job market in July of 2007.
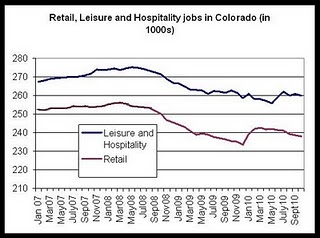
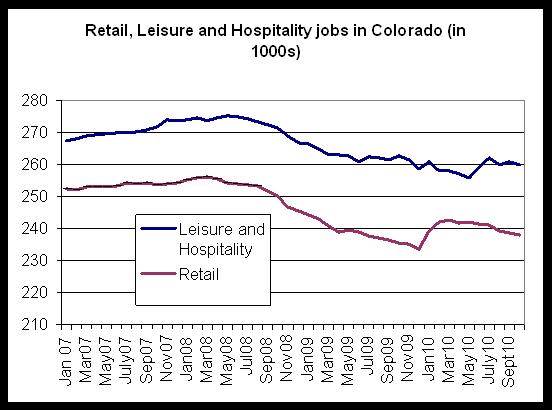
Leisure and hospitality jobs, which often drive the demand for rental housing in Colorado, continued to fall during October. As can be seen in the chart below, retail jobs and leisure and hospitality jobs are down from September, and are also down year over year. Total jobs in these industries remain well below jobs totals experienced during the 2008 peaks.
More than 19,777 people left the work force during the month, which prevented any significant increase in the unemployment rate in spite of job losses, since the number of job losses was roughly equal to the number of people who left the work force.
From October 2009 to October 2010, total employment fell 1.27 percent, contracting by 31,577 jobs, while the labor force shrank 0.23 percent, shedding more than 6,100 workers. The total labor force in October included 2,664,848 workers during October of this year as compared to 2,671,036 during October of last year.
As can be seen in the first graph, both total employment and total workforce size have fallen off in recent months, and both remain well below the 2008 peak.
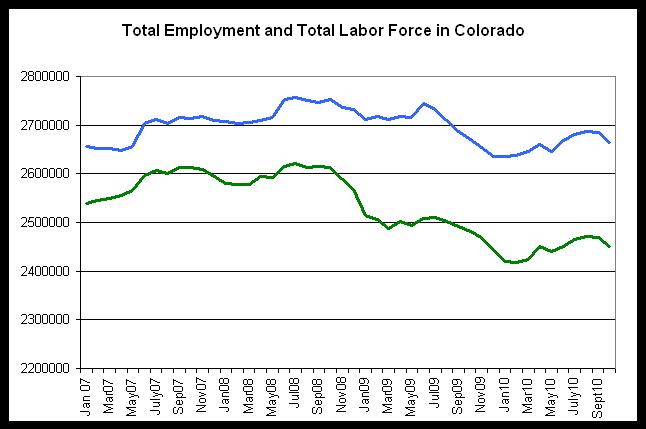
Employment totals are still more than 171,000 below the peak levels experienced during July 2008, when there were 2,621,081 employed workers. Since the peak of the labor market in July 2008, the labor force is still down by more than 91,700.
In the second graph is shown the year-over-year comparisons for total employment. Not since September 2008 has Colorado posted a positive change in total employment when compared to a year earlier. Although overall total employment has increased since January 2010, employment totals remain below 2009 totals in each year-over-year comparison.
Among Colorado metropolitan areas, Pueblo showed the highest unemployment rate at 9.6 percent, while the Boulder-Longmont and Fort Collins-Loveland areas showed the lowest rates as 6.2 percent and 6.5 percent, respectively.
All metropolitan areas in Colorado, except Boulder-Longmont and Fort-Collins-Loveland, experienced job declines year over year, from October 2009 to October 2010.
The third graph shows unemployment rates in all metro areas for October 2010 were Boulder-Longmont, 6.2 percent; Denver-Aurora, 8.2 percent; Greeley, 9.0 percent; Fort Collins-Loveland, 6.5 percent; Grand Junction, 9.1 percent; Pueblo, 9.6 percent.
Notice that Grand Junction shifted from having the lowest rate to having the highest rate in early 2009.
The national jobless rate, seasonally adjusted, was 9.6 percent for October, and the state’s seasonally adjusted unemployment rate was 8.4 percent for the same period.
Industry information
Construction jobs in Colorado increased slightly in Colorado gaining almost 2,000 jobs during October, but compared year over year, construction jobs were down by 9,000 jobs, and they are down 57,000 jobs since the peak of the construction job market in July of 2007.
Leisure and hospitality jobs, which often drive the demand for rental housing in Colorado, continued to fall during October. As can be seen in the chart below, retail jobs and leisure and hospitality jobs are down from September, and are also down year over year. Total jobs in these industries remain well below jobs totals experienced during the 2008 peaks.
Monday, November 22, 2010
Completed foreclosures in Colorado fall in response to foreclosure slowdown
Click here for the full report.
Foreclosure sales at auction dropped to a 19-month low in Colorado’s metropolitan counties during October. According to a report released today by the Colorado Division of Housing, foreclosure sales fell 38 percent from September to October as some mortgage servicers slowed down the processing of foreclosures in response to the so-called “robo-signing” controversy.
Comparing year-over-year, foreclosure sales fell 13.8 percent in October, but year-to-date comparisons show that for the period from January to October, foreclosure sales are up 18.3 percent as compared to the same period last year. There were 1,308 foreclosures that proceeded to sale at auction during October 2010 in Colorado’s metropolitan counties, compared to September’s total of 2,111. There were 1,518 sales during October of last year.
Foreclosure filings, on the other hand, continued to fall. Foreclosure filings fell 5.4 percent from October 2009 to October 2010, and year-to-date comparisons show that filings are down 11.2 percent for the period of January to October this year as compared to the same period last year. Filings rose 3.4 percent from September to October. There were 3,059 foreclosure filings during October 2010 in the metro Counties, compared to September’s total of 2,959. There were 3,254 filings during October of last year
Foreclosure filings are the initial filing that begins the foreclosure process, and foreclosure sales totals are the total number of foreclosures that have been sold at auction at the end of the foreclosure process.
With the exception of Mesa County, all metropolitan counties showed decreases in foreclosure sales at auction, comparing year-over-year. From October 2009 to October 2010, foreclosure sales rose 35.9 percent in Mesa County, but foreclosure sales fell 60 percent in Broomfield County, and they fell 37.9 percent and 35.6 percent in Boulder County and Pueblo County, respectively.
Foreclosure filings trends were mixed in Colorado’s metro counties. From October 2009 to October 2010, in Broomfield and Mesa counties, filings increased 36.8 percent and 16.2 percent, respectively. In all other metro counties, during the same period, foreclosure filings either fell or rose only a small amount. Filings fell 16.8 percent and 13.3 percent in Adams and Arapahoe Counties, respectively.
The Division of Housing’s monthly foreclosure report surveys foreclosure activity in the twelve largest counties of Colorado. The report is a supplement to the Division’s quarterly foreclosure report that includes all counties in Colorado.
For statewide data, see the video update for the third quarter foreclosure report:
Friday, November 19, 2010
Colorado’s foreclosure inventory shrinking faster than the nation’s
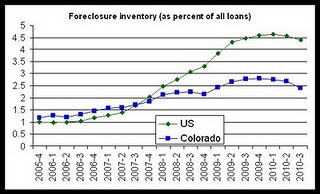
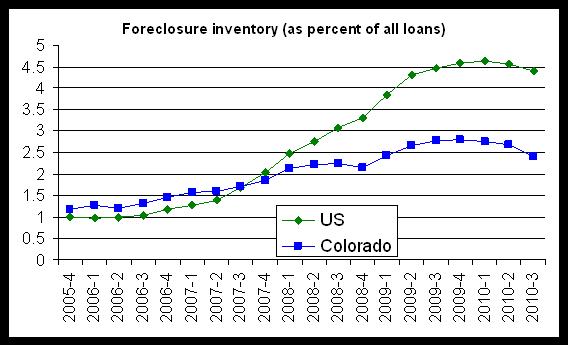
As I reported earlier this week, according to the National Delinquency Survey, conducted by the Mortgage Bankers Association, Colorado’s foreclosure inventory fell to 2.4 percent of all mortgage loans during the third quarter, which is a drop from last year’s third quarter rate of 2.78 percent.
These levels have consistently been below the nationwide percentages of loans in foreclosure since the fourth quarter of 2007. The national rate for the percentage of loans in foreclosure is now 4.39 percent. 35 states reported foreclosure inventories that are proportionally larger, making Colorado the state with the 15th smallest foreclosure inventory.
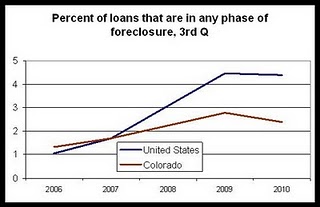
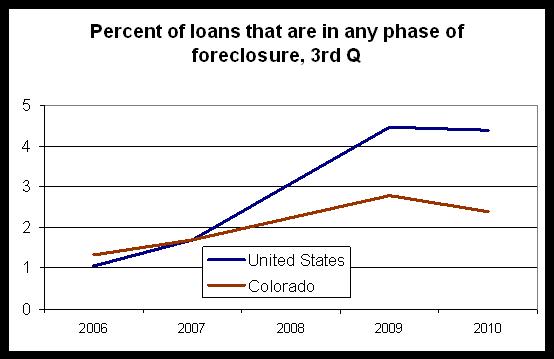
As can be seen in the graph below, Colorado’s foreclosure inventory has also fallen farther from its peak than has been the case nationally, with the percentage of loans in foreclosure now down 14.6 percent from the 4th quarter 2009 peak, while nationally, the percentage of loans in foreclosure is only down 5.2 percent from its 1st quarter 2010 peak.
The percentage of mortgage loans in foreclosure has fallen for three quarters, and is down three times as much as the nation from peak levels.
From 2005 to 2007, Colorado’s foreclosure inventory was slightly larger than the national rate, but since the fourth quarter of 2007, the national foreclosure inventory increased at a faster rate than the Colorado inventory, and has been a larger proportion of loans overall. From the third quarter of 2007 to first quarter of 2010, the percentage of loans in foreclosure grew 173.9 percent. In Colorado, on the other hand, from the third quarter of 2007 to the fourth quarter of 2009, the percent of loans in foreclosure grew 64.3 percent.
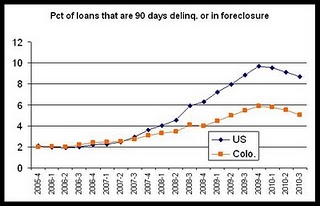
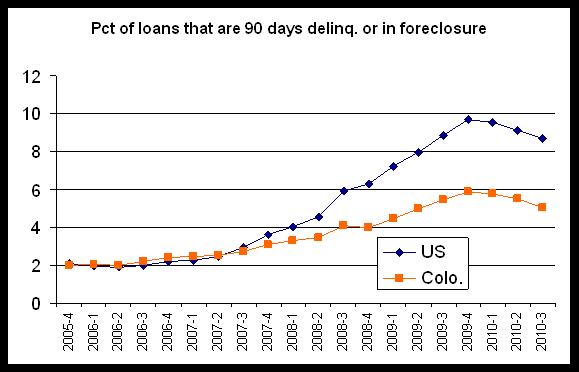
Similar improvements are also evident when adding together foreclosure inventory and 90-day delinquencies (“seriously delinquent loans”). In Colorado the combined percentage of loan in either category this is down 13.9 percent, but nationally, it is down 10 percent. As can be seen in the graph below, both percentages peaked during the fourth quarter of 2009. Presently, the national percentage of loans in either category is 8.7 percent, but the rate in Colorado is 5.05 percent.
National growth has also outpaced Colorado. The percentage of loans either in foreclosure or seriously delinquent in Colorado and the nation were about equal during the 3rd quarter of 2007. From the 3rd quarter of 2007 to the fourth quarter of 2009, when percentages peaked, the percentage of loans either seriously delinquent or in foreclosure grew 227.7 percent nationally, while Colorado grew 115 percent.
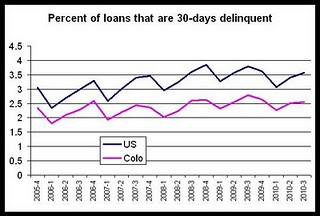
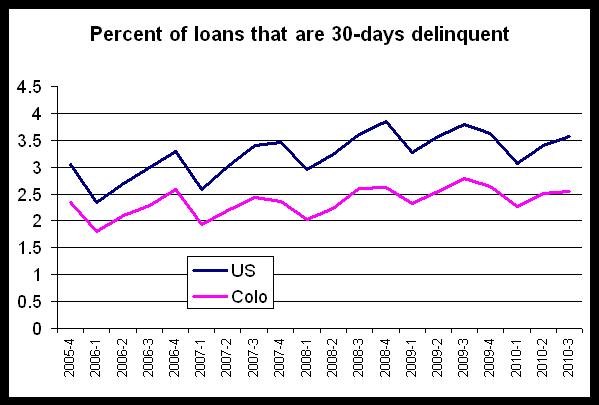
New 30 day delinquencies show that Colorado is improving faster than the nation as well. 30-day delinquencies are subject to significant seasonality effects, so we need to compare year over year.
In new 30 day delinquencies measured year over year, Colorado’s percentage of loans entering a state of 30-day delinquency is down 8.2 percent, but nationally, the rate is down only 5.8 percent. We also find that Colorado’s rate is below the national rate with 3.57 percent of loans 30-days delinquent during the third quarter of this year as opposed to 2.55 percent in Colorado during the same period.
As can be seen in the graph below, examining growth in 30-day delinquencies since the 3rd quarter of 2006 (the earliest 3rd quarter data we have), we see that nationally, the percentage of new 30-day delinquencies is up 19.4 percent, and the Colorado rate is up by 11.3 percent.
The decline is foreclosure inventory according to the MBA report is reinforced by Colorado state data showing a continued drop in foreclosure filings in Colorado since the fourth quarter of 2009.
Although foreclosures continue to proceed to sale at auction in numbers similar to those seen since 2007, declines in foreclosure inventory, and drops in foreclosure filings point to stabilization in the housing market in Colorado, and will eventually manifest itself in declining totals for mortgage going to sale at auction as well.
These levels have consistently been below the nationwide percentages of loans in foreclosure since the fourth quarter of 2007. The national rate for the percentage of loans in foreclosure is now 4.39 percent. 35 states reported foreclosure inventories that are proportionally larger, making Colorado the state with the 15th smallest foreclosure inventory.
As can be seen in the graph below, Colorado’s foreclosure inventory has also fallen farther from its peak than has been the case nationally, with the percentage of loans in foreclosure now down 14.6 percent from the 4th quarter 2009 peak, while nationally, the percentage of loans in foreclosure is only down 5.2 percent from its 1st quarter 2010 peak.
The percentage of mortgage loans in foreclosure has fallen for three quarters, and is down three times as much as the nation from peak levels.
From 2005 to 2007, Colorado’s foreclosure inventory was slightly larger than the national rate, but since the fourth quarter of 2007, the national foreclosure inventory increased at a faster rate than the Colorado inventory, and has been a larger proportion of loans overall. From the third quarter of 2007 to first quarter of 2010, the percentage of loans in foreclosure grew 173.9 percent. In Colorado, on the other hand, from the third quarter of 2007 to the fourth quarter of 2009, the percent of loans in foreclosure grew 64.3 percent.
Similar improvements are also evident when adding together foreclosure inventory and 90-day delinquencies (“seriously delinquent loans”). In Colorado the combined percentage of loan in either category this is down 13.9 percent, but nationally, it is down 10 percent. As can be seen in the graph below, both percentages peaked during the fourth quarter of 2009. Presently, the national percentage of loans in either category is 8.7 percent, but the rate in Colorado is 5.05 percent.
National growth has also outpaced Colorado. The percentage of loans either in foreclosure or seriously delinquent in Colorado and the nation were about equal during the 3rd quarter of 2007. From the 3rd quarter of 2007 to the fourth quarter of 2009, when percentages peaked, the percentage of loans either seriously delinquent or in foreclosure grew 227.7 percent nationally, while Colorado grew 115 percent.
New 30 day delinquencies show that Colorado is improving faster than the nation as well. 30-day delinquencies are subject to significant seasonality effects, so we need to compare year over year.
In new 30 day delinquencies measured year over year, Colorado’s percentage of loans entering a state of 30-day delinquency is down 8.2 percent, but nationally, the rate is down only 5.8 percent. We also find that Colorado’s rate is below the national rate with 3.57 percent of loans 30-days delinquent during the third quarter of this year as opposed to 2.55 percent in Colorado during the same period.
As can be seen in the graph below, examining growth in 30-day delinquencies since the 3rd quarter of 2006 (the earliest 3rd quarter data we have), we see that nationally, the percentage of new 30-day delinquencies is up 19.4 percent, and the Colorado rate is up by 11.3 percent.
The decline is foreclosure inventory according to the MBA report is reinforced by Colorado state data showing a continued drop in foreclosure filings in Colorado since the fourth quarter of 2009.
Although foreclosures continue to proceed to sale at auction in numbers similar to those seen since 2007, declines in foreclosure inventory, and drops in foreclosure filings point to stabilization in the housing market in Colorado, and will eventually manifest itself in declining totals for mortgage going to sale at auction as well.
Thursday, November 18, 2010
Only 14 states have a smaller inventory of foreclosures than Colorado
The percentage of Colorado mortgage loans in foreclosure fell to 2.4 percent during the third quarter of 2010, falling from 2009’s third-quarter rate of 2.78 percent. According to a report released today by the Mortgage Bankers Association, the proportion of Colorado mortgage loans in foreclosure fell this year from the second quarter to the third quarter, falling from 2.69 percent to 2.4 percent.
Compared to the proportion of loans in foreclosure for all states, Colorado’s totals are lower than national percentages. Nationally, 4.39 percent of loans nationwide were in a state of foreclose during the third quarter of 2010. Year-over-year trends are down nationally with 2010’s third-quarter percentage being an increase from the third quarter of 2010 when the total percentage of loans in foreclosure was 4.47. Nationally, foreclosing loans also decreased from the second quarter to the third quarter this year with a fall from 4.57 percent to 4.39 percent.
Only 14 states reported a smaller percentage of loans in foreclosure than Colorado. North Dakota reported the smallest percentage of foreclosing mortgages with 0.95 percent. Alaska and South Dakota placed slightly behind North Dakota with 1.50 percent of loans in foreclosure in both states.
States reporting the highest percentages of loans in foreclosure included Nevada and Florida with percentages of 9.72 percent and 13.68 percent, respectively.
Short-term delinquencies dropped slightly in both Colorado and nationally from the third quarter of last year to the third quarter this year. In Colorado, 30-day delinquencies fell from 2.78 percent to 2.55 percent, year over year, while nationwide, they fell from 3.79 percent to 3.57 percent during the same period.
State of Colorado foreclosure data has shown declines in new foreclosure filings, year over year, with a drop of 15 percent from the third quarter of 2009 to the third quarter of this year. Foreclosure sales at action, on the other hand, showed a year over year increase of 18 percent during the same period. The fact that fewer properties are entering the process, according to the Colorado data, would seem to reinforce the MBA’s finding that overall foreclosure inventory is declining.
Nationwide, the percentage of loans in foreclosure during the third quarter has outpaced Colorado since 2008. Prior to 2008, Colorado reported a larger percentage of foreclosing loans than was the case nationally, but since 2008, the percentage of foreclosing loans has grown more nationally than in Colorado each year. From the third quarter of last year to the third quarter of this year, the foreclosure inventory shrank faster in Colorado than nationally.
Colorado has repeatedly fallen in state-by-state comparisons in recent years. In 2007, for example, Colorado was often found to be in the top 15 states for foreclosures. Colorado has since dropped to 36th place.
This has also been the case in 30-day delinquencies and in the total combined percentage of loans that are in foreclosure or are 90-days delinquent.
Prior to 2008, Colorado experienced a large amount of foreclosure and delinquency activity before the rest of the nation making it one of the top states in the nation for foreclosures. Since 2008, other states like Nevada, California and Florida have outpaced Colorado and have moved national percentages above Colorado’s.
Tuesday, November 16, 2010
VIDEO: How foreclosures have spread in Colorado
Here is a time-lapse map that shows how foreclosure rates have gone up in different Colorado counties at different times.
Foreclosures have not increased at an even pace across the state. Early on, foreclosures were largely limited to Colorado's Front Range, but now foreclosures are a statewide phenomenon. See the video for a quick look.
Foreclosures have not increased at an even pace across the state. Early on, foreclosures were largely limited to Colorado's Front Range, but now foreclosures are a statewide phenomenon. See the video for a quick look.
Video update on Colorado Foreclosures for the third quarter.
This video takes a quick look at foreclosure trends in Colorado across the state during the third quarter. We look at how the record numbers of foreclosure filings last year are fueling the upward trend in foreclosure sales at auction this year. MORE:
Survey on Fair Housing
The Colorado Department of Local Affairs, Division of Housing (DOH) and the Colorado Department of Human Services, Division of Supportive Housing and Homeless Programs (SHHP)requests your participation in a brief survey designed to identify impediments to fair housing in Colorado.
The purpose of the survey is to gain a more qualitative analysis of the knowledge, experiences, opinions and feelings of stakeholders and other interested parties regarding fair housing in Colorado. In addition, the survey will gauge stakeholders' understanding of affirmatively furthering fair housing.
Click here to take the survey.
Friday, November 12, 2010
Recent media coverage of the Division of Housing
Recent articles of interest involving the Division of Housing:
Foreclosures down 15%
There were 10,578 Colorado foreclosure filings in the third quarter, a 15.1 percent drop from the 12,468 filed during the same period of 2009, according to state data released today.
However, there were 6,629 sales at public trustee auctions - competed foreclosures - an 18 percent increase from the 5,618 sales in the third quarter of 2009, according to a report from the Colorado Division of Housing, part of the state’s Department of Local Affairs. Separately, RealtyTrac also released a national foreclosure report today, which uses a different methodology than the division.
Colorado foreclosure filings down in Q3 from 2009, but sales up (11/12/2010)
New foreclosure filings across Colorado dropped in the third quarter from a year earlier, while sales of foreclosed properties increased, according to Colorado Division of Housing data released Thursday.
And while the housing division expects foreclosure filings to be relatively high for all of 2010, at around 41,000, it believes they won't hit 2009's record of 46,394.
Foreclosure data mixed (11/12/2010)
The ratio of homes sold at auction to new filings reached 62.6 percent in the third quarter, a big jump from the 45 percent during the third quarter of 2009.
Many borrowers losing their homes are in otherwise-solid fixed-rate mortgages with interest rates of 5 percent to 6 percent, Riggi said.
They just don't have the income to support the payments, she said. And mortgage servicers, faced with a huge backlog, aren't as accommodative in modifying terms.
Ron Woodcock, a broker with Re/Max Southeast, said he recently had two properties under contract in short sales that fell apart after the lender refused to postpone an auction.
"We have more homes on the market," he said. "Values are on the way back down."
Foreclosure filing fall across Colorado in third quarter (11/12/2010)
In Adams County, third-quarter foreclosure filings for this year fell to 1,276 from 1,456 during the same period 2009. In Arapahoe County, third-quarter foreclosure filings for this year fell to 1,353 from 1,699 during the same period in 2009.
All metropolitan counties except Weld County reported year-over-year increases in foreclosure sales at auction — the event that completes the foreclosure process. Comparing the third quarter of 2009 to the same period this year, foreclosure sales were up 164.0 percent in Mesa County, and were up 44.2 percent in Douglas County. Denver County and Adams County increased only 1.1 percent and 1.8 percent increases, respectively, while Weld County totals dropped 7.2
Go to article (Aurora Sentinel)
Mesa County foreclosures hit 264 in 3rd quarter (11/12/2010)
Mesa County was the largest county in the state to see a year-over-year increase in foreclosure filings during the third quarter of 2010.
Mesa County’s foreclosure- filing total increased 20.9 percent year-over-year in the third quarter. Filings, which signal the beginning of the foreclosure process, also increased 21.9 percent quarter-to-quarter in the county.
The number of homes making it to the end of the foreclosure process in Mesa County grew two-and-a-half times year-over-year to 264 in the third quarter. Sales locally decreased 5 percent quarter-to-quarter.
Go to article (Grand Junction Daily Sentinel)
Report: fewer foreclosures filed, more foreclosure sales (11/12/2010)
Foreclosure filings continue to decline locally, statewide and nationwide, while foreclosure sales noted an uptick, according to a report released Thursday by the Colorado Department of Local Affairs’ Division of Housing
Locally, Larimer County recorded a 13.9 percent drop in foreclosure filings year-over-year for the third quarter. At the same time third quarter sales jumped by 8 percent.
Year-to-date, Larimer has 2,346 foreclosure sales and 1,136 filings. For the third quarter that is 243 sales and 478 filings.
Go to article (Ft Collins Coloradoan )
Third quarter foreclosure filings down, sales up, in El Paso County (11/12/2010)
Colorado Springs is one of several large metropolitan areas in the state where foreclosure filings fell sharply in the third quarter, according to a Colorado Division of Housing report released Thursday.
But foreclosure sales — properties that went through the foreclosure process and were taken back by lenders or bought by third-party investors — rose locally. The increase, however, wasn’t nearly as bad in the Springs as several other metro areas.
Statewide, the trend was the same. Filings — the start of a legal process that can lead to the loss of a home or other property — fell in the third quarter, but sales climbed. It was a good news, bad news situation for Colorado, said Housing Division spokesman Ryan McMaken.
Apartment rental market tightens in Denver/Boulder (11/11/2010)
Apartment vacancy rates in the Boulder area and the Denver metro area hit 10-year lows during the third quarter, a tightening in the market not seen since before the recession, state housing officials said Wednesday.
Multifamily vacancy rates across Boulder and Broomfield counties dropped to 3.5 percent during the recent three-month period, according to a report by the Apartment Association of Metro Denver and the Colorado Division of Housing. The fall apartment rush by University of Colorado students helped drive the Boulder region's third-quarter rate to the 10-year low, said Gordon Von Stroh, a University of Denver professor who wrote the report.
The average vacancy rate across the seven-county Denver metro area was 5.3 percent, which tied a third-quarter rate in 2007 and was the lowest rate since the first quarter of 2001 when the metro average was 4.5 percent, according to the report.
Apartment vacancies at 3-year low in Denver area (11/11/2010)
Metro Denver’s apartment market had its lowest vacancy rate in the third quarter, at 5.3 percent, since the third period of 2007, and an increased average rental rate, a new report shows.
But the market continued to face challenges during the last period, because of lack of local job and wage growth, according to the report by the Apartment Association of Metro Denver and the Colorado Division of Housing.
The metro area’s average apartment vacancy rate dropped to 5.3 percent in the period from 7.4 percent in 2009’s third quarter, and from 6.1 in this year’s second quarter.
Denver-metro apartment vacancies at a three-year low (11/11/2010)
AURORA | The demand for apartments in the metro Denver area is high, and the supply is quickly dwindling.
Apartment vacancies in the Denver metro area are at their lowest rates since the third quarter of 2007, which means the cost of rent will continue to increase as more apartment units will need to be built, analysts say.
Apartment vacancies throughout the Denver metro area this year decreased from 6.1 percent in the second quarter to 5.3 percent in the third quarter, according to a report released Wednesday by the Apartment Association of Metro Denver and the Colorado Division of Housing.
With the exception of Douglas County, vacancy rates fell in all metro Denver counties from the third quarter of 2009 to the same period this year.
Thursday, November 11, 2010
Fewer new foreclosures filed, but more foreclosures going to auction
Click here for full report.
New foreclosure filings fell to 10,587 in Colorado during 2010’s third quarter, falling 15.1 percent from 2009’s third-quarter total of 12,468. According to a report released Thursday by the Colorado Department of Local Affairs’ Division of Housing, 2010’s third quarter filings were also down 3.5 percent from 2010’s second-quarter total of 10,233.
Foreclosure sales at auction, the event that completes the foreclosure process, increased 18.0 percent from the third quarter of 2009 to the same period this year, rising from 5,618 to 6,629. Foreclosure sales also rose 12.6 percent from the second quarter’s total of 5,887 to the third quarter of this year.
According to the report, foreclosure filings for the third quarter remain well below 2009’s third quarter total when statewide foreclosure filings hit the largest total in foreclosure filings yet recorded for Colorado. Since then, foreclosure filings have generally followed a downward trend. Foreclosure sales, however, “have continued along a generally upward trend since the first quarter of 2009.”
During the nine months of 2010, foreclosure filings fell 9.0 percent as compared to the first nine months of 2009, while foreclosure sales at auction rose 28.3 percent during the same period.
All metropolitan counties except Mesa County reported year-over-year drops in foreclosure filings. Comparing the third quarter of 2009 to the same period this year, foreclosure filings in Weld County fell 30.8 percent, while filings fell 23.1 percent in Pueblo County and 22.1 percent in Denver County. Year-over-year, filings rose 20.9 percent in Mesa County.
On the other hand, all metropolitan counties except Weld County reported year-over-year increases in foreclosure sales at auction. Comparing the third quarter of 2009 to the same period this year, foreclosure sales were up 164.0 percent in Mesa County, and were up 44.2 percent in Douglas County. Denver County and Adams County increased only 1.1 percent and 1.8 percent increases, respectively, while Weld County totals dropped 7.2 percent.
Foreclosure sales are opened foreclosures that have proceeded through the full foreclosure process to final sale at public auction. Filings denote the beginning of the foreclosure process, and once a foreclosure is filed, the borrower has at least 110-120 days to work with the lender to avoid a completed foreclosure. It is during this period that borrowers work with lenders and housing counselors to work out loan modifications, short sales, or other ways of withdrawing the foreclosure.
Metro Denver apartment vacancies fall to three-year low
Click here for the released of section I.
Click here for the released portion of section II.
Apartment vacancies in the Denver metro area fell again in the third quarter, dropping to 5.3 percent. According to a report released Wednesday by the Apartment Association of Metro Denver and the Colorado Division of Housing, apartment vacancy rates fell to the lowest rate reported since the third quarter of 2007, falling from 2010’s second-quarter rate of 6.1 percent. The vacancy rate also fell from last year’s third-quarter rate of 7.4 percent. The metro-wide vacancy rate has now fallen for three quarters in a row.
In the past, demand for apartments has tracked closely with job creation, but in recent quarters, demand has been strong in spite of job losses.
Vacancy rates had initially increased following the rapid increase in the unemployment rate in late 2008 and early 2009, rising to 9.0 percent. But the vacancy rate quickly fell below eight percent by the end of 2009, and is now at a three-year low. The last time the metro-wide vacancy rate fell below 5.3 percent was during the first quarter of 2001.
Rents increased for the third quarter in a row as the metro-wide average rent increased from $880.99 to $912.68, or 3.6 percent, from the third-quarter of 2009 to the same period this year. All counties in the metro area reported year-over-year increases in average rents. At 3.6 percent, growth in rents outpaced the most recent Consumer Price Index increase for the Denver area which was 1.7 percent for the first half of 2010.
Tenants continue to see few wage increases, however, and this presents challenges for owners seeking rent increases.
Rental losses due to concessions, discounts and delinquencies rose to 13.6 percent during the third quarter of this year, rising from 10.8 percent during the third quarter of last year. Rental losses are at the highest level experienced since the first quarter of 2007 when rental losses were 14.3 percent of gross rents.
For 2010’s third quarter, the highest vacancy rates were found in Arapahoe County where rates fell year-over-year from 8.5 percent to 6.7 percent. Rates were lowest in the Boulder/Broomfield area where vacancies fell year-over-year from 5.5 percent to 3.5 percent. With the exception of Douglas County, vacancy rates fell in all metro Denver counties from the third quarter of 2009 to the same period this year. The vacancy rate in Douglas County increased slightly year over year from 4.3 percent to 4.4 percent.
2010’s first quarter vacancy rates by county were Adams, 4.4; Arapahoe, 6.7; Boulder/Broomfield, 3.5; Denver, 5.3; Douglas, 4.4; Jefferson, 3.9.
Average rents for all counties were: Adams, $914.71; Arapahoe, $881.97; Boulder/Broomfield, $993.25; Denver, $905.01; Douglas, $1112.52; and Jefferson, $863.99.
The Vacancy and Rent Surveys are a service provided by the Apartment Association of Metro Denver and the Colorado Department of Local Affairs’ Division of Housing to renters and the multi-family housing industry on a quarterly basis. The Colorado Vacancy and Rent Survey reports averages and, as a result, there are often differences in rental and vacancy rates by size, location, age of building, and apartment type. The full Report is available through the Apartment Association of Metro Denver at www.aamdhq.org; and limited information is available online at the Division of Housing web site: http://dola.colorado.gov/cdh/
Thursday, November 4, 2010
Foreclosure Deferment Program in Colorado: November 2010 Update
Re: Foreclosure deferment notification documents required by the Foreclosure Deferment Program (38-38-801, C.R.S.)
The Division of Housing has been notified by housing counselors that some representatives for lenders and servicers have been using posting documents that do not conform to the uniform standards established by the Colorado Division of Housing. Please note that in accordance with 38-38-803, C.R.S. and 38-38-807.5, C.R.S., foreclosure deferment notification documents must conform to the documents and uniform standard provided at the Division of Housing web site.
See here for the Foreclosure Deferment web site.
VIDEO: Employment trends in Colorado and in selected industries and regions
In this weeks video, we look at overall job creation, we look at jobs in the service sector and construction, and we compare the Grand Junction region with the Fort Collins-Loveland region.
Wednesday, November 3, 2010
Homeownership rate falls in US, Colorado
The Census Bureau this week released its quarterly estimate of the homeownership rate in Colorado. According to the report:
The rate is at its lowest level since the second quarter of 1999.
The Census Bureau does not provide quarterly data on homeownership at the state level, so to provide some context, we need to make comparisons using annual numbers.
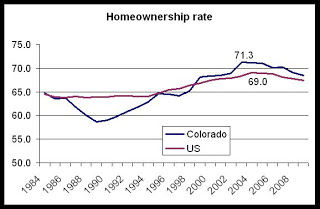
Looking at the annual data, we see that the current trend in quarterly data matches the trend in annual numbers. The 2009 homeownership rate, the most recent available, shows a rate of 67.4 percent for the United States. This compares to a homeownership rate of 68.4 percent in Colorado. The graph below shows that the homeownership rate in the Colorado has exceeded the national rate since 1999.
Colorado's homeownership rate fell well under the national rate during the Colorado recession of the late 1980s, and did not return to match the national rate until the mid 1990s.
Homeownership peaked in Colorado at 71.3 percent during 2003 in Colorado and it peaked at 69.0 percent during 2004 in the United States.
Since then, both the national and the Colorado rate have fallen to 2000 levels. In 2000, the national homeownership rate was 67.4 percent and the Colorado rate was 68.3 percent.
The homeownership rate is likely to continue falling in the United State and in Colorado as long as job growth stalls. The availability of home financing was at historical highs during most of the past decade, and it is unlikely that these conditions will be repeated in the near future.
Homeownership rates near 70 percent are historically unusual.
The homeownership rate of 66.9 percent was 0.7 percentage points (+/-0.4%) lower than the third quarter 2009 rate (67.6 percent) and approximately the same as the rate last quarter (also 66.9 percent).
The rate is at its lowest level since the second quarter of 1999.
The Census Bureau does not provide quarterly data on homeownership at the state level, so to provide some context, we need to make comparisons using annual numbers.
Looking at the annual data, we see that the current trend in quarterly data matches the trend in annual numbers. The 2009 homeownership rate, the most recent available, shows a rate of 67.4 percent for the United States. This compares to a homeownership rate of 68.4 percent in Colorado. The graph below shows that the homeownership rate in the Colorado has exceeded the national rate since 1999.
Colorado's homeownership rate fell well under the national rate during the Colorado recession of the late 1980s, and did not return to match the national rate until the mid 1990s.
Homeownership peaked in Colorado at 71.3 percent during 2003 in Colorado and it peaked at 69.0 percent during 2004 in the United States.
Since then, both the national and the Colorado rate have fallen to 2000 levels. In 2000, the national homeownership rate was 67.4 percent and the Colorado rate was 68.3 percent.
The homeownership rate is likely to continue falling in the United State and in Colorado as long as job growth stalls. The availability of home financing was at historical highs during most of the past decade, and it is unlikely that these conditions will be repeated in the near future.
Homeownership rates near 70 percent are historically unusual.
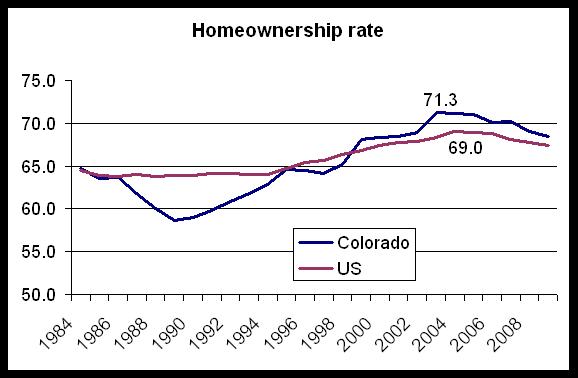
Monday, November 1, 2010
Jefferson County receives $134,250 in HDG funds
The Colorado Department of Local Affairs has announced that $134,250.00 in HDG funds has been awarded to Jefferson County for the following project: The Jefferson Center for Mental Health (JCMH) will receive a grant of $134,250 to rehabilitate Jefferson Apartments, which they purchased in October 2009. It has 11 units - 9 one bedroom apartments and 2 two bedrooms. These apartments will be available to people who receive services at JCMH and who have demonstrated their readiness for independent living. JCMH property management will provide building supervision, and JCMH case managers will support their consumers to ensure their success in this environment. Rehab work will include replacing a 39-year old boiler; bringing the boiler room up to code; replacing single-pane windows & exterior doors; replacing two exterior staircases; repairing concrete & decks; and replacing the roof, gutters & downspouts.
Personal income falls
The BEA has released new national data on personal income:
For the most recent Colorado data on personal income, see our video here.
Personal income decreased $16.8 billion, or 0.1 percent, and disposable personal income (DPI) decreased $20.3 billion, or 0.2 percent, in September, according to the Bureau of Economic Analysis. Personal consumption expenditures (PCE) increased $17.3 billion, or 0.2 percent. In August, personal income increased $54.4 billion, or 0.4 percent, DPI increased $47.9 billion, or 0.4 percent, and PCE increased $52.5 billion, or 0.5 percent, based on revised estimates.
Real disposable income decreased 0.3 percent in September, in contrast to an increase of 0.2 percent in August. Real PCE increased 0.1 percent, compared with an increase of 0.3 percent.
For the most recent Colorado data on personal income, see our video here.
Subscribe to:
Posts (Atom)