Click here for tables.
See here for historical information.
Apartment vacancies in the Denver metro area fell again in the first quarter, dropping to 6.5 percent. According to a report released Friday by the Apartment Association of Metro Denver and the Department of Local Affairs’ Division of Housing, apartment vacancy rates fell to the lowest rate reported since the third quarter of 2008, falling from 2009’s fourth-quarter rate of 7.7 percent. The vacancy rate during the first quarter of last year was 8.4 percent.
In recent years, vacancy rates have tracked closely with the unemployment, illustrating a close connection between job growth and demand for apartments. In recent quarters, however, vacancy rates have remained low in spite of rising unemployment.
“In spite of the economy, there’s still relatively strong demand for rental housing right now,” said Lauren Brockman, a principal with Orion Real Estate Services. “Unemployment here is comparatively low compared with much of the nation, so people are staying here. And we’re also seeing people come in from out of state, so even with limited job growth, people want to be here, and many of them need apartments.”
Vacancy rates during the most recent recession contrast sharply with the 2002-2003 recession in Colorado. Vacancy rates peaked at 13.1 percent during the first and second quarters of 2003, but during the most recent recession, vacancy rates rose to only 9.0 percent during the second quarter of 2009.
Multifamily experts note that vacancy rates have been kept down by low numbers of new apartments added in the Denver metro region.
“We added almost 8,000 new units in 2001 and more than 9,000 in 2002, so that lead to quite a few vacancies as unemployment rose in 2003,” said Terrance Hunt, a broker with Apartment Realty Advisors. “But we’re facing a much different situation now. Between 2003 and 2009 fewer than 3,000 new units were added each year, so we may be looking at some pretty tight markets in the near future.”
For 2010’s first quarter, the highest vacancy rates were found in Arapahoe County where rates fell year-over-year from 9.7 percent to 7.2 percent. Rates were lowest in Douglas County where vacancies fell year-over-year from 7.1 percent to 4.4 percent. Vacancy rates fell in all metro Denver counties form the first quarter of 2009 to the same period this year.
2010’s first quarter vacancy rates by county were Adams, 6.8; Arapahoe, 7.2; Boulder/Broomfield, 5.0; Denver, 6.9; Douglas, 4.4; Jefferson, 5.8.
In general, a vacancy rate of 5 percent is considered the “equilibrium” rate. Rates below 5 percent indicate tight markets.
Average rents across the Denver metro area were largely stable. The overall average rent in the metro Denver area fell to $877.16, down from $881.92 during the first quarter of last year. Rents rose slightly from 2009’s fourth-quarter average rent of $875.39.
“Without job growth, and with renters looking to cut costs, it’s been difficult for owners to raise rents very much” said Ryan McMaken, a spokesperson with the Colorado Division of Housing. “However, once we see some job growth, demand should spur some significant rent increases.”
“Rental losses for owners from discounts and concessions are up compared to last year,” Brockman said. Concessions include offering tenants free rent for a month in return for signing a lease.
When compared to the first quarter of 2009, Adams County, Douglas County and Jefferson County reported increases in overall average rents, while average rents in Arapahoe and Denver counties fell.
Average rents in the Boulder/Broomfield were essentially unchanged as average rents increased by four dollar to $946.60.
The highest average rent was reported in Douglas County at $1055.12, and the lowest was reported in Arapahoe County at $833.94. Average rents for all counties were: Adams, $874.56; Arapahoe, $841.03; Boulder/Broomfield, $946.60; Denver, $883.87; Douglas, $1055.12; and Jefferson, $833.94.
The Vacancy and Rent Surveys are a service provided by the Apartment Association of Metro Denver and the Colorado Department of Local Affairs’ Division of Housing to renters and the multi-family housing industry on a quarterly basis. The Colorado Vacancy and Rent Survey reports averages and, as a result, there are often differences in rental and vacancy rates by size, location, age of building, and apartment type. The full Report is available through the Apartment Association of Metro Denver at www.aamdhq.org; and limited information is available online at the Division of Housing web site: http://dola.colorado.gov/cdh/
Thursday, April 29, 2010
Wednesday, April 28, 2010
NSP Update: new Aurora "deconstruction" project
Media Contact: Kathy Cable, Senior Public Information Officer
Office: 303-739-7013, Mon - Fri, 8 a.m. - 5 p.m.
Cell: 303-913-5893, after hours & weekends
Email: [email protected]
Date: April 26, 2010
Media is invited to the kick off of the project at 10 a.m., April 29, at 765 Joliet St. in Aurora
From Destruction to Construction
AURORA, Colo. - Sometimes to create something new, you have to tear down something old. But from that demise, springs hope for a family needing a place to call home.
The city of Aurora’s Community Development Division is providing funds to Habitat for Humanity of Metro Denver through a state-funded Neighborhood Stabilization Program (NSP1) grant to acquire and demolish approximately eight foreclosed and blighted residential properties. Habitat will then construct modern, affordable and energy-efficient homes in their places. Construction will take place over the next 12-18 months. These state NSP funded projects are the first of their kind in Aurora.
On April 29, students from Cherry Creek Schools BETA, SWAP and Transitions programs will work under the supervision of Zachary Burnside Deconstruction (ZBD) to deconstruct the house at 765 Joliet Street in Aurora. The Cherry Creek Schools Deconstruction Program was developed based upon the National Center for Craftsmanship model. (Programs described on page 2)
It will take about 30 days to deconstruct the house. Afterwards, Habitat will construct a new home. Students will receive 10 hours of OSHA training and through Workforce Investment Act funds will be paid an hourly wage by Arapahoe County, through the Arapahoe/Douglas Works! Workforce Center.
The partnership with Cherry Creek Schools is not a standard part of the general NSP grant activities, but was identified as a potentially great way to accomplish a number of goals, some of which extend beyond NSP - such as youth education, job training, and the environmentally friendly practice of deconstruction.
Much of the material removed from the house during deconstruction will be recycled or reused, saving precious landfill space and natural resources. Some of the materials may find their way to Habitat’s home Improvement Outlets. The sale of these materials to the general public will help support Habitat’s on-going efforts to build additional homes. Materials that cannot be diverted from landfills will be disposed of in accordance with all environmental requirements.
Tuesday, April 27, 2010
Tiny apartment has 24 rooms
In Hong Kong, because of the space, apartments are small and expensive. Gary Chang, an architect, decided to design a 344 sq. ft. apartment to be able to change into 24 different designs, all by just sliding panels and walls. He calls this the "Domestic Transformer."
Denver-area home prices rise 3.6 percent in February
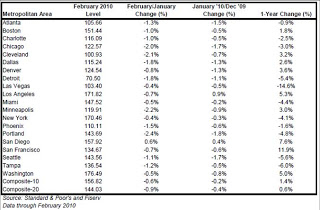
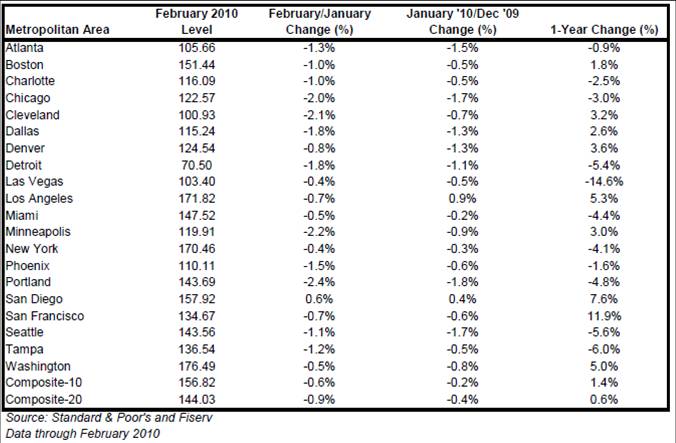
Denver-area home prices rose 3.6 percent in February, coming in fourth in a 20-city index of metropolitan home prices in the U.S.
According to Standard and Poor's Case-Shiller Home Price index for February, only San Francisco, San Diego and Los Angeles showed larger price increases with rises of 11.9 percent, 7.6 percent and 5.3 percent, respectively.
The Denver home price increase of 3.6 percent measures the year-over-year increase from February 2009 to February 2010. Denver-area home prices fell 0.8 percent from January 2010 to February 2010 after falling 1.3 percent from December 2009 to January 2010.
Home prices in the Denver area continue to benefit from relatively low unemployment as compared to the nation overall.
Nationally, the Case-Shiller indices show that the annual rates of decline of the 10-City and 20-City Composites improved in February compared to January 2010. For the first time since December 2006, the annual rates of change for the two Composites are positive. The 10-City Composite is up 1.4% from where it was in February 2009, and the 20-City Composite is up 0.6% versus the same time last year. However, 11 of 20 cities saw year-over-year declines.
The annual returns of the 10-City and 20-City Composite Home Price Indices show an increase of 1.4% and 0.6%, respectively, in February 2010 compared to the same month last year. Eighteen of the 20 metro areas and both Composites showed an improvement in their annual rates with this month's readings compared to the January 2010 figures; with Dallas and Portland being the exceptions.
"Beginning last November, each report showed gains as fewer cities reported year-over-year declines than in the previous month; those gains ended with this report. Further, in six cities prices were at their lowest levels since the prices peaked three-to-four years ago. These data point to a risk that home prices could decline further before experiencing any sustained gains. While the year-over-year data continued to improve for 18 of the 20 MSAs and the two Composites, this simply confirms that the pace of decline is less severe than a year ago. It is too early to say that the housing market is recovering," says David M. Blitzer, Chairman of the Index Committee at Standard & Poor's. "Nineteen of the 20 MSAs and both Composites declined in February over January. Fourteen of the MSAs and both Composites have now fallen for at least four consecutive months. In addition, prices reached recent new lows for six cities in February - Charlotte, Las Vegas, New York, Portland, Seattle and Tampa - sending a more cautionary message compared to the annual figures. While 14 MSAs and the two composites show improvement over their trough values reached in the spring 2009, we are not completely out of the woods.
"Existing and new home sales, inventories and housing starts all show tremendous improvement in their March statistics. The homebuyer tax credit, available until the end of April, is the likely cause for these encouraging numbers and this may also flow through to some of our home price data in the next few months. Amidst all the news, however, we should also pay heed to foreclosure activity, which have reached their highest level in at least the last five years. As these homes are put up for sales, we may see some further dampening in home prices."
As of February 2010, average home prices across the United States are at similar levels to where they were in late summer/early autumn of 2003. From their peak in June/July of 2006 through the trough in April 2009, the 10-City Composite is down 33.5% and the 20-City Composite is down 32.6%. The peak-to-date figures through February 2010 are -30.7% and -30.3%, respectively.
San Diego was the only market that continued to show improvement in home prices between January and February. All other metros and the two composites showed declines from their January levels, some of these being fairly significant, with 12 of the MSAs falling by at least 1.0% during the month. Six of the MSAs - Charlotte, Las Vegas, New York, Portland, Seattle and Tampa - posted new index lows as measured in the current housing cycle where, depending on the market, we saw peaks in 2006 and 2007. The two latest markets to post new index lows, New York and Portland, showed peak-to-February declines of -21% and -23.0%, respectively.
Charlotte and Cleveland have shown seven consecutive months of negative monthly returns. Atlanta, Boston, Denver, New York and Tampa are not far behind, with six consecutive negative prints. Six of the 20 MSAs - Atlanta, Denver, Las Vegas, San Diego, Seattle and Washington DC - showed some improvement in monthly returns compared to the prior month.
The table below summarizes the results for February 2010. The S&P;/Case-Shiller Home Price Indices are revised for the 24 prior months, based on the receipt of additional source data. More than 23 years of history for these data series is available, and can be accessed in full by going to www.homeprice.standardandpoors.com
Thursday, April 22, 2010
BEA releases personal income estimates for all Colorado counties
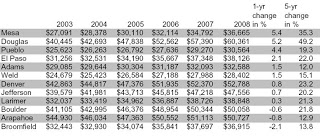
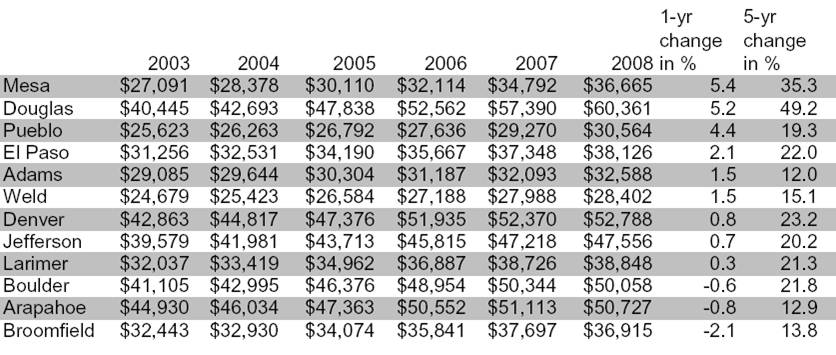
Pitkin County topped all Colorado counties for personal income in 2008 in Colorado. According to new estimates released today by the Bureau of Economic Analysis, Pitkin topped the state with a per capita personal income of $92,680 in 2008. Crowley county showed the lowest per capita personal income at $14,553. Income is not adjusted for inflation.
Costilla County also showed the largest increase in per capita personal income from 2007 to 2008 rising 12.6 percent. Logan County was second with per capita income increasing 7.5 percent from 2007 to 2008.
Among metropolitan counties, Mesa County and Douglas County experienced the largest increases in per capita personal income, with incomes increasing 5.3 percent and 5.1 percent, respectively. Pueblo County was third place behind Douglas County with an increase of 4.4 percent during the same period.
Fifteen counties reported declines in per capital personal income from 2007 to 2008. Among metropolitan counties, Boulder, Arapahoe and Broomfield counties showed declines in income with drops of 0.5 percent, 0.7 percent, and 2.0 percent, respectively.
Rural resort and mountain counties were common among counties with declining per capita personal income. Gilpin, Gunnison, Eagle, Routt, Summit, Dolores, Ouray and Pitkin counties all reported decreases in per capita income ranging from a drop of 0.1 percent in Gilpin County to a drop of 3.1 percent in Pitkin County. However, it should be noted that all of these counties showed increases in per capital personal income when measured over five years instead of one year.
The largest declines in per capita personal income from 2007 to 2008 were found in Kiowa and Cheyenne Counties with drops of 6.8 percent and 8.8 percent, respectively.
Per capita income is total county income divided by population. Population estimates are base on mid-year estimates of population provided by the Census Bureau. Income is not adjusted for inflation.
Since estimates represent economic and demographic conditions from mid-year 2008, estimates do not show the effects of job losses that accelerated during the second half of 2008. Estimates for 2009 are likely to show much weaker growth in income between 2008 and 2009 as compared to growth between 2007 and 2008.
Monday, April 19, 2010
FAIR HOUSING FORUM: RIGHTS, RESPONSIBILITIES AND RESOURCES
ARAPAHOE AND DOUGLAS COUNTIES TO HOST
FAIR HOUSING FORUM: RIGHTS, RESPONSIBILITIES AND RESOURCES
April is Fair Housing Month, a time to celebrate the progress made in providing housing opportunities to every citizen of this nation, regardless of race, gender, color, nationality, religion, family status, or disability.
It is also a time to acknowledge the fair housing challenges that still remain, and collectively commit to finding viable solutions to those challenges.
Illegal housing discrimination can take many forms, some quite subtle:
· realtors showing apartments or homes only in certain neighborhoods,
· advertising housing only to preferred groups of people
· refusals to make reasonable accommodation for persons with disabilities
Douglas and Arapahoe Counties are collaborating to raise awareness of this critical issue and to help educate our citizens of their rights and responsibilities through an all-day Fair Housing Forum.
Speakers include representatives from:
· U.S. Department of Housing and Urban Development Office of Fair Housing and Equal Opportunity
· The Colorado Civil Rights Division
· BBC Research and Consulting
· The Law Firm of Hopkins Tschetter Sulzer
· Community Housing Services
Special guests include HUD Region 8 Director Rick Garcia who will introduce General Deputy Assistant Secretary of the Office of Fair Housing and Equal Opportunity, Bryan Greene, who will address the forum during the plenary luncheon.
The Forum will be held on April 29, 2010, 9:00 a.m. - 4:30 p.m., with an evening session from 5:30-7:00 p.m. for renters and homeowner’s associations, in the Arapahoe County Building, located at 1690 W. Littleton Blvd. in the City of Littleton. A continental breakfast and lunch will be provided. RSVP by April 27, is required. Please specify attendance at the day or evening session, and if you require special accommodations for this event. RSVP with Pam DeBoth, at 303-738-7926, or by email to [email protected].
Colorado Springs area vacancies fall to 8-year low
Click here for report.
Apartment vacancy rates in the Colorado Springs area fell to 6.9 percent during the first quarter of 2010, falling to the lowest vacancy rate reported since 2001. According to a report released today by the Apartment Association of Southern Colorado and the Colorado Department of Local Affairs’ Division of Housing, overall vacancies fell in the Colorado Springs area from a rate of 11.7 reported during the first quarter of 2009, and fell from 2009’s fourth quarter rate of 8.7 percent.
The first quarter’s rate of 6.9 percent is the lowest vacancy rate recorded since the third quarter or 2001 when vacancies were 5.4 percent. The vacancy rate rose to 8.9 percent during the fourth quarter of 2001, and remained above eight percent for the following eight years.
“Increases in the local troop population have now clearly had an impact in Colorado Springs,” said Gordon Von Stroh, professor of Business at the University of Denver, and the report’s author. “Also, with so little recent new construction of multifamily units in the area, the market will likely remain tight for a while.”
Year over year, vacancy rates fell significantly in the “Northwest” and the “Far Northeast” market areas of Colorado Springs where vacancy rates were more than cut in half to 5.1 percent and 4.5 percent respectively.
In the “Security/Widefield/Fountain” market area, where vacancy rates have often risen above 20 percent in recent years, vacancies fell to 14.2 percent, a four-and-a-half year low. All market areas reported lower vacancy rates for the first quarter of 2010 as compared to the same time last year.
In response to falling vacancies, average rents have increased, but at a moderate pace. The average rent for the first quarter of 2010 was $710.07, which is a slight drop from 2009’s fourth quarter average rent of 711.66, and average rents remain below the most recent high of $717.65 reported during the second quarter of last year. Nevertheless, the first quarter’s average rent is the highest first quarter rent level ever recorded.
“Average rents have increased in the area, but a lack of job growth across the region will keep some downward pressure on rents,” said Ryan McMaken, a spokesman for the Colorado Division of Housing. “March employment data shows that the unemployment rate in the region was unchanged since February, so rent increases are likely being tempered by limited wage growth.”
The area that reported the highest average rents was the “Far northeast” region with an average rent of $811.14, and the area with the lowest average rent was the “Southeast” region with an average rent of $598.86
Apartment Realty Advisors is also a major sponsor of this report. The Vacancy and Rent Surveys are a service provided by the Colorado Department of Local Affairs’ Colorado Division of Housing and the Apartment Association of Southern Colorado to renters and the multi-family housing industry on a quarterly basis. The Colorado Springs Area Vacancy and Rent Survey reports averages and, as a result, there are often differences in rental and vacancy rates by size, location, age of building, and apartment type. For more information, please contact the Apartment Association of Southern Colorado at http://www.aacshq.org ; or please visit the Colorado Division of Housing web site: http://dola.colorado.gov/cdh/
# # #
Friday, April 16, 2010
Jobless rate climbs to 8.4 percent
The unemployment rate (not-seasonally-adjusted) in Colorado rose to 8.4 percent during March, but total employment grew for the first time since July 2009. In data released today by the U.S. Bureau of Labor Statistics and the Colorado Department of Labor and Employment, 5,600 new jobs were added to the Colorado economy. However, over the same period, the total labor force grew by more than 8,300. With labor force growth outpacing job growth, the jobless rate increased.
The unemployment rate grew year over year, increasing from a rate of 7.9 percent in March 2009 to 8.4 percent last month. The rate also increased from February 2010's unemployment rate of 8.3 percent.
Since March 2009, Colorado has lost more than 64,000 jobs, and the state has lost more than 197,000 jobs since the peak of the market during July 2008.
Unemployment rates varied by metropolitan area in Colorado. The metropolitan areas with the highest rates were Grand Junction and Greeley with rates of 10.3 percent and 9.9 percent, respectively. The Boulder-Longmont area and the Fort Collins-Loveland areas reported the lowest metropolitan unemployment rates at 6.4 percent and 7.1 percent, respectively. The Denver-Aurora area's unemployment rate in March was 8.5 percent.
The seasonally adjusted unemployment rate for Colorado during March was 7.9 percent.
Nationally, regional and state (seasonally-adjusted) unemployment rates were little changed in March. Twenty-four states recorded over the-month unemployment rate increases, 17 states and the District of Columbia registered rate decreases, and 9 states had no rate change, the U.S. Bureau of Labor Statistics reported today. Forty-four states and the District of Columbia recorded jobless rate increases from a year earlier, 5 states had decreases, and 1 state had no change. For the third consecutive month, the national unemployment rate was 9.7 percent, up from 8.6 percent in March 2009. In March, nonfarm payroll employment increased in 33 states and the District of Columbia and decreased in 17 states.
Four states—Colorado, Montana, Nebraska, and Virginia—reported statistically significant over-the month unemployment rate increases in March (+0.2 percentage point each). Massachusetts was the only state to record a significant over-the-month jobless rate decrease (-0.2 percentage point). The District of Columbia also posted an appreciable rate decrease from a month earlier (-0.3 percentage point). The remaining 45 states registered jobless rates that were not measurably different from those of a month earlier, though some had changes that were at least as large numerically as the significant changes.
The West reported the highest regional jobless rate in March, 11.0 percent, while the Northeast recorded the lowest rate, 9.1 percent. The rate in the West set a new series high. (All region, division, and state series begin in 1976.) No region experienced a statistically significant over-the-month unemployment rate change. All four regions registered significant rate increases from a year earlier: the West (+1.5 percentage points), South (+1.4 points), Northeast (+1.3 points), and Midwest (+1.0 point).
Thursday, April 15, 2010
Colorado Springs vacancy and rent data to be released Monday
The report will be posted here on the blog on Monday.
Local economy 'expanded moderately' in March, says Fed
The economy of the Tenth District of the Federal Reserve System, which includes Colorado, "expanded moderately" during March. According to the "Beige Book" of the Federal Reserve Bank of Kansas City, "Warmer weather conditions led to increased retail traffic and supported a modest rebound in consumer spending, generating some optimism among District contacts."
The Beige Book, which summarizes economic commentary from businesses "and other contacts" from the district, provided a view of the local economy that could best be described as highly restrained optimism.
Highlights of the report:
* Retailers reported higher than expected sales and were optimistic that business activity would continue to recover.
* Producer expectations for future factory activity improved with sustained growth in new order volumes. Employment levels held steady during the survey period, but more manufacturers planned to increase payrolls over the next six months.
* Residential real estate activity strengthened in March, while commercial real estate activity weakened further. Residential builders reported an upswing in building starts after the harsh winter. In contrast, commercial real estate activity remained well below year-ago levels. Contacts also noted that few new construction projects had qualified for financing due to continued tight credit conditions.
* Overall loan demand declined at a slightly faster pace than in the previous survey. Demand for commercial and industrial loans and commercial real estate loans fell moderately. Demand also declined somewhat for residential real estate loans and consumer installment loans.
* Energy activity expanded during the survey period, and additional modest gains were expected in the coming months. After rising in March, the number of active rigs in the District approached year-ago levels. Several firms planned to hire additional staff, primarily engineers and skilled labor.
* Agricultural conditions improved since the last survey period. Livestock prices strengthened in March boosting profitability, especially for cattle producers, and prices were expected to rise further with smaller supplies. Crop prices edged down in March with the prospects of increased plantings and bumper crops.
* Wages held steady since the last survey period, and some factories considered raising selling prices in coming months as raw materials prices rose further. Contacts reported little wage pressure in District labor markets, and most companies hiring new workers were not offering higher salaries to attract qualified applicants.
The Federal Reserve Bank of Kansas City covers the 10th District of the Federal Reserve, which includes Colorado, Kansas, Nebraska, Oklahoma, Wyoming, and portions of western Missouri and northern New Mexico.
Prices in U.S. west rise 1.6 percent in March
Prices in the "west" region of the United States, including Colorado and other western states, rose 1.6 percent year-over-year, led by increases in prices in transportation and medical care. According to new Consumer Price Index information for all urban consumers (CPI-U) released today by the Bureau of Labor Statistics, prices in transportation and medical care rose year-over-year 12.7 percent and 3.8 percent, respectively.
From February to march of this year, prices rose 0.3 percent.
Overall price increases in the region were mitigated by price drops in recreation, apparel and housing. Recreation prices fell 2.2 percent, year over year, while prices in apparel and housing fell 2.1 and 1.5 percent, respectively.
Nationally, prices increased 0.1 percent in March. Over the last 12 months, the index increased 2.3 percent before seasonal adjustment. The seasonally adjusted increase in the all items index was mostly due to an increase in the fresh fruits and vegetables index, which rose 4.6 percent in March and accounted for over 60 percent of the all items increase. Other food at home indexes were mixed and the index for food away from home was unchanged.
The index for energy and for all items less food and energy were both unchanged in March. Within energy, an increase in the electricity index was offset by declines in the indexes for gasoline and natural gas. Within all items less food and energy, the indexes for medical care, new vehicles, and used cars and trucks posted increases, while the indexes for shelter, household furnishings and operations, and apparel declined.
Much of the increase in March's CPI is reflected in increases in gasoline prices that are significant in Colorado. According to the American Automobile Association, The highest price ever recorded for regular gas in Denver was $4.00-6/10ths a gallon on July 17, 2008. In April 12, 2009, regular cost $1.97 a gallon.
Gas prices rose throughout March, and on April 12 in Colorado, the average price of regular gas was about $2.73, AAA says, while mid-grade is $2.92, premium $3.05 and diesel $2.94.
Nationally, gasoline prices rose 15.9 percent in the 6-month period ending in March 2010, according to the BLS.
Colorado ranked among states with fewest delinquent mortgage loans
As of February 2010, Coloradans are delinquent on 6.7 percent of their mortgage loans. According to a report released today by Lender Processing Services, a leading provider of mortgage performance data and analytics, the total number of delinquent loans nationally was 21.3 percent higher than the same period last year. Although the data showed a small 1.45 percent seasonal decline in delinquencies from January 2010 to February 2010 month-end, the national delinquency rate still stood at 10.2 percent. The report is based on data as of February 2010 month-end.
In Colorado, 7.6 percent of mortgage loans were delinquent and 1.8 percent of loans were in foreclosure, for a total of 8.5 percent of loans that are non-current.
These rates place Colorado behind only seven other states in having the lowest rate for the total number of non-current loans. Vermont, Montana, Nebraska, Wyoming, Alaska, South Dakota and North Dakota had lower rates of non-current loans. The lowest rate was found in North Dakota where only 4.7 percent of loans were non-current and 0.8 percent of loans were in foreclosure.
The highest rates of non-current loans were found in Florida, Nevada, and Arizona where non-current loan rates were 23.8 percent, 23.3 percent and 16.3 percent, respectively.
Nationally, foreclosure inventories reached record highs. February's foreclosure rate of 3.31 percent represented a 51.1 percent year-over-year increase. The percentage of new problem loans also remains at a five-year high. The total number of non-current first-lien mortgages and REO properties is now more than 7.9 million loans. Furthermore, the percentage of new problem loans is also at its highest level in five years. More than 1.1 million loans that were current at the beginning of January 2010 were already at least 30 days delinquent or in foreclosure by February 2010 month-end.
As a result of the federal government's Home Affordable Modification Program (HAMP), delinquent loans that were modified and that remained current through HAMP's three-month trial period - called "cures-to-current" - have increased. Advanced delinquency rolls, however, remain elevated from a historical perspective.
LPS manages the nation's leading repository of loan-level residential mortgage data and performance information from approximately 40 million loans across the spectrum of credit products. The company's research experts carefully analyze this data to produce dozens of charts and graphs that reflect trend and point-in-time observations for LPS' monthly Mortgage Monitor Report.
Grand Junction and Colorado Springs home prices fall most in 4th quarter
Metropolitan home prices in Colorado, based on home sales and on mortgage refinances, showed declines in all metro areas of Colorado. According to the Federal Housing and Finance Agency's fourth quarter 2009 home price report, Grand Junction and Colorado Springs showed the largest declines in home prices with drops of 5.63 percent and 3.21 percent, respectively.
The Denver-Aurora area showed the smallest decrease with a fall of 1.37 percent, with Fort Collins-Loveland showing a virtually identical drop of 1.38 percent.
The overall Colorado index, based only on home sales and excluding refinances, showed continued declines in the Colorado home price index. Since the Colorado index peaked during the second quarter of 2007, the index has fallen 4 percent, but it has risen 2.3 percent since the fourth quarter of last year.
Although home values across the state are down year-over-year, Colorado metro areas have performed much better compared to five years ago. Comparing to the fourth quarter of 2004, Grand Junction showed the largest gains with home prices rising 32.4 percent, while Colorado Springs showed gains of 5.8 percent. Only the Greeley area showed home price losses over five years with a 5-year drop of 10.7 percent.
It is likely that Grand Junction's substantial home price increase over the past five years reflects a delayed downturn in the real estate markets given the prevalence of oil and gas activity that continued into 2008 while much of the state was experiencing significant declines in home sales activity and high numbers of foreclosures.
Greeley's value losses over five years reiterate the fact that Greeley was one of the earliest communities to feel the impact of foreclosures and declining demand for for-sale housing.
For all metro areas, the one year percent changes were Colorado Springs, -3.21 percent; Denver-Aurora, -1.37 percent; Fort Collins-Loveland, -1.37 percent; Grand Junction, -5.63 percent; Greeley, -2.25 percent; Pueblo, -3.13 percent.
For all metro areas, the five year percent changes were Colorado Springs, 5.82 percent; Denver-Aurora, 1.73 percent; Fort Collins-Loveland, 1.96 percent; Grand Junction, 32.38 percent; Greeley, -10.72 percent; Pueblo, 2.35 percent.
Nationwide, U.S. house prices fell slightly in the fourth quarter of 2009 according to the index. The index, calculated using home sales price information from Fannie Mae and Freddie Mac-acquired mortgages, was 0.1 percent lower on a seasonally adjusted basis in the fourth quarter than in the third quarter of 2009. Over the year ending with the fourth quarter of 2009, seasonally adjusted prices fell 1.2 percent.
FHFA’s seasonally adjusted monthly index for December was down 1.6 percent from its November value, reversing price increases over the prior months. The monthly change from October to November was revised downward to +0.4 percent, from an initial estimate of +0.7 percent.
While the national, purchase-only house price index fell 1.2 percent from the fourth quarter of 2008 to the fourth quarter of 2009, prices of other goods and services rose 1.9 percent. Accordingly, the inflation-adjusted price of homes fell approximately 3.1 percent over the latest year.
Denver home prices up 2.6 percent in January
Denver area home prices rose 2.6 percent during January compared to a year earlier. According to the Janaury 2010 Case-Shiller home price index of 20 cities, Denver experienced the sixth largest increase in home prices. The city with the largest increase was San Francisco at 9.0 percent, followed by Dallas at 4.1 percent. Las Vegas showed the largest drop in home prices with a decline of 17.4 percent. Prices in detroit and Tampa both fell 7.4 percent.
Month over month comparisons for Denver showed a price drop as prices fell 1.3 percent. Prices also fell from November to December with a drop of 0.8 percent.
The growth in home prices for Denver comes at a time when, nationally, new home sales have hit record lows, and major servicers such as Bank of America have begun to engage in large reductions in principal for some mortgages. For more than 18 months, Denver has been part of a small number of major cities that have shows resistance to major price declines.
January price statistics provided by the Colorado Association of Realtors earlier this month showed a year-over-year price increase of 16.2 percent. The Realtor data includes only properties listed in the Metrolist sales database, and thus excludes new home sales any properties not sold with a Realtor. However, the upward movement in January prices for both the Realtor and case-Shiller data indicates that the demand for housing strengthened in January.
Nationally, data through January 2010, released yesterday by Standard & Poor’s for its S&P;/Case-Shiller1 Home Price Indices, show that the annual rates of decline of the 10-City and 20-City Composites improved in January compared to December 2009. In fact, the 10-City Composite is unchanged versus where it was a year ago, and the 20-City Composite is down only 0.7% versus January 2009. Annual rates for the two Composites have not been this close to a positive print since January 2007, three years ago.
As of January 2010, average home prices across the United States are at similar levels to where they were in the autumn of 2003. From the peak in June/July of 2006 through the trough in April 2009, the 10-City Composite is down 33.5% and the 20-City Composite is down 32.6%. The peak-to-date figures through January 2010 are -30.2% and -29.6%, respectively. Los Angeles and San Diego showed slight improvements in actual index levels from the previous month to the current month. All other metros and the two composites showed a slight drop from their December 2009 levels. Of that, four markets - Charlotte, Las Vegas, Seattle and Tampa - posted new index lows as measured by the current housing cycle where, depending on the market, we saw peaks in 2006 and 2007.
The peak-to-current declines for these MSAs are -13.8%, -55.8%, -24.6% and -42.0%, respectively. On a relative basis, Washington DC, Los Angeles and New York have held up the most, with each of those markets still 70% above their January 2000 levels. Las Vegas, which once stood 135% above its January 2000 level, is now showing price increases about 4% above that same level. Detroit remains that one market whose average value is below 2000, approximately 28% below that value.
Personal income falls in Colorado
Personal income in Colorado fell during the fourth quarter of 2009, dropping 1.2 percent from the fourth quarter of 2008, and 0.95 percent from 2009's third quarter. According to a report released by the Bureau of Economic Analysis last week, total personal income in Colorado fell $2.5 billion year-over-year to a total of $209 billion during the fourth quarter of 2009. Colorado has shed 4.8 billion dollars in personal income since it peaked during the third quarter of 2008 at $213.9 billion.
Declines in personal income mirror continued job losses as employment growth continues to be negative and unemployment has slowly increased. The not-seasonally-adjusted unemployment rate rose in February to 8.3 percent, up from 7.8 percent a year earlier. Of all states, Colorado experienced the 17th largest decline in personal income.
Nationwide, state personal income declined an average 1.7 percent in 2009, according to estimates released today by the U.S. Bureau of Economic Analysis. The annual percentage change in state personal income ranged from -4.8 percent in Nevada to 2.1 percent in West Virginia (one of six states with a personal income gain in 2009). Inflation, as measured by the national price index for personal consumption expenditures, fell to 0.2 percent in 2009 down from 3.3 percent in 2008.
In the states with the largest personal income declines in 2009, the industries with the largest earnings losses typically reflected the states' distinctive economies: Nevada's 4.8 percent personal income decline, the second largest decline among states since 1969, is mostly accounted for by construction and the accommodations industry (which includes casino hotels). The biggest contributors to Wyoming's 3.9 percent personal income decline were mining (including oil and gas extraction) and construction. In New York, where personal income fell 3.4 percent, the earnings losses were primarily concentrated in the finance industry.
The biggest earnings decline in Connecticut was also in the finance industry, but manufacturing and construction declined almost as much. Michigan's 3.0 percent personal income decline reflected large losses in durable goods manufacturing. The industries contributing the most to the 2.5 percent fall in personal income in California, and the 2.7 percent fall in Arizona and Florida were construction and manufacturing. Farming can account for all of South Dakota's 3.5 percent personal income decline.
Like Wyoming, Colorado has been impacted by declines in oil and gas extraction. Colorado also continues to see significant declines in incomes among workers in real estate services and home building.
Colorado unemployment rises to 8.3 percent
Unemployment in Colorado in February rose to 8.3 percent, increasing from February 2009's rate of 7.6 percent. The unemployment rate during January 2010 was also 8.3 percent. According to new jobs data released last week by the Colorado Department of Labor and Employment, Colorado has lost 203,000 jobs since the peak of the labor market in July 2008, and the state has shed 87,300 jobs since February of last year. More than 119,000 people have left the labor force since labor force size peaked during July 2008.
The unemployment rate fell from July to October of last year, but employment totals have consistently trended downward since July 2008. Fewer than 600 jobs were lost in the not-seasonally-adjusted data, demonstrating some stability in the job markets in the short term.
Colorado's seasonally-adjusted unemployment rate was 7.7 percent.
Nationally, regional and state unemployment rates were little changed or slightly higher in February. Twenty-seven states recorded over-the-month unemployment rate increases, 7 states and the District of Columbia registered rate decreases, and 16 states had no rate change, according to the U.S. Bureau of labor statistics. Over the year, jobless rates increased in 46 states and the District of Columbia and declined in 4 states. The national unemployment rate in February, 9.7 percent, remained unchanged from January, but was up from 8.2 percent a year earlier.
In February, nonfarm payroll employment decreased in 27 states and the District of Columbia and increased in 23 states. The largest over-the-month decrease in employment occurred in Virginia (-32,600), followed by California (-20,400), Michigan and Pennsylvania (-16,000 each), Maryland (-13,800), and Texas (-13,000). Alaska experienced the largest over-the-month percentage decrease in employment (-1.0 percent), followed by Virginia (-0.9 percent) and Arkansas, the District of Columbia, and Maryland (-0.6 percent each). The largest over-the-month increase in employment occurred in Florida (+26,300), followed by New York (+5,800), Alabama (+5,600), Wisconsin (+5,200), Nevada (+5,100), and South Carolina (+5,000). Nevada experienced the largest over-the-month percentage increase in employment (+0.5 percent), followed by Florida and New Hampshire (+0.4 percent each) and Alabama, South Carolina, and Vermont (+0.3 percent each). Over the year, nonfarm employment decreased in 49 states and increased in 1 state and the District of Columbia. The largest over-the-year percentage decreases occurred in Nevada (-5.2 percent), Wyoming (-4.4 percent), California (-4.1 percent), and Arizona (-4.0 percent).
Job losses mirrored declines in personal income reported in Colorado for the fourth quarter of 2008.
Denver-Boulder-Greeley prices fall, but recent regional data shows rising prices
The Consumer Price Index for All Urban Consumers (CPI-U) for the Denver-Boulder-Greeley, Colo. metropolitan area decreased 0.7 percent from the second half of 2008 to the second half of 2009 the U.S. Bureau of Labor Statistics reported recently. The index was driven down by significant declines in transportation and food and beverages accompanied by a smaller decline in housing.
However, prices in the "West" region of the United States, which includes Colorado, rose in February. Prices in the West rose 0.1 percent since January 2010, and rose 1.4 percent year over year.
Regional price increases in 2010, contrasted with price declines in Denver-Boulder-Greeley found during the second half of 2009, suggest that prices are responding to 2009's fourth quarter increase in GDP of 5.6 percent. However, a lack of job growth will likely continue to put downward pressure on prices.
Denver-Boulder-Greeley prices fall
In Denver-Boulder-Greeley, the transportation index had the largest impact among the eight major expenditure categories, accounting for over one-fourth of the movement in the overall index. Transportation prices declined 3.4 percent from the second half of 2008 to the second half of 2009 due almost entirely to lower motor fuel costs. Prices for motor fuel fell 18.3 percent over the year as a sharp drop in the first half of the period more than offset price increases in the latter half of the year.
The food and beverages index was the second largest contributor to the all items index, decreasing 2.4 percent from the second half of 2008 to the second half of 2009. The decline was attributable to a record-setting drop of 5.4 percent in prices for food at home. In contrast, prices for food away from home rose 1.2 percent and prices for alcoholic beverages were 4.5 percent higher over the year.
The housing component also contributed to the downward movement of the all items index, decreasing 0.7 percent from the second half of 2008 to the second half of 2009. An increase of 0.8 percent in shelter costs was more than offset by decreases in prices for household energy and household furnishings and
operations. Household energy costs declined 10.8 percent as prices for electricity decreased 1.8 percent and utility (piped) gas service costs fell 22.8 percent over the year. Prices for household furnishings and operations were 6.5 percent lower over the period.
The Denver metropolitan area recorded higher prices in the remaining five major expenditure categories. Recreation prices, which include admissions to movies, concerts, and sporting events, advanced 2.7 percent. The index for education and communication rose 2.8 percent and apparel costs were 2.2 percent higher.
Prices for other goods and services, which include tobacco and smoking products and personal care items, increased 2.8 percent and medical care costs rose 0.9 percent since the second half of 2008.
Energy prices, which include prices for motor fuel and household fuels, declined 15.4 percent over the
year, following a 10.6-percent increase in the same period one year ago. The special aggregate index for
all items less energy rose 0.5 percent. Excluding the impact of food and energy prices, the Denver
metropolitan area CPI-U advanced 1.2 percent from the second half of 2008 to the second half of 2009.
The Denver CPI-U stood at 209.652 for the second half of 2009. This means that a market basket of goods and services that cost $100.00 during the 1982-84 base period cost $209.65 during the second half of 2009. Because metropolitan area CPI data are not adjusted for seasonal price variation, consumersand businesses should be cautious in drawing conclusions about long-term retail price trends from short term changes in the area indexes.
The Denver-Boulder-Greeley, Colo., Metropolitan Statistical Area includes Adams, Arapahoe, Boulder, Broomfield, Denver, Douglas, Jefferson, and Weld Counties in Colorado.
Prices move up in West
In the U.S. West, prices edged up 0.1 percent in February 2010. During the past 12 months, overall prices advanced 1.4 percent. Prices for transportation decreased 0.2 percent over the month, but rose 11.1 percent over the year. Gasoline prices fell 2.0 percent for the month, but jumped 33.6 percent since February 2009. Prices for new and used motor vehicles edged up 0.2 percent in the past month and advanced 6.2 percent over the past 12 months.
The housing index, which comprises approximately 43 percent of the all items index, was unchanged since January, but fell 1.3 percent for the year. The index for shelter, the largest housing component, was virtually unchanged for the month, but declined 1.9 percent since February 2009. Prices for household fuels and utilities increased 0.5 percent since the previous month and 4.2 percent since a year ago. Household electricity prices were virtually unchanged for the month, yet advanced 4.1 percent for the year. Utility (piped) gas service costs increased 1.1 percent since January 2010, but fell 3.1 percent since February of last year. Prices for household furnishings and operations edged down 0.2 percent for the month and decreased 1.6 percent for the year.
Friday, April 9, 2010
HUD ANNOUNCES IMPROVEMENTS TO NEIGHBORHOOD STABILIZATION PROGRAM
HUD ANNOUNCES IMPROVEMENTS TO NEIGHBORHOOD STABILIZATION PROGRAM
Changes intended to accelerate purchase and rehab of foreclosed and abandoned properties
WASHINGTON - The U.S. Department of Housing and Urban Development (HUD) today announced changes to its Neighborhood Stabilization Program (NSP), which helps communities acquire, rehabilitate and re-sell foreclosed and abandoned properties more quickly and help prevent further decline in hard-hit neighborhoods. Specifically, HUD will change how it defines foreclosed and abandoned to include properties in mortgage default and uninhabitable homes with lingering code violations. These expanded definitions, effective immediately, will increase the reach of NSP by allowing more properties to qualify, remove existing barriers caused by market conditions, and help state and local grantees to meet a Congressional requirement that they obligate all of their NSP1 funding by September of this year.
"The original NSP rules this Administration inherited through language from the 2008 legislation limited the impact of the Neighborhood Stabilization Program and we've heard that clearly from our partners on the ground," said HUD Secretary Shaun Donovan. "The rules needed to be more flexible so our local partners can put taxpayer dollars to work quickly to stabilize neighborhoods hard-hit by foreclosure. It is my goal to make HUD the kind of federal partner that listens and responds to the needs of communities, so that we can work together to rebuild our neighborhoods and our economy."
HUD Assistant Secretary for Community Planning and Development Mercedes Márquez added, "It became clear to us that the Neighborhood Stabilization Program as originally designed was too restrictive and limited the ability of our local partners to put this funding to work quickly. We need to be more flexible so our local partners can respond to market conditions and reverse the effects of foreclosure in these neighborhoods as quickly as possible."
Redefining "foreclosed"
HUD previously defined the term foreclosed to apply only to properties where the foreclosure process was completed. Local communities suggested this narrow definition was not a good fit for market conditions since many properties were lingering in the foreclosure process and beyond the reach of NSP. The original definition limited a grantee's ability to intervene strategically when a lender initiates but does not complete foreclosure, or where a default is allowed to linger. In addition, many lenders are transferring properties to aggregators or loan servicers, which then arrange for final disposition. In some of these cases, the previous policy did not consider the properties to retain their foreclosed status after title is transferred to the aggregator or servicer.
Properties will now be eligible for NSP assistance if any of the following conditions apply: The property is at least 60 days delinquent on its mortgage and the owner has been notified; or the property owner is 90 days or more delinquent on tax payments; or under state or local law, foreclosure proceedings have been initiated or completed; or foreclosure proceedings have been completed and title has been transferred to an intermediary aggregator or servicer that is not an NSP grantee, subrecipient, developer, or end user.
Redefining "abandoned"
When the NSP program was originally designed following passage of the Housing and Economic Recovery Act of 2008, the term abandoned was defined as a property that had been foreclosed upon and was vacant for at least 90 days. This definition effectively excludes properties abandoned by owners but where tenants are still in place thereby precluding local communities from assisting the properties with NSP funding or protecting the tenants' occupancy. HUD determined this limitation was a substantial barrier to the preservation of existing affordable housing.
To address this limitation, HUD is expanding the definition of an abandoned property to include homes where no mortgage or tax payments have been made by the property owner for at least 90 days or a code enforcement inspection has determined that the property is not habitable and the owner has taken no corrective actions within 90 days of notification of the deficiencies.
###
Estimated dates for new reports
1st Quarter 2010 Metro Denver Multifamily Vacancy and Rent Survey: Week of April 26
1st Quarter 2010 Statewide Foreclosure Report: Week of May 10
1st Quarter 2010 Statewide Multifamily Vacancy and Rent Data: Week of May 17
1st Quarter 2010 Statewide Foreclosure Report: Week of May 10
1st Quarter 2010 Statewide Multifamily Vacancy and Rent Data: Week of May 17
New April Housing Snapshot now available
The April Housing Snapshot is now online. This month we feature personal income and employment, recent CPI data, rental housing needs and home prices.
Click here for the report.
Click here for the report.
Thursday, April 8, 2010
New mismatch and rent burden information available from the Division of Housing
Click here for full report.
Among households with the lowest incomes, there are twice as many households as there are affordable rental units in Colorado. According to a report released today by the Department of Local Affairs’ Division of Housing, there are 49 rental units affordable to every 100 households that earn $20,000 or less per year. The report assumes that households earning $20,000 can afford a monthly rent payment of $500, or 30 percent of monthly income.
According to the report, there are 43 affordable rental units for every 100 households earning $15,000 or less per year, and 53 units for every 100 households at an income of $10,000 or less. However, for households making $40,000 per year, there are 102 rental units for every 100 households.
“The greatest challenges in affordable housing are at the lowest income levels,” said Pat Coyle, Director of the Colorado Division of Housing. “The market is doing well at housing families with moderate incomes, but a large number of families with very low incomes in Colorado are paying much more than they can afford for housing.”
In the report, units are deemed affordable if the household pays 30 percent or less of monthly income to rent.
The availability of affordable rental units varied across the state. In the metro Denver area, there were 42 units affordable to every 100 households earning $10,000 or less, and 38 units affordable for each 100 households earning $20,000 or less. Affordable rentals were more accessible in the Mesa County area where there were 58 units affordable to households earning $10,000 or less, and 46 units affordable to households earning $20,000 or less.
For households earning $35,000 in all areas except the Mesa County region, there were at least 100 units affordable to every 100 households. In the Mesa County region there were 84 units for every household earning $35,000.
“We see such a mismatch at the low end of the income scale because it’s really not feasible for developers to construct market rate rental housing that can serve households making $15,000 per year. The cost of construction and land is too high.” said Ryan McMaken a spokesman with the Division of Housing. “The subsidized housing produced and owned by non-profits and housing authorities closes the gap somewhat, but overall there aren’t very many units available to very low-income households.”
The report also listed rent burden statistics for 25 counties in Colorado. Households are rent burdened when paying more than 30 percent of income toward housing. Some counties showed large numbers of renter households paying more than 50 percent of income toward housing. In Teller County, 35.5 percent of renters were paying more than 50 percent of income toward rent, while in Eagle County, almost 31 percent of renters were paying more than 50 percent. Counties on the eastern plains showed the lowest rent burdens with Morgan County and Logan County with only 10 percent and 7 percent of renters paying more than 50 percent of income toward rent, respectively.
Subscribe to:
Posts (Atom)