Thursday, March 31, 2011
A new domain for the Division of Housing blog
Please note above that the web address for this site has been simplified to www.divisionofhousing.com.
Employment: Regional Comparisons and Impacts on Housing
Total employment in the state continues to fall, as noted last week. Employment trends in different regions of the state, however, so this entry looks at which regions of the state have the highest unemployment rates, and which regions have recovered the most in their labor markets.
Regional employment trends can also provide us with some insights into local housing demand since, all things being equal, those areas with the most robust labor demand will also have the strongest demand for housing. This would be reflected in apartment vacancy rates and in median home price and home sales transactions, among other indicators.
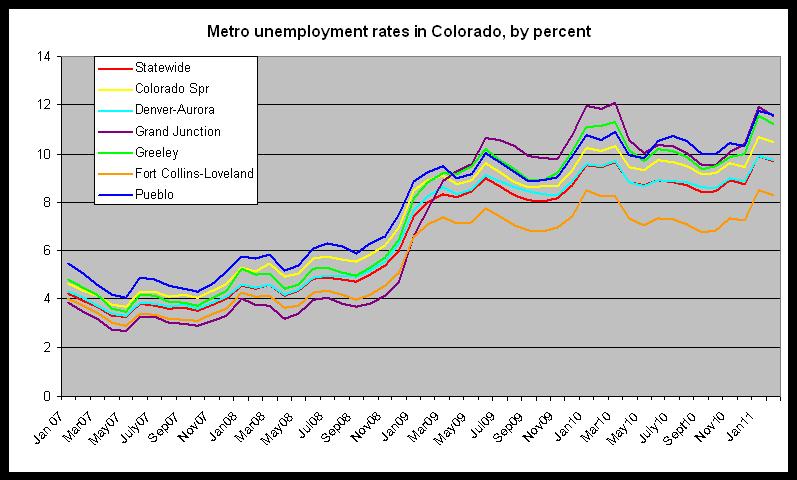
The first graph compares unemployment rates in Colorado's metro areas:
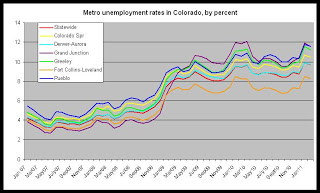
The regional unemployment rates for February 2011 are:
Colorado Springs, 10.5 percent
Denver-Aurora, 9.7 percent
Fort Collins-Loveland, 8.3 percent
Grand Junction, 11.5 percent
Greeley, 11.2 percent
Pueblo, 11.6 percent
The unemployment rate is a reflection of both the total number of employed persons and the total size of the labor force, so the unemployment rate can decrease even in times of falling total employment if the size of the labor force decreases as well.
To provide some additional context, we can look to see how far below total employment levels are below the most recent peak in employment in each region. The peak time differs in each region. For example, the labor market peaked in mid-2007 in the Colorado Springs area, but it did not peak until late 2008 in the Grand Junction area.
The following numbers reflect how far below the most recent peak are the February 2011 employment totals:
Colorado Springs MSA, 9.3 percent
Denver-Aurora MSA, 8.4 percent
Fort Collins-Loveland MSA, 7.8 percent
Grand Junction MSA, 14.1 percent
Greeley MSA 10.1 percent
Pueblo MSA, 6.1 percent
Pueblo has only fallen 6.1 percent from peak levels, although Pueblo already had a relatively weak job market during the peak period, which would explain why Pueblo continues to be among the areas with the highest unemployment rates. The Fort Collins Loveland area, on the other hand, is now only 7.8 percent below its peak, and is also the metro area with the lowest unemployment rate.
Impact on Housing
The metro areas with the most job growth should generally also be the areas with the most demand for housing. We do see this reflected to a certain extent in the apartment vacancy data.
The Fort Collins-Loveland area had the lowest vacancy rate of any region during the fourth quarter of 2010, with a rate of 4.1 percent. The metro Denver area had the second-lowest vacancy rate of 5.5 percent. This coincides with the fact that the regional metro unemployment rates are lowest in the Fort Collins Loveland area and in the metro Denver area. Likewise, the areas with the highest unemployment rates, Pueblo and Grand Junction, have the highest metro-wide vacancy rates of 10.2 percent and 7.5 percent, respectively.
By this reasoning, Greeley, which has a relatively high unemployment rate, should also have a high vacancy rate. However, we find that Greeley has a relatively low rate of 5.1 percent.
To explain this, some industry professionals have suggested that rental housing has benefited from the high demand in the Fort Collins-Loveland area. That is, as rents have increased in the Fort Collins-Loveland area, renters have looked to the Greeley area for more affordable rental housing. This may in turn be driving down vacancy rates in spite of a lack of job growth within the Greeley area itself.
Regional employment trends can also provide us with some insights into local housing demand since, all things being equal, those areas with the most robust labor demand will also have the strongest demand for housing. This would be reflected in apartment vacancy rates and in median home price and home sales transactions, among other indicators.
The first graph compares unemployment rates in Colorado's metro areas:
The regional unemployment rates for February 2011 are:
Colorado Springs, 10.5 percent
Denver-Aurora, 9.7 percent
Fort Collins-Loveland, 8.3 percent
Grand Junction, 11.5 percent
Greeley, 11.2 percent
Pueblo, 11.6 percent
The unemployment rate is a reflection of both the total number of employed persons and the total size of the labor force, so the unemployment rate can decrease even in times of falling total employment if the size of the labor force decreases as well.
To provide some additional context, we can look to see how far below total employment levels are below the most recent peak in employment in each region. The peak time differs in each region. For example, the labor market peaked in mid-2007 in the Colorado Springs area, but it did not peak until late 2008 in the Grand Junction area.
The following numbers reflect how far below the most recent peak are the February 2011 employment totals:
Colorado Springs MSA, 9.3 percent
Denver-Aurora MSA, 8.4 percent
Fort Collins-Loveland MSA, 7.8 percent
Grand Junction MSA, 14.1 percent
Greeley MSA 10.1 percent
Pueblo MSA, 6.1 percent
Pueblo has only fallen 6.1 percent from peak levels, although Pueblo already had a relatively weak job market during the peak period, which would explain why Pueblo continues to be among the areas with the highest unemployment rates. The Fort Collins Loveland area, on the other hand, is now only 7.8 percent below its peak, and is also the metro area with the lowest unemployment rate.
Impact on Housing
The metro areas with the most job growth should generally also be the areas with the most demand for housing. We do see this reflected to a certain extent in the apartment vacancy data.
The Fort Collins-Loveland area had the lowest vacancy rate of any region during the fourth quarter of 2010, with a rate of 4.1 percent. The metro Denver area had the second-lowest vacancy rate of 5.5 percent. This coincides with the fact that the regional metro unemployment rates are lowest in the Fort Collins Loveland area and in the metro Denver area. Likewise, the areas with the highest unemployment rates, Pueblo and Grand Junction, have the highest metro-wide vacancy rates of 10.2 percent and 7.5 percent, respectively.
By this reasoning, Greeley, which has a relatively high unemployment rate, should also have a high vacancy rate. However, we find that Greeley has a relatively low rate of 5.1 percent.
To explain this, some industry professionals have suggested that rental housing has benefited from the high demand in the Fort Collins-Loveland area. That is, as rents have increased in the Fort Collins-Loveland area, renters have looked to the Greeley area for more affordable rental housing. This may in turn be driving down vacancy rates in spite of a lack of job growth within the Greeley area itself.
Inflation adjusted rents in Colorado: 2000-2010
In general, market rents across the Colorado have increased consistently over the past decade. As can be seen here in this analysis of median rents and average rents, both median rents and average rents show a sustained increase over the past decade.
When adjusted for inflation, however, average rents in several metro areas of the state have decreased over the past decade.
The first chart shows, as an example, the divergence between the average rent, in nominal dollars and in inflation-adjusted dollars, in the Denver metro area over the past decade.
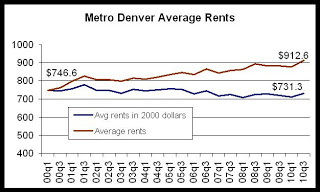
The graph shows us that if the value of the dollar were constant (and all other things being equal), a renter would only need 731 dollars in 2010 to rent an apartment that he or she could have rented in 2000 for 746 dollars.
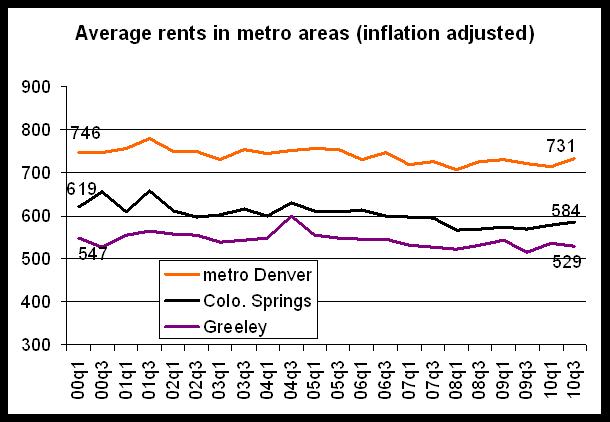
In the second graph, we see the metro areas in the state that have experienced losses in the inflation-adjusted average rent over the past decade. Metro Denver, the Greeley area and the Colorado Springs area had a lower average rent during the third quarter of 2010 than during the first quarter of 2000. In nominal terms, all of these areas have higher average rents now than was the case a decade ago, but inflation brings the change over the past decade, in real dollars, into negative territory.
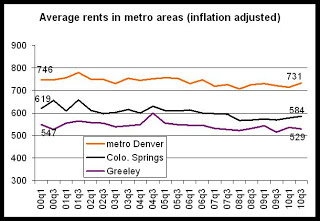
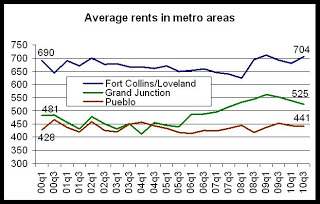
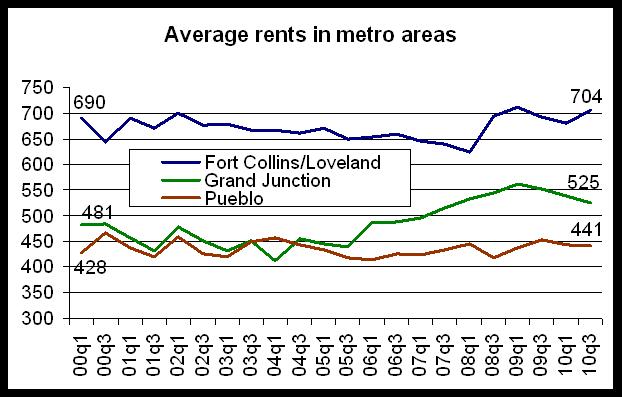
The third graph shows the metro areas that have experienced increases in the average rents even after adjusting for inflation. These areas include the Fort Collins-Loveland area, the Grand Junction Area and the Pueblo area.
The increase in the Fort Collins-Loveland area further reinforces recent conclusions that Larimer County enjoys one of the strongest apartment markets in the state.
The Grand Junction situation is interesting since the average rent has been decreasing in real terms since the first quarter of 2009. The Grand Junction area experienced a substantial increase in rents during the oil and gas boom of the last decade, but has come down in both real and in nominal terms since 2009.
These figures are notable since they provide some additional insight into the profitability of rental housing at the present time. While the multifamily industry expects significant increases in rents over the next several years, many property owners are still in the position to making up for several years of falling rents in inflation-adjusted terms.
Owners have noted in many cases that rents have in fact become more affordable over the past decade. This is indeed true, all things being equal, but as statewide household income data has shown, household incomes have been falling faster than average rents over the past decade.
This phenomenon in inflation-adjusted rents is also worth noting because it helps to explain why so little new construction in multifamily rental housing has taken place in recent years: average rents have been falling in inflation-adjusted terms in many areas, thus providing a disincentive for new development.
Note: In the analysis above, I've used average rent data from the Division of Housing's vacancy and rent surveys, and I've adjusted them to the Denver-Boulder-Greeley CPI with a base period of the first half of 2000. Since the Denver-Boulder-Greeley CPI is only issued twice each year, I've adjusted the first quarter's average rent to the CPI for the first half of the year, and I've adjusted the third quarter's average rent to the CPI for the second half of the year.
When adjusted for inflation, however, average rents in several metro areas of the state have decreased over the past decade.
The first chart shows, as an example, the divergence between the average rent, in nominal dollars and in inflation-adjusted dollars, in the Denver metro area over the past decade.
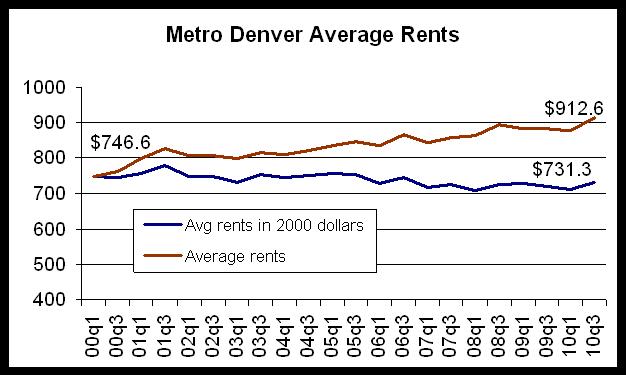
The graph shows us that if the value of the dollar were constant (and all other things being equal), a renter would only need 731 dollars in 2010 to rent an apartment that he or she could have rented in 2000 for 746 dollars.
In the second graph, we see the metro areas in the state that have experienced losses in the inflation-adjusted average rent over the past decade. Metro Denver, the Greeley area and the Colorado Springs area had a lower average rent during the third quarter of 2010 than during the first quarter of 2000. In nominal terms, all of these areas have higher average rents now than was the case a decade ago, but inflation brings the change over the past decade, in real dollars, into negative territory.
The third graph shows the metro areas that have experienced increases in the average rents even after adjusting for inflation. These areas include the Fort Collins-Loveland area, the Grand Junction Area and the Pueblo area.
The increase in the Fort Collins-Loveland area further reinforces recent conclusions that Larimer County enjoys one of the strongest apartment markets in the state.
The Grand Junction situation is interesting since the average rent has been decreasing in real terms since the first quarter of 2009. The Grand Junction area experienced a substantial increase in rents during the oil and gas boom of the last decade, but has come down in both real and in nominal terms since 2009.
These figures are notable since they provide some additional insight into the profitability of rental housing at the present time. While the multifamily industry expects significant increases in rents over the next several years, many property owners are still in the position to making up for several years of falling rents in inflation-adjusted terms.
Owners have noted in many cases that rents have in fact become more affordable over the past decade. This is indeed true, all things being equal, but as statewide household income data has shown, household incomes have been falling faster than average rents over the past decade.
This phenomenon in inflation-adjusted rents is also worth noting because it helps to explain why so little new construction in multifamily rental housing has taken place in recent years: average rents have been falling in inflation-adjusted terms in many areas, thus providing a disincentive for new development.
Note: In the analysis above, I've used average rent data from the Division of Housing's vacancy and rent surveys, and I've adjusted them to the Denver-Boulder-Greeley CPI with a base period of the first half of 2000. Since the Denver-Boulder-Greeley CPI is only issued twice each year, I've adjusted the first quarter's average rent to the CPI for the first half of the year, and I've adjusted the third quarter's average rent to the CPI for the second half of the year.
Construction jobs down 35 percent from peak, hospitality jobs grow
As we showed last week, overall employment in Colorado continues to fall from its 2008 peak. The unemployment rate has now exceeded the national rate, and statewide employment is now down more than 220,000 jobs from the peak.
At the Division of Housing, we keep an eye on industries that are often connected to affordable housing and real estate trends.
Today, we'll look at job creation in the following industries: construction, leisure and hospitality, and retail.
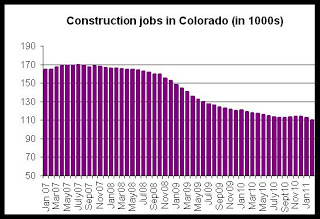
Construction is a key indicator since it is connected to housing production. The construction jobs examined below include non-residential construction.
In the first chart, it is clear that, as of February 2011, construction jobs continue to be well below the 2007 peak. Since construction jobs peaked during July 2007, construction jobs have fallen 35 percent, or 60,000 jobs, down to post-recession low of 109,000 jobs. From February 2010 to February 2011, construction jobs have fallen 7.5 percent, or 8,900 jobs.
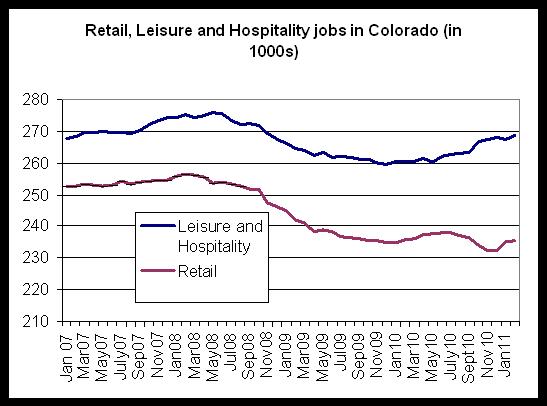
Retail jobs, and jobs in the leisure and hospitality industry are key factors in the rural resort economies, and are also important statewide as sources of income for low-income households. In the chart below, we see that retail jobs have been largely flat since early 2010, while remaining well below the 2008 peak in retail jobs.
Leisure and hospitality jobs, on the other hand, have recovered somewhat since early 2010.
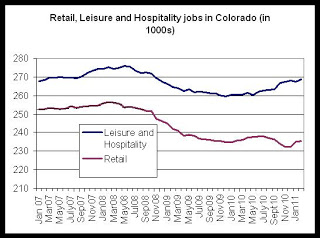
In leisure and hospitality, total jobs are now down 2.5 percent, or about 900 jobs, from the June 2008 peak. From February 2010 to February 2011, total jobs increased 3.1 percent, or about 8,000 jobs.
In retail, however, jobs have been flat since February 2010. From February of last year to February 2011, total employment in retail is down about 400 jobs (is essentially flat). Since the February 2008 peak, retail jobs are down 8.2 percent, or about 19,000 jobs.
At the Division of Housing, we keep an eye on industries that are often connected to affordable housing and real estate trends.
Today, we'll look at job creation in the following industries: construction, leisure and hospitality, and retail.
Construction is a key indicator since it is connected to housing production. The construction jobs examined below include non-residential construction.
In the first chart, it is clear that, as of February 2011, construction jobs continue to be well below the 2007 peak. Since construction jobs peaked during July 2007, construction jobs have fallen 35 percent, or 60,000 jobs, down to post-recession low of 109,000 jobs. From February 2010 to February 2011, construction jobs have fallen 7.5 percent, or 8,900 jobs.

Retail jobs, and jobs in the leisure and hospitality industry are key factors in the rural resort economies, and are also important statewide as sources of income for low-income households. In the chart below, we see that retail jobs have been largely flat since early 2010, while remaining well below the 2008 peak in retail jobs.
Leisure and hospitality jobs, on the other hand, have recovered somewhat since early 2010.
In leisure and hospitality, total jobs are now down 2.5 percent, or about 900 jobs, from the June 2008 peak. From February 2010 to February 2011, total jobs increased 3.1 percent, or about 8,000 jobs.
In retail, however, jobs have been flat since February 2010. From February of last year to February 2011, total employment in retail is down about 400 jobs (is essentially flat). Since the February 2008 peak, retail jobs are down 8.2 percent, or about 19,000 jobs.
Housing News Digest, March 31
ECB hiking before Fed would be new in a tightening cycle
FRANKFURT, March 31 (Reuters) - After following the Federal Reserve's lead for over a decade, the European Central Bank is poised to launch a series of interest rate hikes before the U.S. central bank for the first time in the ECB's history.
The change from the traditional pattern reflects the ECB's greater preoccupation with inflation pressures, as well as its higher level of discomfort with the emergency bond-buying programmes run by central banks.
What's the matter with Colorado?
The old frontier isn’t what it used to be. In the year to February, the Mountain West accounted for just 1.8% of national job growth, the worst performance of any Census region. Employment rose over four times as fast in the states along the Pacific coast. Three Rocky Mountain states—Idaho, Colorado, and New Mexico—posted their highest unemployment rates of the recovery in February. Residents are wondering what’s gone wrong.
Shadow Inventory Drops but Supply to Remain High for Extended Period
While the total volume of properties in the shadows dropped, CoreLogic says the amount of time it would currently take to clear this hidden inventory remains the same as a year ago - nine months’ worth of supply. The company says the unchanged supply calculation is due to the slower pace of home sales the industry has experienced in recent months.
Inflation pressures grow on Main Street
Still reeling from the recession, most mom-and-pop shops have held off on raising prices for fear of losing more customers. But business is finally starting to pick up, and after years of being squeezed by cost increases, a growing number of small businesses are hiking their prices.
Lawler: The “Shrill Cry” from Lobbyists on QRM
For ABS backed by QRMs, the DFA provides for an exemption of the risk-retention rule. For folks who don’t remember, the “inclusion” of an exemption for QRMs was in the act because of heavy lobbying by financial institutions and housing-related trade groups, and it put regulators in the uncomfortable position of trying to decide what types of mortgages were so inherently “low risk” that they should/could be excluded from the rule designed to ensure that ABS issuers had “skin in the game.”
Wednesday, March 30, 2011
Private Activity Bond fees have been updated for 2011
The Private Activity Bond page, found here, has been updated with new PAB fee information for 2011. The new document is here.
Housing News Digest, March 30
Surveys: Colorado banks under more stress
DENVER - Two national surveys on bank health have found that many Colorado banks are under more financial stress banks than other states and they may have a thinner cushion to absorb bad bank loans.
The studies show that at the end of 2010, about one in four Colorado banks met the definition of a "troubled" or "problematic" institution.
Gloomy census and FHFA data weighs on housing market
Seperate reports released yesterday by the US Census Bureau and the Federal Housing Finance Agency do not bode well for the local housing market.
According to this FHFA report, housing prices continued on a downward trend, falling 0.3 percent from December to January. For the 12 months ending in January, prices fell 3.9 percent to roughly the same level as May 2004.
Real Estate: Feds move on home mortgage rules
The Federal Deposit Insurance Corporation and the Federal Reserve now want public comment on the plan, which would require lenders to offer mortgages with at least a 20 percent down payment if they want to repackage the loan to sell to other investors without keeping some of the risk on their books.
House Votes to Terminate Government's Mortgage Modification Program
The U.S. House of Representatives passed legislation Tuesday evening to end the administration’s flagship foreclosure prevention initiative, the Home Affordable Modification Program (HAMP).
CoreLogic: Shadow Inventory Declines Slightly
This graph from CoreLogic shows the breakdown of "shadow inventory" by category. For this report, CoreLogic estimates the number of 90+ day delinquencies, foreclosures and REOs not currently listed for sale. Obviously if a house is listed for sale, it is already included in the "visible supply" and cannot be counted as shadow inventory.
Tuesday, March 29, 2011
Denver metro home prices down year-over-year for seventh straight month
Case-Shiller’s home price index for the Denver area fell 0.7 percent from November to December, and fell 2.3 percent , year over year from January 2010 to January 2011.
According to the Case-Shiller report, released today by Standard and Poor's, and containing data up through January, 14 of the 20 metro areas measured by the report showed larger declines than the Denver area. The report shows a general decline in home prices across the nation, with only two metropolitan areas, San Diego and Washington, DC, showing increases in home prices over the past year. According to the Case-Shiller press release:
“Keeping with the trends set in late 2010, January brings us weakening home prices with no real hope in sight for the near future” says David M. Blitzer, Chairman of the Index Committee at Standard & Poor's. “With this month’s data, we find the same 11 MSAs posting new recent index lows. The 10-City and 20-City Composites continue to decline month-over-month and have posted monthly declines for six consecutive months now.
In year over year comparisons for January, Phoenix showed the largest drop, with a decline of 9.1 percent, while the index in Detroit fell 8.1 percent. The index rose the most in Washington, DC where it increased 3.6 percent, year over year. The index also rose 0.1 percent in San Diego. Home price indices fell in 18 of the 20 cities included in the study.
The first chart shows trends in the Case-Shiller index for the Denver area and for the 20-city composite index. It is clear that Denver did not experience the kind of price bubble that occurred in many other metropolitan areas, and consequently, the index has not fallen nearly as far in Denver compared to the larger composite. Prices have been largely flat since mid-2009, but continue a slow trend downward.
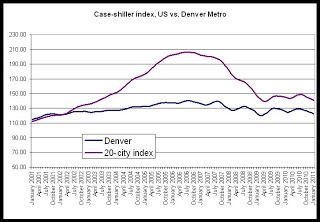
The 20-city composite is down 31.8 percent since it peaked in July 2006, but the Denver index is down only 12.5 percent from its August 2006 peak.
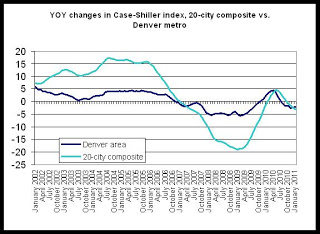
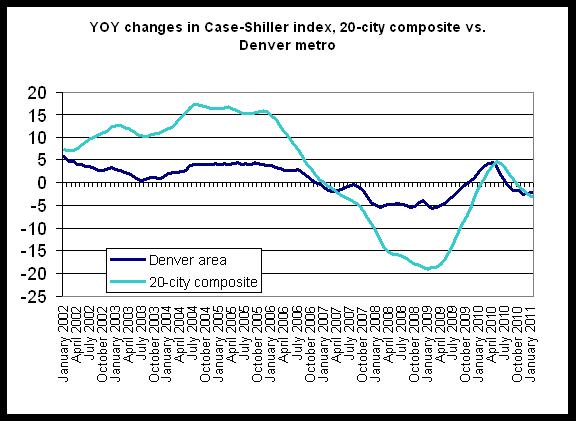
The second chart compares year-over-year changes in the Denver area index and in the 20-city composite. The Denver index did not achieve the rates of growth experienced by the national index, but the Denver index did not experience comparable rates of decline following the onset of the national recession either. Overall, the index has been less volatile in Denver than has been the case for the 20-city composite. Year-over-year growth in the 20-city composite during January was negative with a decrease of 2.3 percent. The Denver area index’s fall of 2.3 percent is the seventh month in a row in which the growth rate has been negative. In the 20-city index, on the other hand, the year-over-year change has only been negative for the most recent four months.
While Denver’s index has been largely stable, note that for the previous 24 months, only 8 months have shown a positive year-over-year change.
The last chart compares the actual index value for the Denver area with the year-over-year change. Note that for July through December, the change has fallen below zero, and likely reflects the end of the homebuyer tax credit’s end which has translated into a fall in demand and a decline in the home price index. The upward trend in the index in response to the tax credit is clear during late 2009 and early 2010. In at least three separate measures of home prices - Case-Shiller, REALTOR, and FHFA data - Colorado and its metro areas have shown continued weakness in the home purchase markets.
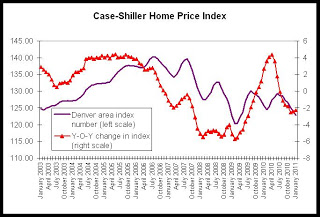
The chart shows that from July 2010 through January 2011, the home price index has been below the index for the same period a year earlier (July 2009 through January 2010). Given that 2009 was itself a weak year for home sales, this data does not suggest a speedy rebound for home prices.
According to the Case-Shiller report, released today by Standard and Poor's, and containing data up through January, 14 of the 20 metro areas measured by the report showed larger declines than the Denver area. The report shows a general decline in home prices across the nation, with only two metropolitan areas, San Diego and Washington, DC, showing increases in home prices over the past year. According to the Case-Shiller press release:
“Keeping with the trends set in late 2010, January brings us weakening home prices with no real hope in sight for the near future” says David M. Blitzer, Chairman of the Index Committee at Standard & Poor's. “With this month’s data, we find the same 11 MSAs posting new recent index lows. The 10-City and 20-City Composites continue to decline month-over-month and have posted monthly declines for six consecutive months now.
In year over year comparisons for January, Phoenix showed the largest drop, with a decline of 9.1 percent, while the index in Detroit fell 8.1 percent. The index rose the most in Washington, DC where it increased 3.6 percent, year over year. The index also rose 0.1 percent in San Diego. Home price indices fell in 18 of the 20 cities included in the study.
The first chart shows trends in the Case-Shiller index for the Denver area and for the 20-city composite index. It is clear that Denver did not experience the kind of price bubble that occurred in many other metropolitan areas, and consequently, the index has not fallen nearly as far in Denver compared to the larger composite. Prices have been largely flat since mid-2009, but continue a slow trend downward.
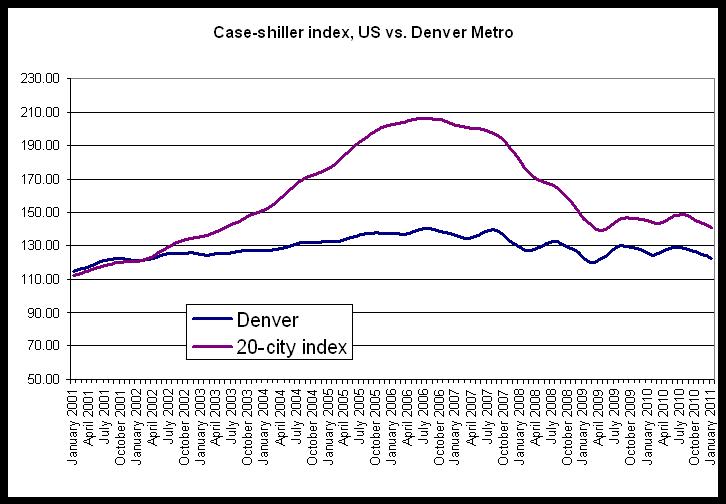
The 20-city composite is down 31.8 percent since it peaked in July 2006, but the Denver index is down only 12.5 percent from its August 2006 peak.
The second chart compares year-over-year changes in the Denver area index and in the 20-city composite. The Denver index did not achieve the rates of growth experienced by the national index, but the Denver index did not experience comparable rates of decline following the onset of the national recession either. Overall, the index has been less volatile in Denver than has been the case for the 20-city composite. Year-over-year growth in the 20-city composite during January was negative with a decrease of 2.3 percent. The Denver area index’s fall of 2.3 percent is the seventh month in a row in which the growth rate has been negative. In the 20-city index, on the other hand, the year-over-year change has only been negative for the most recent four months.
While Denver’s index has been largely stable, note that for the previous 24 months, only 8 months have shown a positive year-over-year change.
The last chart compares the actual index value for the Denver area with the year-over-year change. Note that for July through December, the change has fallen below zero, and likely reflects the end of the homebuyer tax credit’s end which has translated into a fall in demand and a decline in the home price index. The upward trend in the index in response to the tax credit is clear during late 2009 and early 2010. In at least three separate measures of home prices - Case-Shiller, REALTOR, and FHFA data - Colorado and its metro areas have shown continued weakness in the home purchase markets.
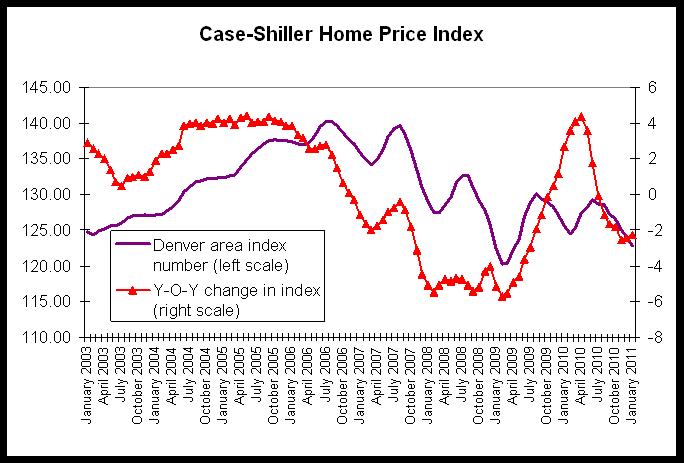
The chart shows that from July 2010 through January 2011, the home price index has been below the index for the same period a year earlier (July 2009 through January 2010). Given that 2009 was itself a weak year for home sales, this data does not suggest a speedy rebound for home prices.
Housing News Digest, March 29
House GOP works to end Obama mortgage plan
House Republicans will consider a bill to stop any new funding for the Home Affordable Modification Program (HAMP). The program taps the federal bailout that saved the big banks, providing incentives to mortgage servicers to modify mortgages for borrowers behind on their payments.
US housing prices continue to slump
Today’s release of the S&P;/Case-Shiller (CSI) home price indices for January reported that the non-seasonally adjusted Composite-10 price index declined a notable 0.90% since December indicating that housing is continuing slump into a double-dip.
U.S. Property Taxes Fall by Most Since Housing Market Crash
U.S. state and local property-tax collections dropped in the last three months of 2010 by the most since home prices peaked more than four years ago, slowing the overall growth in government revenue.
Real-estate-tax collections, a main source of income for cities, slid $5.3 billion, or 2.9 percent, from a year earlier to $177.1 billion, the Census Bureau reported today. The drop exceeded a 2.5 percent decline in the first quarter of 2010, the data show.
Servicers to Meet with Officials Wednesday to Discuss Settlement
After reports that the timeline to iron out final details of the robo-signing settlement is “ambitious,” representatives from several major servicers, attorneys general, and some federal regulators are said to have a meeting planned for Wednesday, marking their first face-to-face discussion of terms.
Why house prices will keep falling
Unless Ben Bernanke sets off a big inflation wave, house prices are doomed to keep falling for years.
Monday, March 28, 2011
Housing News Digest, March 28
McWhinney kicking off apartment complex project
Work began on the 252-unit The Greens at Van de Water on Mountain Lion Drive in Loveland last week. Preleasing for the studio, one-, two- and three-bedroom apartments is expected to begin in the fall with move-in slated for the winter.
Vacancy rates in Loveland were at 5.5 percent at the end of the third quarter of 2010 while average rents were among the highest among the lowest in the state's metro regions, according to the state's Multifamily Vacancy and Rent Survey conducted for the Colorado Division of Housing.
Investors eager for metro Denver housing projects
An apartment building boom is on the horizon as increasing demand for a limited supply of apartments pushes rents higher and gives developers and investors an incentive to start building multifamily projects.
Tough economy refills empty nests
It's been almost a year since Charlie Evans graduated from Colorado State University with a degree in engineering, eager to launch a career in the aerospace industry. "I started applying right away," he said. But 200 job applications later, he's landed only two "solid" interviews.
LPS: Overall mortgage delinquencies declined slightly in February
•Delinquency rates resumed their decline after an increase in January and foreclosure inventories remain stable, slightly below historic highs.
• Delinquencies continue to improve as new problem loan rates decline and cure rates increase.
• Foreclosure start declines and foreclosure suspensions are reducing the upward pressure on inventories caused by foreclosure sale moratoria.
• An enormous backlog of foreclosures still exists with overhang at every level
Servicers Asked to Consider a $21,000 "Cash for Keys" Option
According to an article by The Financial Times, the five biggest mortgage servicers in the United States were encouraged to consider a “cash for keys” option for 90-day plus delinquent borrowers that would pay them as much as $21,000 to move out.
Traditionally a cash for keys option offers around $1,000 for a borrower to vacate the property within a defined time frame. The borrower is forgiven of the mortgage debt in exchange for the deed to the property, and the money can help provide for moving expenses.
Friday, March 25, 2011
February 2011 employment summary: job losses continue
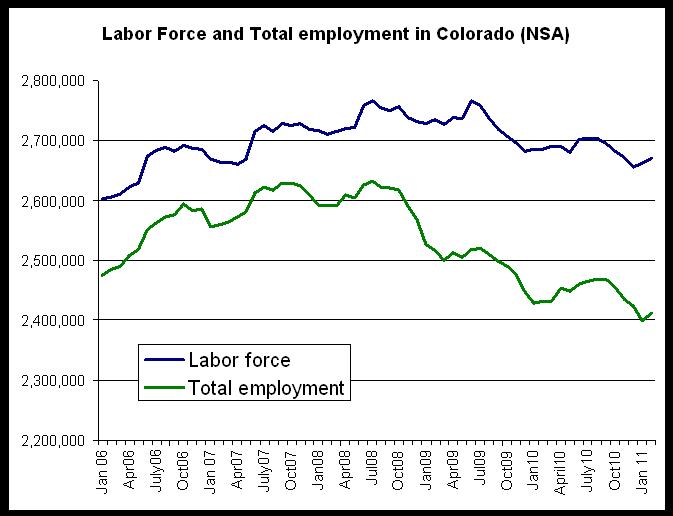
Colorado lost 20,500 jobs in February, compared to February of last year, and the non-seasonally-adjusted unemployment rate rose slightly to 9.7 from February 2010's rate of 9.4 percent. According to the most recent employment data released by the Colorado Department of Labor and Employment, total employment in February, not seasonally adjusted, fell to 2.41 million jobs. There were 14,500 fewer people in the work force during February, compared to February 2010, which mitigated the rise in the unemployment rate.

From February 2010 to February 2011, total employment fell 0.8 percennt, while the labor force shrank 0.5 percent. The total labor force in February included 2.67 million workers.
As can be seen in the second graph, both total employment and total workforce size have fallen off in recent months, and both remain well below the July 2008 peak.
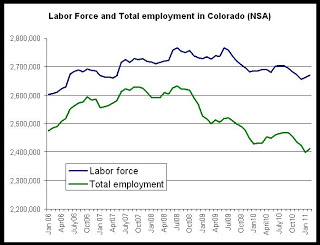
Employment totals are still more than 221,000 jobs below the peak levels experienced during July 2008 when there were 2.63 million employed workers. Since the labor force peaked in July 2008, it has fallen by more than 96,000 workers.
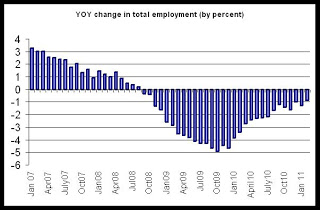
In the third graph is shown the year-over-year comparisons for total employment. Not since August 2008 has Colorado posted a positive change in total employment when compared to a year earlier. Although overall total employment has increased since January 2010, employment totals remain below 2009 totals in each year-over-year comparison.
This is the second month in a row in which Colorado's unemployment rate has exceeded the national rate (discussed here.) Recent personal income data (discussed here) from the BLS also showed Colorado lagging the nation and the region, with Colorado placing in the bottom quintile for all states for personal income during the fourth quarter of 2010.
Also of interest: Comparing national unemployment with state unemployment.
From February 2010 to February 2011, total employment fell 0.8 percennt, while the labor force shrank 0.5 percent. The total labor force in February included 2.67 million workers.
As can be seen in the second graph, both total employment and total workforce size have fallen off in recent months, and both remain well below the July 2008 peak.
Employment totals are still more than 221,000 jobs below the peak levels experienced during July 2008 when there were 2.63 million employed workers. Since the labor force peaked in July 2008, it has fallen by more than 96,000 workers.
In the third graph is shown the year-over-year comparisons for total employment. Not since August 2008 has Colorado posted a positive change in total employment when compared to a year earlier. Although overall total employment has increased since January 2010, employment totals remain below 2009 totals in each year-over-year comparison.

This is the second month in a row in which Colorado's unemployment rate has exceeded the national rate (discussed here.) Recent personal income data (discussed here) from the BLS also showed Colorado lagging the nation and the region, with Colorado placing in the bottom quintile for all states for personal income during the fourth quarter of 2010.
Also of interest: Comparing national unemployment with state unemployment.
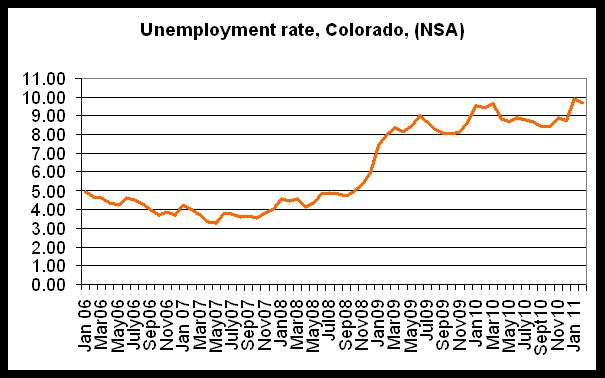
Colorado unemployment rate remains above national rate, could affect rental vacancies
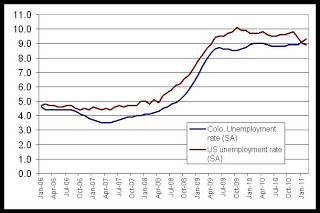
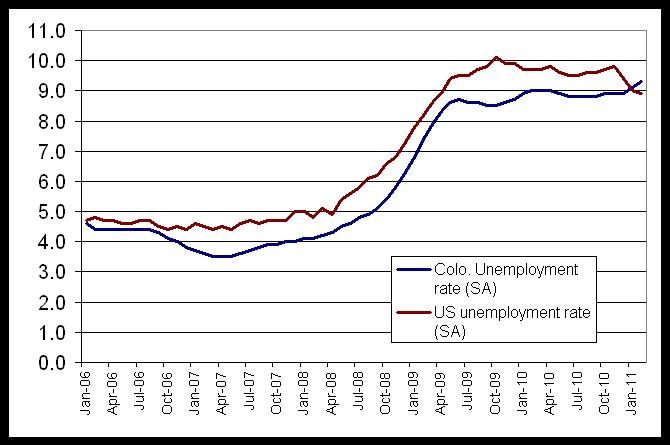
New employment data was released today by the BLS for all states. For the second month in a row, Colorado's unemployment rate has exceeded the national unemployment rate. The Colorado unemployment had been below the national rate from 2006 until December 2010, but as Colorado has lagged the national economy in job creation and income growth, the national rate has fallen while the Colorado rate has risen.
(All unemployment rates quoted in this article are seasonally adjusted.)
In December, the national rate was at 9.4 percent while Colorado's rate was 8.9 percent. In January, however, Colorado's rate rose to 9.1 percent while the national rate fell to 9.0 percent. February widened the gap with Colorado's unemployment rate rising to 9.3 percent while the national rate fell to 8.9 percent.
The first graph shows the relationship between the national unemployment rate and the Colorado unemployment rate in recent years.
This reversal could have an effect on the demand for housing. As we've discussed here before, the vacancy rate had tended to move with the unemployment rate in recent years. Prior to the 2007-2009 recession, as unemployment increased, the vacancy rate increased as well. This was due to the connection between employment, household formation and the demand for rental housing.
The second graph shows this relationship:
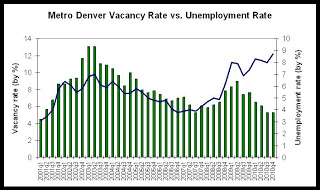
Over the past 18 months, though, the vacancy rate has fallen in spite of a heightened unemployment rate. This change was unexpected, although it could at least be partially explained by the lack of new development in rental housing, and by the decline in the attractiveness of for-sale housing.
Another large factor has been the fact that household formation has continued at a strong pace in spite of stagnant economic and job growth in the area. This was no doubt helped along by the fact that Colorado was experiencing a lower unemployment rate than the nation in general. This encouraged workers to relocate to Colorado, and made Colorado a relatively attractive place for entry-level workers who, in many cases, are rental housing's target market.
With the reversal of this trend, the demand for rental housing may be impacted if it leads to a significant number of workers and households seeking employment outside the state. Vacancy data from the first and second quarters of this year will be helpful in determining if this change in unemployment rates will have much of an effect on the multifamily industry.
Also of interest: Feb 2011 employment summary
Housing News Digest, March 25
Morgan Stanley’s Deep Secret Now Is Revealed: Jonathan Weil
Here’s a little secret the Federal Reserve Board doesn’t want you to know. On Sept. 24, 2008, while financial markets were collapsing, Morgan Stanley borrowed $3.5 billion through the Fed’s oldest lending program, the 98-year- old discount window.
The Fed has long claimed that releasing this type of data could trigger bank runs, public hysteria, death spirals at financial institutions large and small, and other horrible outcomes. Yet I’ve got a hunch Morgan Stanley somehow will survive this revelation. Mass panic will not ensue. The world will not end.
State by State Estimate of Shadow Inventory
Differences in the levels of foreclosure and seriously delinquent inventory, as well as the saturation of distressed sales in total existing sales are naturally causing varying levels of shadow inventory across states. State by state estimate of shadow inventory presented here is based on the same method as described in the March 2010 shadow inventory article(PDF).
Northern Colorado housing presentation a mixed bag
On a more serious note, Laposa briefed the 130 audience members, including the not-so-happy lenders, on the results of a 2011 residential survey during the two-hour “Housing Colorado’s Future” presentation.
The survey combined the results of three separate surveys of the Colorado Association of Realtors, the Colorado Association of Home Builders and the Colorado Mortgage Lenders Association.
Survey says tough market ahead
Highlights of the report include higher expectations for jobs than interest rates this year compared to last.
All three organizations indicated employment growth would be stagnant, while interest rates were likely to rise.
Slow start for new homes
New home building activity in the Denver area was down 43.2 percent in February from February 2010, according to the latest report released by the Home Builders Association of Metro Denver.
There were only 267 building permits pulled in the Denver area in February, compared with 462 in February 2010, shows the report, which tracks apartments, single-family attached and single-family detached homes in 28 counties and municipalities from Erie to Parker. It includes the counties of Adams, Arapahoe, Boulder, Broomfield, Denver, Douglas, Elbert, and Jefferson. Building permits track future construction activity.
Thursday, March 24, 2011
Developer's Toolkit Workshop: May 11 & 12 in Brighton
Developer's Toolkit Workshop
Join the DOLA/Colorado Division of Housing for an exciting two-day
workshop designed to enlighten participants about the art and science of
affordable housing development. Through role-playing, participants will
attempt to solve the housing challenge facing a typical Colorado
community. Hands-on exercises will provide a working knowledge of the
critical steps necessary to develop an affordable rental housing
community.
DOLA/CDOH will be presenting the Developer's Toolkit on May 11 & 12 in Brighton, at the Adams County Government Center, Platte River B Conference Room, 4430 S. Adams County Parkway, Brighton.
The brochure/registration form is here. Registrations are due on April 27th.
This class often fills up quickly, so register soon! Mail your check and registration form to Antoinette Johns at DOLA/CDOH. Unfortunately, we cannot accept payment by credit card.
Please contact Denise Selders (303-866-4650) or [email protected] with any questions.
March 2011 Housing Snapshot now available
At four pages, the Housing Snapshot is a very concise summary of recent housing trends. It's published 6 times a year to provide a quick snapshot of housing trends in Colorado for the non-expert.
Click here for the latest issue.
Housing News Digest, March 24
Cash Is King in Today's Distressed Marketplace
For many homebuyers, mortgage financing is hard to come by these days. Lenders have tightened up credit requirements in an about-face from the lax lending of pre-crisis days that put people into mortgages they couldn’t afford and fueled record-high delinquencies.
Evidence of constricted mortgage credit was highlighted in the latest HousingPulse report from Campbell Surveys and Inside Mortgage Finance as cash transactions set a new record, accounting for 33.7 percent of home purchases in February.
US Finances Rank Near Worst in the World: Study
In the Sovereign Fiscal Responsibility Index, the Comeback America Initiative ranked 34 countries according to their ability to meet their financial challenges, and the US finished 28th, said David Walker, head of the organization and former US comptroller general.
"We think it is important for the American people to understand where the United States is as compared to other countries with regard to fiscal responsibility and sustainability," Walker said in a CNBC interview. "Americans are used to rankings and they're used to ranking very high, but frankly in this area we rank very low."
Why Housing Is Going Through a Double Dip
AP
The sales pace of newly built homes is now at the lowest on record.
Sales dropped nearly 17 percent in February after a big drop in January. Put that on top of the nearly 10 percent February drop in existing home sales reported earlier this week and the incredibly low level of mortgage purchase applications, and you get a clear case for a double dip in housing.
Study: Colorado added few jobs in last decade even as labor force grew
Colorado's Western Slope and central-northern mountains created a net 12,200 jobs during the past decade while the rest of the state stagnated, a new study finds.
Wednesday, March 23, 2011
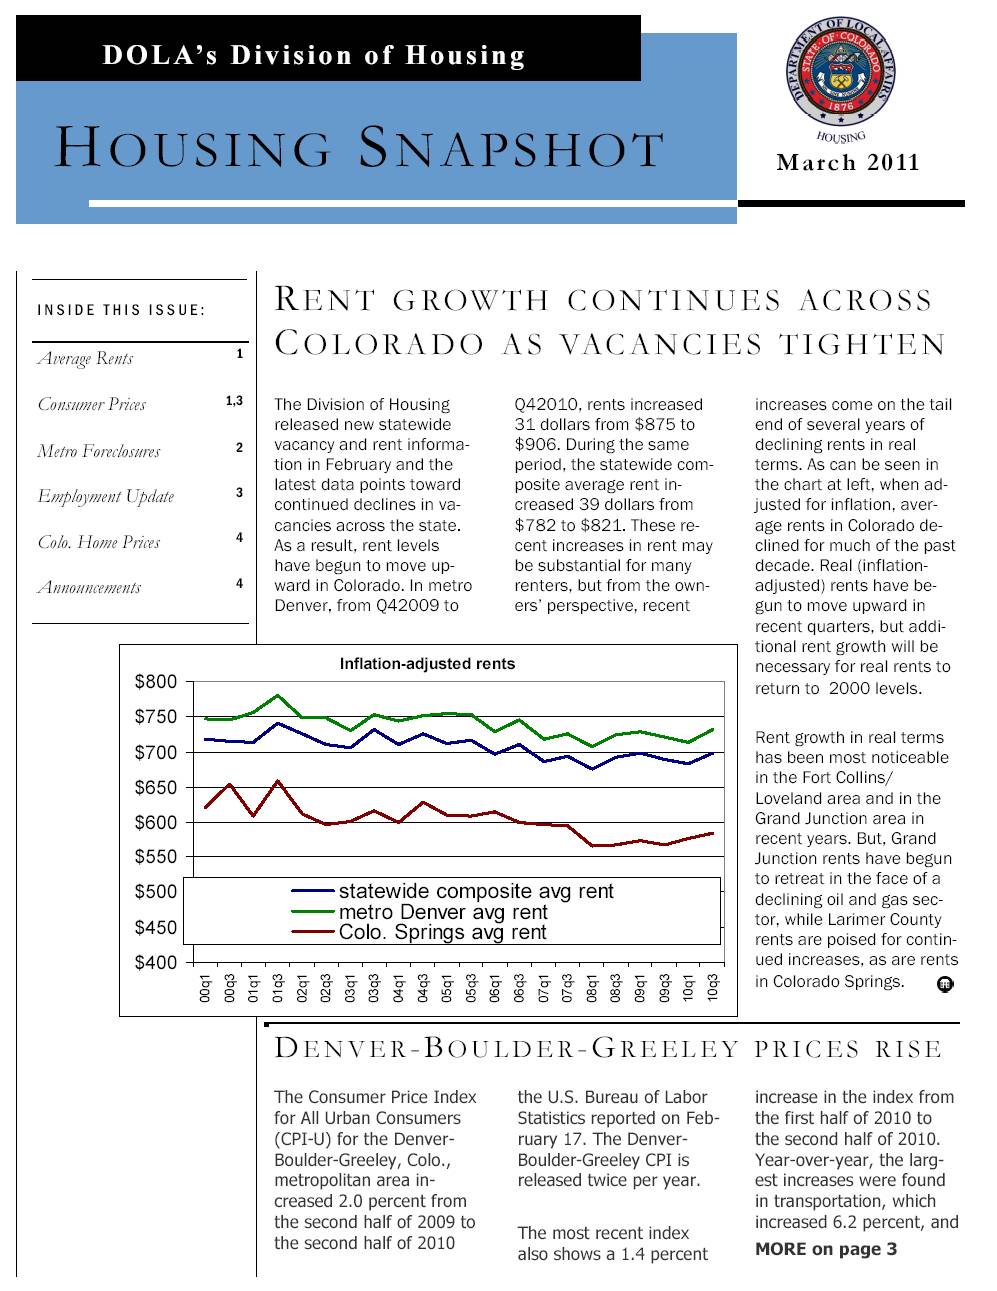
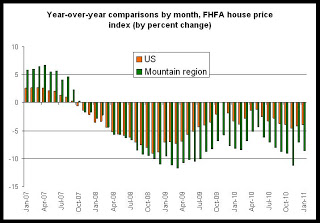
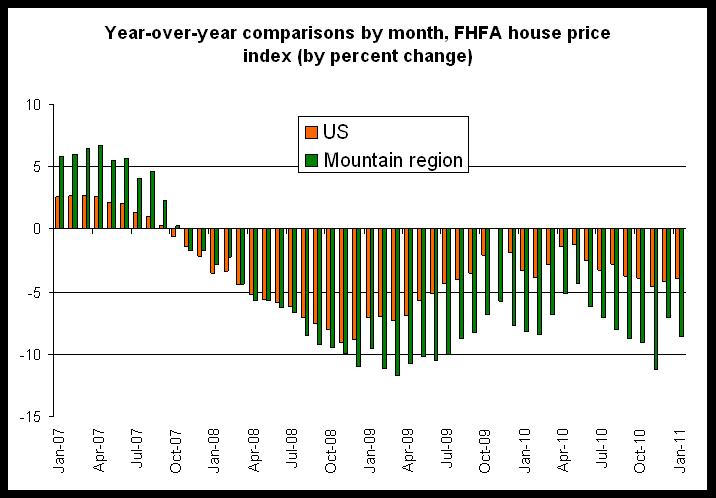
Mountain region house prices fall 8.6 percent in January
House prices in January in the Mountain region, which includes Colorado, fell 8.6 percent, year-over-year. Nationally, the house price index fell 3.8 percent. The new house price index numbers, released today by the Federal Housing and Finance Agency, also showed that the national index is down 18.3 percent from the peak level reached in June 2007, while the Mountain region's index is down 28.6 percent over the same period.
The FHFA monthly index is calculated using purchase prices of houses backing mortgages that have been sold to or guaranteed by Fannie Mae or Freddie Mac.
The decline in house prices, both regionally and nationally, continues the trend that began in mid-2007 as prices as fallen almost constantly since the peak.
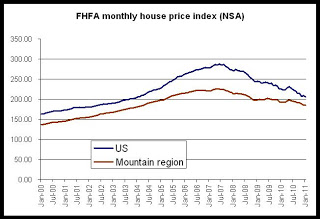
Notably, the FHFA index dows not show a "double dip" as can be seen in the Case-shiller data (discussed here) in which prices begin to recover in 2009, but then fall again after mid-2010. The FHFA monthly data shows nothing but losses following mid-2007. The second chart shows each month's house price index compared to the same month a year earlier:
In the second chart, we can also note that the Mountain region has performed more poorly (from a seller's perspective) than the national index. This runs contrary to some local experience and some statistics. The Case-Shiller data for the Denver metro area, for example shows that local prices did not decline as much as the national composite index following the financial panic in 2008.
Since we're looking at regional, data, however, we have to keep in mind that this data reflects house prices in Arizona and Nevada, and this no doubt will continue to put downward pressure on regional prices for now.
Data specific to Colorado and its metro areas can be found in the FHFA quarterly data, which we discussed here.
The FHFA monthly index is calculated using purchase prices of houses backing mortgages that have been sold to or guaranteed by Fannie Mae or Freddie Mac.
The decline in house prices, both regionally and nationally, continues the trend that began in mid-2007 as prices as fallen almost constantly since the peak.
Notably, the FHFA index dows not show a "double dip" as can be seen in the Case-shiller data (discussed here) in which prices begin to recover in 2009, but then fall again after mid-2010. The FHFA monthly data shows nothing but losses following mid-2007. The second chart shows each month's house price index compared to the same month a year earlier:
In the second chart, we can also note that the Mountain region has performed more poorly (from a seller's perspective) than the national index. This runs contrary to some local experience and some statistics. The Case-Shiller data for the Denver metro area, for example shows that local prices did not decline as much as the national composite index following the financial panic in 2008.
Since we're looking at regional, data, however, we have to keep in mind that this data reflects house prices in Arizona and Nevada, and this no doubt will continue to put downward pressure on regional prices for now.
Data specific to Colorado and its metro areas can be found in the FHFA quarterly data, which we discussed here.
February new home sales fall to new lows
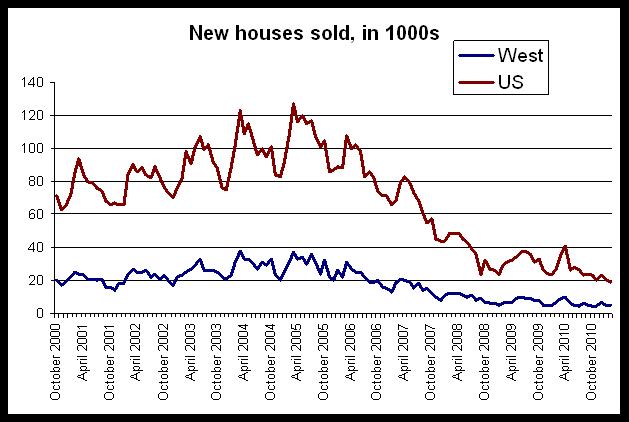
New single-family home sales fell again in the US, and in the West region, which includes Colorado, new home sales fell to the lowest February total recorded in at least ten years.
The report, which monitors sales activity for newly constructed houses, reported that in the West, new home sales were down, year over year, falling to 5,000 in February 2011 from 7,000 new homes sold in February 2010. Nationwide, sales dropped off 219.6 percent, falling from 27,000 to 19,000 during the same period.
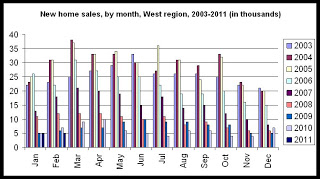
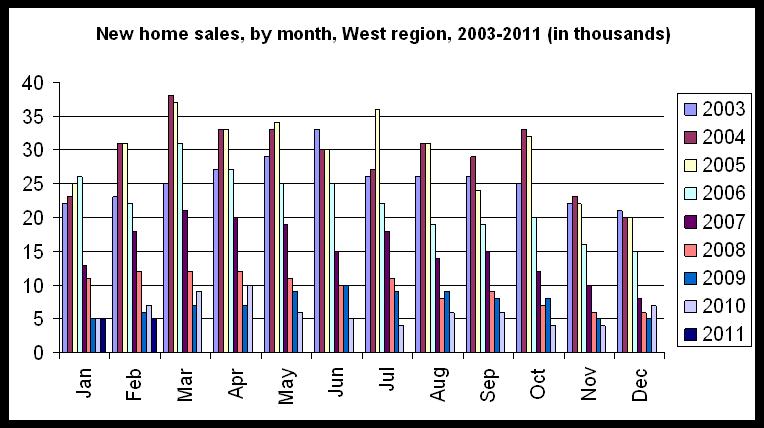
In February, new home sales were at the lowest point for the lowest volume in at least a decade. The first chart shows monthly new home sales totals for each month since 2003. February’s total of 5,000 new homes sold is below totals for both February 2010 and February 2009, and is near 4,000, the lowest monthly total recorded in any month during the last decade.
For the West region:
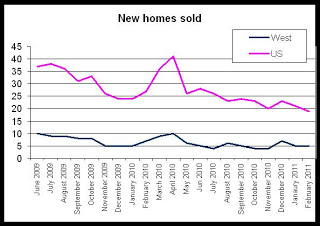
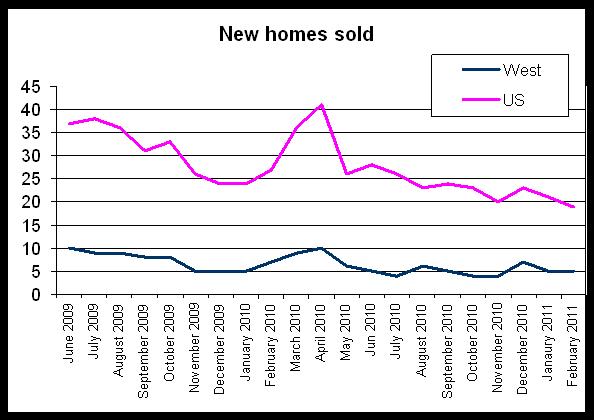
The drop off in home sales is likely tied to the end of the new home buyer tax credit which expired in April. The second chart shows that in both the West and in the US, new home sales were pushed up by the tax credit, and then fell quickly after April 2010. Note, however, that sales totals are largely flat in the West region while nationally, they continue to decline.
New home sales and new home inventory continue to fall and have generally followed a downward trend since the middle of the decade.
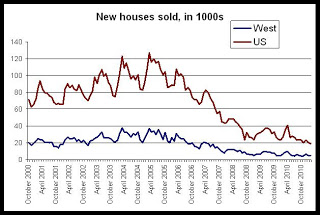
New home sales peaked during the spring and summer of 2005 and have trended downward since. The number of new houses sold in the United States is down 85 percent since the peak of March 2005, and new home sales in the West have fallen 86 percent since sales peaked in the region during March 2004.
The third chart shows the declines in both US and regional new home sales.
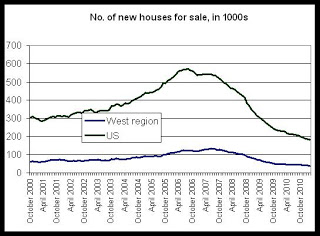
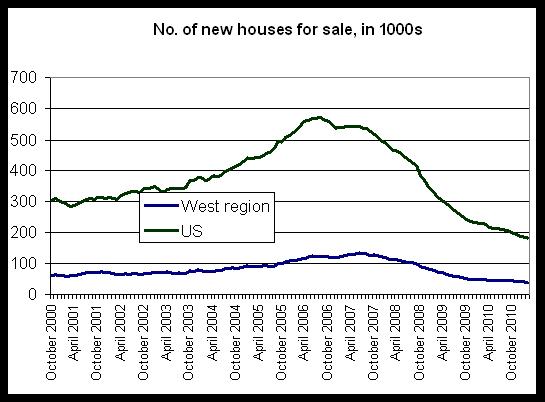
The number of new homes for sale has also fallen off considerably. The number of new houses for sale in the West has fallen 69 percent since the total peaked during June 2007, and the same total has fallen 68 percent in the US since the number of new homes for sale peaked in the US during August 2006.
The number of homes for sale grew more quickly in the West than in the US, with growth in the West topping 119.6 percent from January 2001 to June 2007, and the total grew 92.2 percent from January 2001 to August 2006. The fourth chart shows the rise of new homes for sale.
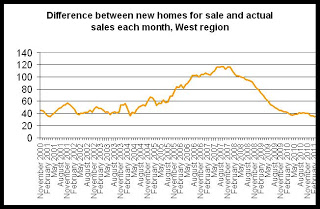
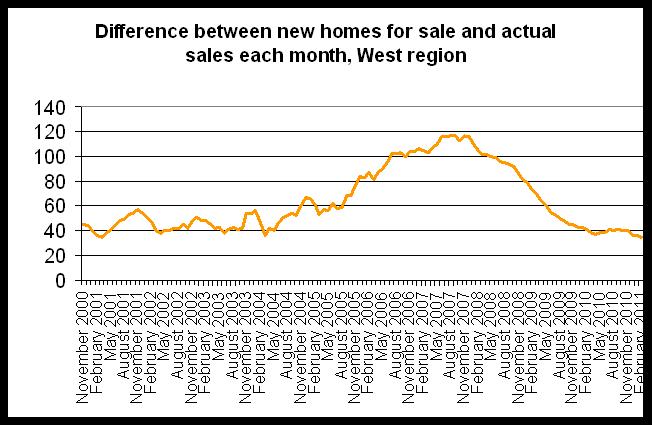
The fifth chart shows the difference between the number of homes in the West region for sale at the beginning of a month vs. the number of homes sold during that month. Interestingly, the build up in inventory can be seen as it grows from 2004 to 2007. Historically, it appears that the a “normal” difference between new homes for sale and new homes sold is somewhere between 40,000 and 50,000 homes in the region. This total reaches almost 120,000 homes during the peak months, and has now fallen to below 40,000 homes, where the total has remained for the past several months. The build-up in inventory clearly shows a situation in which the construction of new homes was exceeding the purchase of new homes. The difference between new homes for sale and new homes sold has declined considerably in recent year, although this is due primarily to a large decline in new construction, and not to significant increases in demand for new homes.
Summary: Nationally, new home sales and new home construction are very weak, and continue to move downward. In the West region, the trend in new home sales appears to have stabilized in recent months, with new sales totals consistently coming in between 4,000 and 7,000 sales since May 2010. However, the number of houses for sale did reach a new low in February with only 39,000 new houses available for sale.
Note: The Census Bureau only provides new home data at a regional level. Extrapolating to the Colorado is problematic with this data since the West region includes California, Arizona and Nevada, all of which experienced large housing bubbles. Nevertheless, regional banks, builders and housing providers will gain insights into how Colorado fits into the larger Western region.
The report, which monitors sales activity for newly constructed houses, reported that in the West, new home sales were down, year over year, falling to 5,000 in February 2011 from 7,000 new homes sold in February 2010. Nationwide, sales dropped off 219.6 percent, falling from 27,000 to 19,000 during the same period.
In February, new home sales were at the lowest point for the lowest volume in at least a decade. The first chart shows monthly new home sales totals for each month since 2003. February’s total of 5,000 new homes sold is below totals for both February 2010 and February 2009, and is near 4,000, the lowest monthly total recorded in any month during the last decade.
For the West region:
The drop off in home sales is likely tied to the end of the new home buyer tax credit which expired in April. The second chart shows that in both the West and in the US, new home sales were pushed up by the tax credit, and then fell quickly after April 2010. Note, however, that sales totals are largely flat in the West region while nationally, they continue to decline.
New home sales and new home inventory continue to fall and have generally followed a downward trend since the middle of the decade.
New home sales peaked during the spring and summer of 2005 and have trended downward since. The number of new houses sold in the United States is down 85 percent since the peak of March 2005, and new home sales in the West have fallen 86 percent since sales peaked in the region during March 2004.
The third chart shows the declines in both US and regional new home sales.
The number of new homes for sale has also fallen off considerably. The number of new houses for sale in the West has fallen 69 percent since the total peaked during June 2007, and the same total has fallen 68 percent in the US since the number of new homes for sale peaked in the US during August 2006.
The number of homes for sale grew more quickly in the West than in the US, with growth in the West topping 119.6 percent from January 2001 to June 2007, and the total grew 92.2 percent from January 2001 to August 2006. The fourth chart shows the rise of new homes for sale.
The fifth chart shows the difference between the number of homes in the West region for sale at the beginning of a month vs. the number of homes sold during that month. Interestingly, the build up in inventory can be seen as it grows from 2004 to 2007. Historically, it appears that the a “normal” difference between new homes for sale and new homes sold is somewhere between 40,000 and 50,000 homes in the region. This total reaches almost 120,000 homes during the peak months, and has now fallen to below 40,000 homes, where the total has remained for the past several months. The build-up in inventory clearly shows a situation in which the construction of new homes was exceeding the purchase of new homes. The difference between new homes for sale and new homes sold has declined considerably in recent year, although this is due primarily to a large decline in new construction, and not to significant increases in demand for new homes.
Summary: Nationally, new home sales and new home construction are very weak, and continue to move downward. In the West region, the trend in new home sales appears to have stabilized in recent months, with new sales totals consistently coming in between 4,000 and 7,000 sales since May 2010. However, the number of houses for sale did reach a new low in February with only 39,000 new houses available for sale.
Note: The Census Bureau only provides new home data at a regional level. Extrapolating to the Colorado is problematic with this data since the West region includes California, Arizona and Nevada, all of which experienced large housing bubbles. Nevertheless, regional banks, builders and housing providers will gain insights into how Colorado fits into the larger Western region.
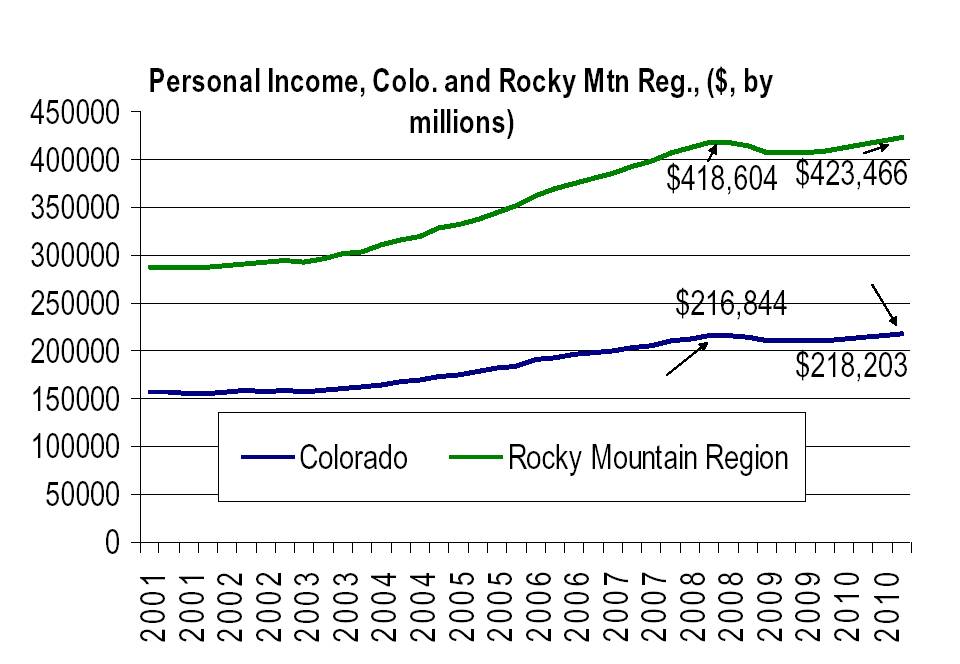
4thQ 2010 personal income rises above pre-recession levels
New personal income data for Colorado was released today by the BLS. See their regional site here.
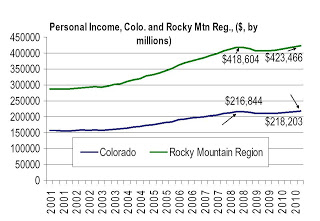
Colorado has now exceeded the personal income levels reached prior to the financial panic of 2008.
At $218.2 billion, personal income in Colorado has now exceeded the peak levels reached during the third quarter of 2008, when personal income reached $216.8 billion. Personal income is now up by 0.6 percent from previous levels.
During the third quarter of 2010, the rocky Mountain Region and the US as a whole had exceed pre-recession levels while Colorado lagged.
Colorado still lags the US and region. As of the 4th quarter of 2010, The Rocky Mountain region is 1.1 percent above peak levels and the US is 2.0 percent above its own previous peak which occurred during the second quarter of 2008.
Over ten years from the 4th quarter of 2001 to the fourth quarter of 2010, US personal income iuncreased 42.8 percent, and in Colorado it increased 40.0 percent. In the Rocky Mountain region, the increase for the same period was 47.3 percent.
This is just one measure in which Colorado underperformed compared to the nation during the last decade. Overall job growth and income growth was also more sluggish in Colorado during this period as compared to many regions in the United States. The most recent report also shows Colorado in the lowest quintile of all states for personal income growth.
As has been noted by some regional economists, Colorado has recovered more slowly since the most recent recession than have other states in the Rocky Mountain region.
However, over the past year, Colorado has nearly matched regional growth. From the 4th quarter of 2009 to the 4th quarter of 2010, personal income increased 3.8 percent nationwide, while it increased 3.4 percent in Colorado. Income increased 3.5 percent in the Rocky Mountain region during the same period.
Overall, Colorado's real estate markets and labor markets have not suffered as much as many markets, but in a variety of ways, including personal income, Colorado is recovering more slowly than the nation. January 2011 employment data also showed Colorado's unemployment rate moving above the nationwide unemployment rate for the first time since the most recent recession began in late 2007.
Generally speaking, personal income has been flat in Colorado since 2008 reflecting a sluggish job market and wage growth. An increase of 0.6 percent over the previous peak, being an estimate, is effectively a sideways movement in income.
Note: Personal income is the income received by all persons from all sources. Personal income is the sum of net earnings by place of residence, property income, and personal current transfer receipts. Total personal income will rise as population rises, even if household incomes are declining. Property income is rental income of persons, personal dividend income, and personal interest income. Net earnings is earnings by place of work (the sum of wage and salary disbursements, supplements to wages and salaries, and proprietors' income) less contributions for government social insurance, plus an adjustment to convert earnings by place of work to a place-of-residence basis. Personal income is measured before the deduction of personal income taxes and other personal taxes and is reported in current dollars (no adjustment is made for inflation).
Housing News Digest, March 23
Mountain states' housing prices dip 1.3%
The mountain states, including Colorado, saw housing prices dip 1.3 percent between December and January, according to the Federal Housing Finance Agency’s monthly House Price Index. That was tied with the South Atlantic region for the biggest regional monthly drop. National housing prices dropped 0.3 percent during the period.
Congressman Introduces Bill to Fund Foreclosure Mediation Programs
Congressman Steve Cohen (D-Tennessee) last week introduced a bill aiming to help prevent foreclosures across the country.
After the House passed measures to terminate federal foreclosure prevention programs, Cohen stepped in with a new measure to provide federal funding for foreclosure mediation programs.
Senior housing envisioned for former racquet club site
GLENWOOD SPRINGS, Colorado — A new development intended to serve a range of senior citizen housing needs, from active retirees to those in need of limited nursing care, is proposed to replace the defunct Roaring Fork Lodge project at 27th Street and Midland Avenue.
Crooked firm stirs honest debate
John Reinholdt II earlier this month was sentenced to 16 years in prison as the mastermind of a $3.4 million Ponzi mortgage scheme that defrauded lenders. But one unexpected legacy of Reinholdt’s scam is a court battle to determine whether loan servicers also are proxies for ”lenders” in real estate transactions under Colorado law.
At the heart of the issue is this question: can a servicer- the company that collect the mortgage payments each month - be paid at a sale or refinance of a property as an agent of the actual lender? Or, is it required that the actual holder of the note be present at each real estate closing?
New Home Sales Fall to Record Low in February
Sales of new single-family houses in February 2011 were at a seasonally adjusted annual rate of 250,000 ... This is 16 9 percent 16.9 (±19.1%)* below the revised January rate of 301,000 and is 28.0 percent (±14.8%) below the February 2010 estimate of 347,000.
Tuesday, March 22, 2011
CPI update: End-of-year 2010, February 2011
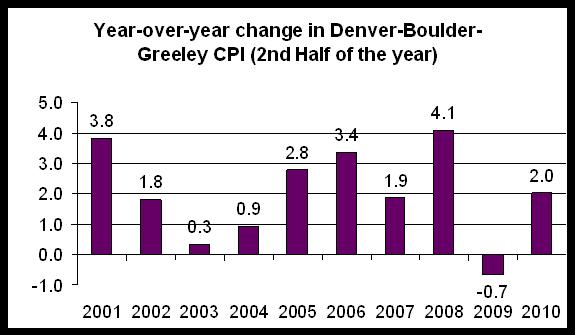
The Consumer Price Index for All Urban Consumers (CPI-U) for the Denver-Boulder-Greeley, Colo., metropolitan area increased 2.0 percent from the second half of 2009 to the second half of 2010 the U.S. Bureau of Labor Statistics reported on February 17. The Denver-Boulder-Greeley CPI is released twice per year.
The most recent index also shows a 1.4 percent increase in the index from the first half of 2010 to the second half of 2010. Year-over-year, the largest increases were found in transportation, which increased 6.2 percent, and
In recreation, which increased 6.1 percent. Food prices increased 1.2 percent, according to the report, and housing prices increased 1 percent.
Deflationary pressures continue in the market place in the face of stagnant wages and limited job growth. New layoffs in government jobs also provide downward pressure on demand for goods and services. On the other hand, commodity prices have been increasing in recent months. On March 16, The Labor Department reported that, nationally, wholesale prices jumped by the largest amount reported in two years due to the steepest rise in food prices in 36 years.
According to the Associated Press: “Food prices soared 3.9 percent last month, the biggest gain since November 1974. Most of that increase was due to a sharp rise in vegetable costs, which increased nearly 50 percent. That was the most in almost a year. Meat and dairy products also rose. “
According to the CPI Blue Card for the “West” region of the US, prices for all items rose 1.9 percent in February from a year earlier.
Housing News Digest, March 22
Connecticut foreclosure mediation bill moves out of banks committee
A bill to prevent mortgage lenders from foreclosing on property until a homeowner completes a foreclosure mediation process moved out of the Connecticut Assembly's banks committee.
If passed, H.B. 6351 would prohibit lenders from ordering a foreclosure sale or default judgment in Connecticut unless the homeowner has been notified of the possibility of seeking mediation assistance and has been allotted enough time to seek help and go through the mediation process.
Denver in top 10 of bigest rent-hike cities
Renters in parts of the Denver suburb Littleton, Colo., saw rents spike by 13.4% in 2010, and renters in southeastern Denver, Northglenn and Thornton saw rates rise by 9.7%, Axiometrics says. The Denver metro's average unemployment rate increased to about 8.3%, according to preliminary data from the BLS, from 7.9% in 2009.
Suthers sues lender
Colorado Attorney General John Suthers announced today that his office has filed a lawsuit against Western Sky Financial, a South Dakota-based online lender, and its principal, Martin A. Webb, for making unlicensed, high-interest loans to Colorado consumers.
Gas Prices vs. Consumer Sentiment
Another question asked in the survey pertains to expectations of inflation. Consumer expectations of inflation for the next year jumped from 3.4% to 4.6%. Again gasoline prices seem to figure more prominently in consumers' expectations than we might have expected, and again we can do a simple mechanical calculation of the direct effect. Gasoline prices have a weight of about 5% in the CPI, so if all other prices were held fixed, the 20% increase in gasoline prices we've seen over the last 3 months would add about one percentage point to the CPI.
Auction brings in $10M
A large Northern Colorado land auction with a portfolio worth more than $100 million four years ago brought in an estimated $10 million last week and has spurred some interest in the market, according to the seller.
Of more than 50 parcels totaling 1,500 acres of land for sale, Water Valley developer Martin Lind sold 13 commercial properties Thursday afternoon at the Embassy Suites Hotel in Loveland at a public auction. There were six reserve properties awaiting final approval by Lind as of Monday.
Monday, March 21, 2011
New grant awards in Boulder and Crowley counties
In Crowley County:
The Department of Local Affairs has announced that an additional $10,700 in CDBG funds has been awarded to Crowley County for the following project:
Crowley County, on behalf of the Tri-County Housing and Community Development Organization (TCHCDC), received an additional $10,700 to cover program administrative costs in order that staff may comply with the SAFE Act. In October 2009 Crowley County received a CDBG grant of $302,523 to continue the funding of their three-county (Bent, Crowley and Otero) Single-family, Owner-Occupied Rehabilitation Program for households at 80% of Area Median Income. The new grant funds will be used to provide low-interest loans for twenty-five (25) rehabilitation projects and five (5) essential repairs. This SFOO Rehabilitation Program has received funding from the Colorado Division of Housing since 1991 and has completed the rehabilitation of over 400 owner- occupied homes.
In Boulder County:
The Department of Local Affairs has announced that $400,000 in HOME CHDO Reserve (AKA CHDO set aside) (HMCR) funds have been awarded to Boulder County for the following project:
Longmont Housing Development Corporation (LHDC) has received a grant of $400,000 in HOME CHDO set aside funds to assist in the new construction of 50 units of affordable senior rental housing in Longmont with the following unit mix: 49 one-bedroom units for households at or below 50 percent area median income, and 1 unrestricted two-bedroom for a resident manager. The project will utilize HUD 202 project funding and will include rental assistance for 49 units.
Metro Denver and Colorado Springs: Home sales fall, but prices generally stable
Earlier, we looked at statewide median home prices and existing home sales, as provided by the REALTORS' public data.
Now, let's look at Colorado's two largest markets: metro Denver and the Colorado Springs metro area.
In both metro Denver and in the Colorado Springs area, the median home prices are more or less where they were in 2004.
I've placed the median home price curves above the year-over-year change curves to give a sense of how much prices have moved in recent months. In both cases, it looks like late 2009 and early 2010 saw some upward pressure in prices as a result of the homebuyer tax credits, but following the end of the credits, prices have flattened out and moved little.
Interestingly, the Colorado Springs area did not experience the big year-over-year increases in median home prices in late 2009 and early 2010 that occurred in metro Denver due to the tax credits. In Colorado Springs, the year-over-year changes during that period never exceeded 10 percent, while in metro Denver, in January and February of 2010, the year-over-year change in prices was more than 15 percent.
Recent price increases appear to be more subdued in the Colorado Springs area:
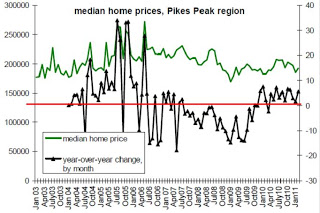
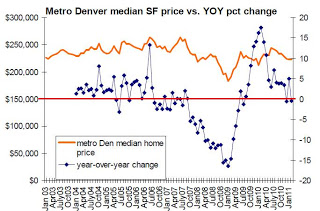
With existing home sales, the Denver metro and the Colorado Springs metro areas follow the larger national trend (covered here) of declining home sales. The movement in home sales in both the Denver and Colorado Springs areas more or less mimics the statewide trend seen here.
In metro Denver, only 4 of the last 24 months showed year-over-year increases in home sales closings. In Colorado Springs, on the other hand, more than half of the last 24 months showed positive year-over-year changes.
There are a few differences to note between the two regions:
1. Prices began to fall in the Colorado Springs area before the Denver metro area. This may possibly be due to a dearth in demand for purchase homes that grew in response to to the drop in the number of active military in the region following the beginning of the Iraq war in 2003.
2. The number of troops returning to the Colorado Springs region grew at the same time that the homebuyer tax credits were put in place. This may be the reason that there appears to be a more sustained period of year-over-year increases in home sales transactions/closings from mid-2009 to mid-2010.
3. In metro Denver, on the other hand, the period of positive year-over-year comparisons in home sales closings is not nearly as long.
4. However, the difference in home sales activity between the two regions has not produced significant growth in home prices in either either as shown by the two graphs above. Prices continue to be generally stable in both regions, with possible continued and very slow movement downward.
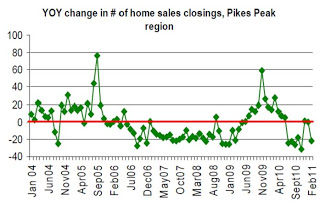
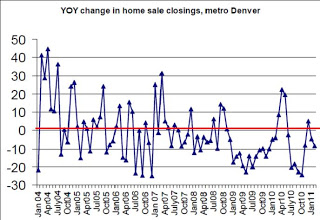
Now, let's look at Colorado's two largest markets: metro Denver and the Colorado Springs metro area.
In both metro Denver and in the Colorado Springs area, the median home prices are more or less where they were in 2004.
I've placed the median home price curves above the year-over-year change curves to give a sense of how much prices have moved in recent months. In both cases, it looks like late 2009 and early 2010 saw some upward pressure in prices as a result of the homebuyer tax credits, but following the end of the credits, prices have flattened out and moved little.
Interestingly, the Colorado Springs area did not experience the big year-over-year increases in median home prices in late 2009 and early 2010 that occurred in metro Denver due to the tax credits. In Colorado Springs, the year-over-year changes during that period never exceeded 10 percent, while in metro Denver, in January and February of 2010, the year-over-year change in prices was more than 15 percent.
Recent price increases appear to be more subdued in the Colorado Springs area:
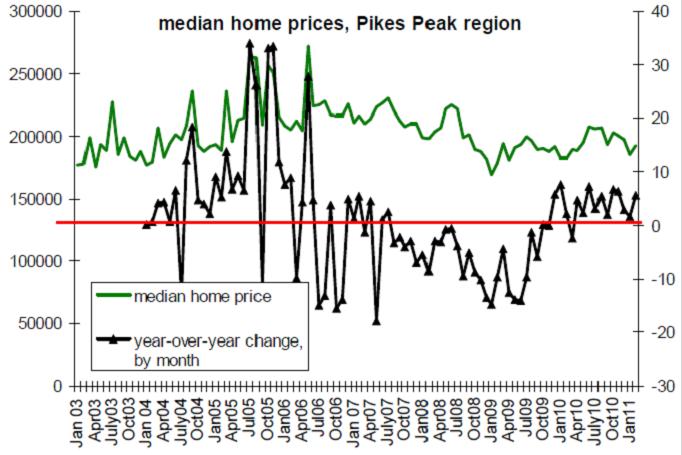

With existing home sales, the Denver metro and the Colorado Springs metro areas follow the larger national trend (covered here) of declining home sales. The movement in home sales in both the Denver and Colorado Springs areas more or less mimics the statewide trend seen here.
In metro Denver, only 4 of the last 24 months showed year-over-year increases in home sales closings. In Colorado Springs, on the other hand, more than half of the last 24 months showed positive year-over-year changes.
There are a few differences to note between the two regions:
1. Prices began to fall in the Colorado Springs area before the Denver metro area. This may possibly be due to a dearth in demand for purchase homes that grew in response to to the drop in the number of active military in the region following the beginning of the Iraq war in 2003.
2. The number of troops returning to the Colorado Springs region grew at the same time that the homebuyer tax credits were put in place. This may be the reason that there appears to be a more sustained period of year-over-year increases in home sales transactions/closings from mid-2009 to mid-2010.
3. In metro Denver, on the other hand, the period of positive year-over-year comparisons in home sales closings is not nearly as long.
4. However, the difference in home sales activity between the two regions has not produced significant growth in home prices in either either as shown by the two graphs above. Prices continue to be generally stable in both regions, with possible continued and very slow movement downward.

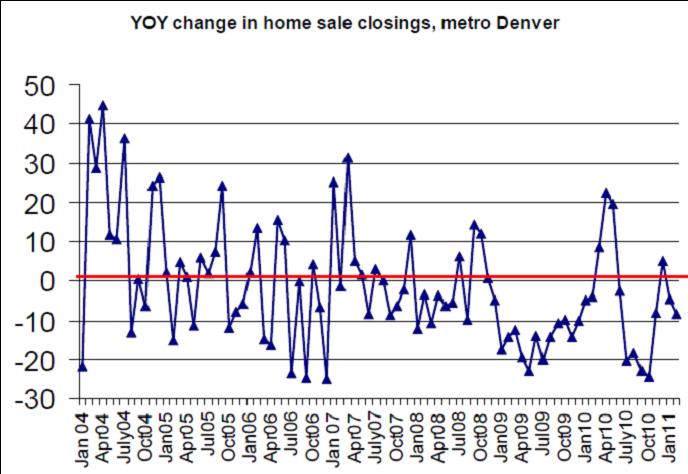
Existing home sales fall nationally, and in Colorado
Nationwide, existing home sales fell in February. According to MarketWatch:
Colorado's February numbers were recently released by the Colorado REALTORS Association. Statewide data really only helps give us a limited overall glimpse of the state, since the different markets of the state can vary significantly. Nevertheless, it helps to get a grasp of the whole state.
Colorado has followed the national trend with a February drop in home sale closings as well. As the first charts shows, the number of closings in February 2011 was near January 2011's eight-year low of 3,125 closings. February 2011 ended up a bit with 3,185 closings statewide, but February 2011 remains down 8 percent from Feb 2010's total of 3,461.
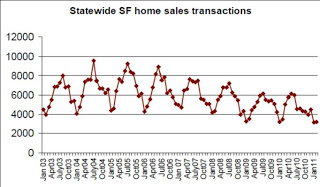
February's numbers also continue the trend in total closings falling below 2010's totals for each month. In other words, seven of the past eight months have shown fewer closings than during the same month the previous year.
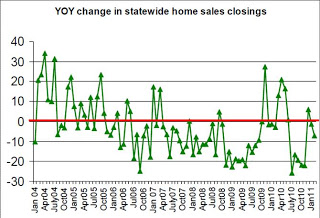
Prices have generally shown a fair amount of stability according to the Realtor data. In line with the Case-Shiller data and the FHFA data, year-over-year price changes have hovered between 1 percent and -10 percent, which if coupled with the CS and FHFA data suggests continued stability. The Realtor data tends to be more volatile in general, so the recent trend suggests a continued and very slow decline in prices overall. The median price is certainly down from mid-2009, but is moving at a very slow pace.
The statewide median home price in Colorado was $201,000 during February, down 5.2 percent from February 2010 when the median home price was $212,000.
The continued decline in total closings will no doubt continue to push this down, although there have been no sudden or drastic changes of any kind in quite some time.
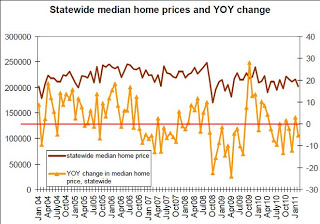
Case-Shiller will release January data next week.
Sales of new and used homes have been down in the dumps since a housing market bubble burst after the onset of the 2007-2009 recession. A high unemployment rate, combined with stricter lending standards, have made it harder for Americans to buy homes despite low interest rates.
Existing-home sales, for instance, were 2.8% lower in February 2011 than they were in the same month a year earlier.
Colorado's February numbers were recently released by the Colorado REALTORS Association. Statewide data really only helps give us a limited overall glimpse of the state, since the different markets of the state can vary significantly. Nevertheless, it helps to get a grasp of the whole state.
Colorado has followed the national trend with a February drop in home sale closings as well. As the first charts shows, the number of closings in February 2011 was near January 2011's eight-year low of 3,125 closings. February 2011 ended up a bit with 3,185 closings statewide, but February 2011 remains down 8 percent from Feb 2010's total of 3,461.
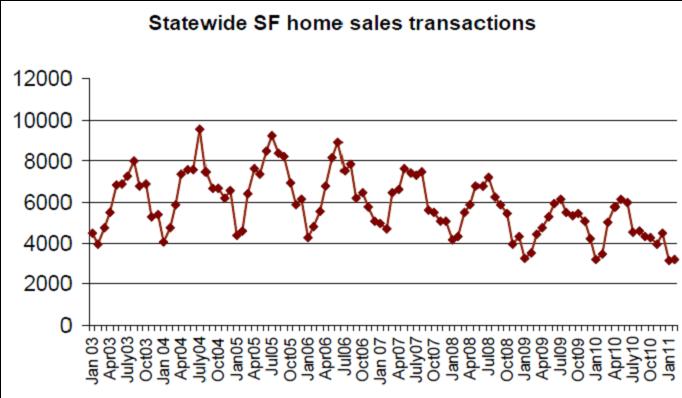
February's numbers also continue the trend in total closings falling below 2010's totals for each month. In other words, seven of the past eight months have shown fewer closings than during the same month the previous year.
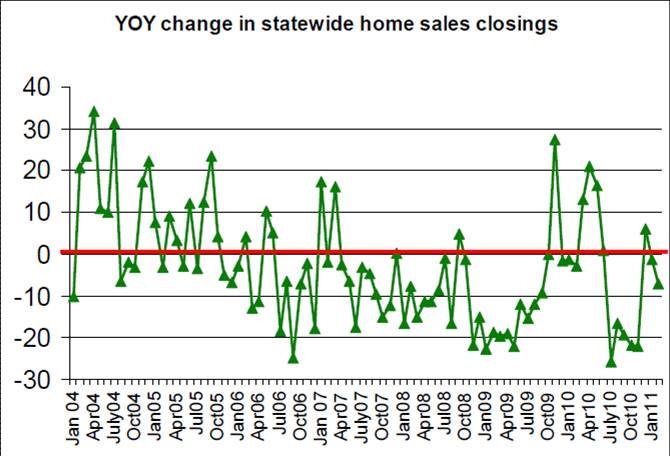
Prices have generally shown a fair amount of stability according to the Realtor data. In line with the Case-Shiller data and the FHFA data, year-over-year price changes have hovered between 1 percent and -10 percent, which if coupled with the CS and FHFA data suggests continued stability. The Realtor data tends to be more volatile in general, so the recent trend suggests a continued and very slow decline in prices overall. The median price is certainly down from mid-2009, but is moving at a very slow pace.
The statewide median home price in Colorado was $201,000 during February, down 5.2 percent from February 2010 when the median home price was $212,000.
The continued decline in total closings will no doubt continue to push this down, although there have been no sudden or drastic changes of any kind in quite some time.
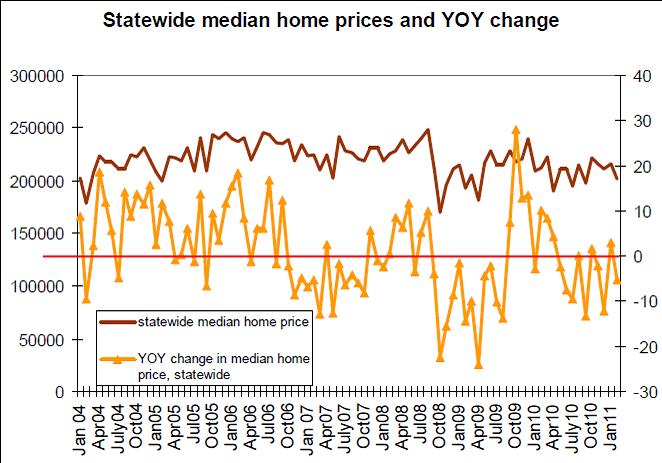
Case-Shiller will release January data next week.
Housing News Digest, March 21
California wants $20,000 per foreclosure from lenders
ACCE has teamed up with a California assemblyman who is proposing legislation that would force lenders to pay $20,000 for each home foreclosure they initiate in California.
Assemblyman Bob Blumenfield (D- San Fernando Valley) said the money would go to local schools, fire departments, and other community services, in an effort to make up for lost property taxes and other state expenses that arise from foreclosures.
Supreme Court Lets Fed Bailout Records Release Stand
The Supreme Court let stand a ruling that the U.S. Federal Reserve must disclose details about its emergency lending programs to banks during the financial crisis in 2008.
A group representing major commercial banks had asked the high court to reverse a ruling by a federal appeals court that required disclosure of the lending records.
Homeowners frustrated with home modification loan process
The process is frustrating. The banks don't return phone calls or deny your modification without giving you a clear reason. So we decided to investigate how the system works.
Judy Landrum recently went through a home modification. She calls the experience a big game. Medical bills made it tougher and tougher to pay her mortgage. Like so many Americans, she'd heard of Obama's plan to help Americans avoid foreclosure. She thought her hardship would make her eligible to get help from her bank.
Facets of homelessness main focus of forum
LOVELAND - The many facets of homelessness in Northern Colorado were the main topic of discussion at a forum on homelessness held at Ferguson High School in Loveland.
Sales of Previously Owned Homes Slump 9.6%
Existing-home sales fell in February following three straight monthly increases, according to data released by the National Association of Realtors (NAR) Monday.
Existing-home sales, which are completed transactions that include single-family, townhomes, condominiums, and co-ops, dropped 9.6 percent to an annual rate of 4.88 million in February from an upwardly revised 5.40 million in January. February’s reading is 2.8 percent below the 5.02 million pace for the same period last year.
Treasury tiptoes toward housing exit
Don't look now, but the government is gingerly tugging at one of the smaller slats propping up the mortgage market.
Treasury said Monday it will sell a big portfolio of mortgage-backed bonds over the next year or so, in a move to wind down a crisis-era program providing financing for residential housing.
The move comes as house prices are once again headed lower -- though not because loans, recently around 5% for a 30-year conforming mortgage, are expensive. So it is with government support for housing: even programs that succeed on their own modest terms, as this one did, are tarred by the feds' failure to come up with a coherent policy objective.
Friday, March 18, 2011
Greccio Housing awarded $23,500
The Department of Local Affairs has announced that $23,500.00 in HOME CHDO Operating (HMCO) funds has been awarded to El Paso County for the following project:
Greccio Housing Unlimited, Inc. received a $23,500 CHDO operating grant to assist with development staff salaries to conduct due diligence for the development of and/or acquisition and rehabilitation of multi-family rental units in Colorado Springs. CHDO operating funds will be used for predevelopment activities including: researching and analyzing of financing options, evaluating proformas, reviewing contracts, coordinating legal documents, and evaluating property management options. Greccio incorporates many services through their Resident Enrichment Program including rent and utility assistance, transportation support, and food provision. In addition, Greccio assists its residents in becoming self-sufficient through financial literacy training, computer training, and employment assistance.
Greccio Housing Unlimited, Inc. received a $23,500 CHDO operating grant to assist with development staff salaries to conduct due diligence for the development of and/or acquisition and rehabilitation of multi-family rental units in Colorado Springs. CHDO operating funds will be used for predevelopment activities including: researching and analyzing of financing options, evaluating proformas, reviewing contracts, coordinating legal documents, and evaluating property management options. Greccio incorporates many services through their Resident Enrichment Program including rent and utility assistance, transportation support, and food provision. In addition, Greccio assists its residents in becoming self-sufficient through financial literacy training, computer training, and employment assistance.
Housing News Digest, March 18
US Cost of Living Hits Record, Passing Pre-Crisis High
A special index created by the Labor Department to measure the actual cost of living for Americans hit a record high in February, according to data released Thursday, surpassing the old high in July 2008. The Chained Consumer Price Index, released along with the more widely-watched CPI, increased 0.5 percent to 127.4, from 126.8 in January. In July 2008, just as the housing crisis was tightening its grip, the Chained Consumer Price Index hit its previous record of 126.9.
Colorado Medical Marijuana: HUD Says MMJ Policies Up To Local Housing Authorities
A Colorado-based non-profit has received a statement from the U.S. Department of Housing and Urban Development (HUD) making it clear that local housing authorities themselves are responsible for determining policies regarding medical marijuana use by recipients of federal housing assistance.
Lind auction draws crowd but bids generally low
LOVELAND - A large gathering of bargain hunters turned out for one of the biggest land auctions ever held in Northern Colorado on March 17, but bids on 32 properties offered by Windsor developer Martin Lind were generally low.
The auction, conducted by J.P. King auction house, drew more than 400 bidders and onlookers to the Embassy Suites Hotel and Conference Center, with a reported 117 registered bidders.
Brothers pays $5.1 million for apartment
The nonprofit housing agency Brothers Redevelopment paid $5.1 million for the 81-unit William Tell apartment community in Uptown, continuing itss efforts to provide affordable housing available for low-income and disabled residents.
Brothers leveraged a $917,500 grant from the Mennonite Housing Development Corp. and worked with FirstBank and Funding Partners to purchase the 47-year-old building at 1599 Williams St. The building includes studios and one- and two-bedroom subsidized units for qualified low-income tenants.
RE/MAX: February home sales down 3%
February home sales dropped 3% from one year ago, but increased from January, according to the RE/MAX national housing report.
It's the first time in four months that the yearly difference did not improve from the previous month.
Thursday, March 17, 2011
FTC issues final rule on Mortgage Assistance Relief Services
This a little late but it may still be of interest to some readers:
In December, the FTC issued its final rule on Mortgage Assistance Relief Services (MARS). Here is the link to the Federal Register.
SUMMARY: Pursuant to the 2009 Omnibus Appropriations Act (Omnibus Appropriations Act), as clarified by the Credit Card Accountability Responsibility and Disclosure Act of 2009 (Credit CARD Act), the Commission issues a Final Rule and Statement of Basis and Purpose (SBP) concerning the practices of for-profit companies that, in exchange for a fee, offer to work on behalf of consumers to help them obtain modifications to the terms of mortgage loans or to avoid foreclosure on those loans. The Final Rule, among other things, would: prohibit providers of such mortgage assistance relief services from making false or misleading claims; mandate that providers disclose certain information about these services; bar the collection of advance fees for these services; prohibit anyone from providing substantial assistance or support to another they know or consciously avoid knowing is engaged in a violation of the Rule; and impose recordkeeping and compliance requirements.
Housing News Digest, March 17
Crisis not over, despite foreclosure drop
Thousands of fewer Colorado consumers losing their homes is good news, but it is way too early to declare an end to the state’s foreclosure crisis, experts told InsideRealEstateNews today.
“Really, what we have done is plateaued at a very high number,” McMaken said. “What we really need to see is filings fall to about 20,000 a year - a 50 percent drop - before we can say that foreclosure problem seems to be a thing of the past. We are still in the midst of a really bad situation.”
Foreclosure filings, sales dive in February
El Paso County, which includes Colorado Springs, recorded 288 filings in February, a 23.4 percent year-over-year decline. Every other metro-area county also saw a decline, except for Broomfield, which showed no change. Douglas County led the way with a 51.5 percent drop in foreclosure filings last month.
House Votes to Rescind $1B in Neighborhood Stabilization Grants
The U.S. House of Representatives voted Wednesday to pull the plug on HUD’s Neighborhood Stabilization Program (NSP) and rescind $1 billion in grant money that was appropriated under the Dodd-Frank Act but has not yet been awarded.
NSP provides funding to local governments and nonprofits for the acquisition and redevelopment of foreclosed and abandoned homes.
Lind’s large auction will be ‘interesting,’ observers say
Colorado real estate watchers will focus at high noon Thursday on the hefty chunk of Windsor developer Martin Lind’s commercial portfolio being put up for auction.
Some observers are calling it an unusual auction both in size and nature of the properties for sale. Recent real estate auctions have leaned toward residential-based, rather than commercial, events.
Larimer County seeing double-digit drops; some predict numbers will rise again
Larimer County is helping lead that decline with double-digit drops across the board in both foreclosure filings and sales.
Month over month for February, Larimer County saw a 14.2 percent decline in filings and a 20 percent drop in sales. Looking at year over year, Larimer saw a 32.2 percent and a 12.3 percent decline in filings and sales respectively.
Weld’s February declines in foreclosure filings among state’s highest
Weld posted 322 filings in January and February, compared with 453 in the year-ago period, a 28.9 percent decrease. Denver had a Front Range-leading 30.8 percent decrease, while the state posted an 18.8 percent decline. Of the other Front Range metropolitan counties, Boulder dropped 28.1 percent, Larimer 22.8 percent, Arapahoe 20 percent, Jefferson 19.7 percent, Pueblo 9.1 percent, Douglas 6.6 percent and El Paso 5.7 percent. Only Broomfield County posted an increase in foreclosure filings for the first two months in year-over-year data, climbing 4.3 percent.
Steep drop for Colorado urban foreclosures
...spokesman for the Colorado Division of Housing, said there has been an “overall downward trend in foreclosure filings since the end of 2009, but February’s large drop should be at least partially attributed to a change in how foreclosures are being processed.”
Wednesday, March 16, 2011
Behind the recent drop off in foreclosures in Colorado
The most recently released foreclosure data, available here, shows that Colorado experienced an unusually sharp decline in foreclosures during February.According to the press release:
As the first paragraph notes, the big driver behind this decline is the continued slow place in the processing of foreclosures put in place by the industry late last year. It appears that foreclosures have still not bounced back from this change in the process.
Colorado is not alone in feeling the effects of this change. In its March 10 release of foreclosure data, Realtytrac noted that national foreclosure numbers were at a 36-month low, which was similar to our own numbers showing a 30-month low. Realtytrac's press release contained the following:
This is a good explanation of the recent drops in foreclosure numbers.
Here in Colorado, as the graph below shows, there was already an established trend downward in foreclosure filings, due to successes with housing counseling, and due to general stability in the real estate markets (which we've discussed here).
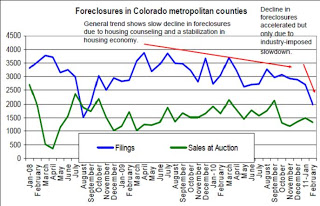
The ongoing slowdown in the processing of foreclosures by mortgage companies has caused the downward trend to accelerate, although this accelerated rate is not likely to be sustained.
One reason we suspect that foreclosure numbers will creep back up to follow the older trend line is the fact that during the fourth quarter of 2010, when the slowdown was first put in place, the foreclosure inventory actually increased following a period of decline in the inventory. This tells us that foreclosures are not actually going away at an accelerated pace, since the slowdown in processing has seemed to cause a backlog in the foreclosure inventory. The increase in inventory suggests that pending foreclosure are simply being evaluated longer, or put on hold, rather than being cured or withdrawn from the process. See below (Source: MBA Delinquency Survey):
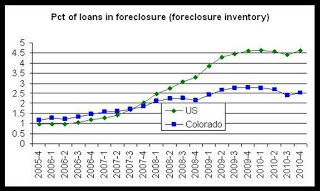
The more measured rate of decline in foreclosure totals, seen from late 2009 to late 2010 in the first graph above, is more likely to be representative of the overall housing economy trends in Colorado, and so an artificially steep drop should be viewed with some reservation.
New foreclosure filings dropped to a 30-month low in Colorado’s metropolitan counties during February. According to a report released today by the Colorado Division of Housing, foreclosure sales fell 26.4 percent from January to February as mortgage servicers continued to process foreclosures at an unusually slow pace in response to the “robo-signing” controversy that surfaced last fall.
Comparing year-over-year, foreclosure filings fell 34.7 percent in February, and year-to-date comparisons show that for the period including both January and February this year, foreclosure filings are down 18.8 percent as compared to the same period last year.
As the first paragraph notes, the big driver behind this decline is the continued slow place in the processing of foreclosures put in place by the industry late last year. It appears that foreclosures have still not bounced back from this change in the process.
Colorado is not alone in feeling the effects of this change. In its March 10 release of foreclosure data, Realtytrac noted that national foreclosure numbers were at a 36-month low, which was similar to our own numbers showing a 30-month low. Realtytrac's press release contained the following:
“Foreclosure activity dropped to a 36-month low in February as allegations of improper foreclosure processing continued to dog the mortgage servicing industry and disrupt court dockets,” said James J. Saccacio, chief executive officer of RealtyTrac. “While a small part of February’s decrease can be attributed to it being a short month and bad weather, the bottom line is that the industry is in the midst of a major overhaul that has severely restricted its capacity to process foreclosures. We expect to see the numbers bounce back, but that will likely take several months.”
This is a good explanation of the recent drops in foreclosure numbers.
Here in Colorado, as the graph below shows, there was already an established trend downward in foreclosure filings, due to successes with housing counseling, and due to general stability in the real estate markets (which we've discussed here).

The ongoing slowdown in the processing of foreclosures by mortgage companies has caused the downward trend to accelerate, although this accelerated rate is not likely to be sustained.
One reason we suspect that foreclosure numbers will creep back up to follow the older trend line is the fact that during the fourth quarter of 2010, when the slowdown was first put in place, the foreclosure inventory actually increased following a period of decline in the inventory. This tells us that foreclosures are not actually going away at an accelerated pace, since the slowdown in processing has seemed to cause a backlog in the foreclosure inventory. The increase in inventory suggests that pending foreclosure are simply being evaluated longer, or put on hold, rather than being cured or withdrawn from the process. See below (Source: MBA Delinquency Survey):
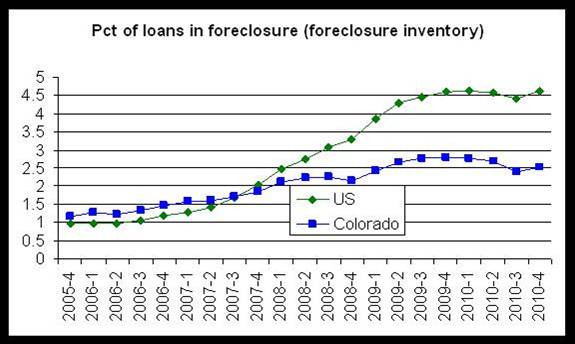
The more measured rate of decline in foreclosure totals, seen from late 2009 to late 2010 in the first graph above, is more likely to be representative of the overall housing economy trends in Colorado, and so an artificially steep drop should be viewed with some reservation.
2011 Housing Now Conference: Call for Workshop Proposals
2011 HOUSING COLORADO NOW! CONFERENCE
CALL FOR WORKSHOPS
Conference Dates: Tuesday, October 11 through Friday, October 14, 2011
in Vail, Colorado
Deadline for Proposals: Tuesday, April 12, 2011
The 23rd annual Housing Colorado NOW! Conference seeks workshop proposals addressing successful affordable housing best practices, tools and trends for rural/mountain resort and urban communities in the areas of housing development, finance, property management, sustainability, homeownership and homeowner counseling, advocacy and policy, support services, resident engagement, and professional and organizational development serving the full spectrum of housing needs from homelessness prevention to workforce and senior housing.
Click here to download the RFP form.
Northeast Denver Housing Center receives $25,000 loan
The Department of Local Affairs has announced that $25,000.00 in HOME CHDO Reserve (aka CHDO Set Aside) (HMCR) funds has been awarded to Denver County for the following project: Northeast Denver Housing Center, Inc (NDHC) is awarded a CHDO predevelopment loan for $25,000. As the project sponsor, NDHC will act as the fiscal agent to pass through CHDO predevelopment loan funds to Denver Education Senior Citizens, Inc (DESCI), a nonprofit housing corporation that owns and manages a 93 unit senior property in Denver. DESCI will use the CHDO predevelopment loan funds to conduct a market analysis, perform an architectural and engineering assessment and hire a consultant to design a strategy for financing the rehabilitation of the 52 year-old building.
Note: This blog entry previously stated incorrectly that NDHC received a $50,000 loan. We regret the error.
Note: This blog entry previously stated incorrectly that NDHC received a $50,000 loan. We regret the error.
Foreclosure filings in Colorado fall to 30-month low
Click here for the full report.
New foreclosure filings dropped to a 30-month low in Colorado’s metropolitan counties during February. According to a report released today by the Colorado Division of Housing, foreclosure sales fell 26.4 percent from January to February as mortgage servicers continued to process foreclosures at an unusually slow pace in response to the “robo-signing” controversy that surfaced last fall.
Comparing year-over-year, foreclosure filings fell 34.7 percent in February, and year-to-date comparisons show that for the period including both January and February this year, foreclosure filings are down 18.8 percent as compared to the same period last year. There were 1,986 new foreclosure filings during February 2010 in Colorado’s metropolitan counties, compared to February 2010’s total of 3,042.
Foreclosure sales at auction also continued to fall. Foreclosure sales fell 19.6 percent from February 2010 to February 2011. Year-to-date comparisons show that sales are down 20.8 percent for the period including both January and February this year as compared to the same period last year. Sales also fell 10.7 percent from January to February. There were 1,338 foreclosure sales during February 2011 in the metro counties, and 1,499 sales during February of last year.
Foreclosure filings are the initial filing that begins the foreclosure process, and foreclosure sales totals are the total number of foreclosures that have been sold at auction at the end of the foreclosure process.
With the exception of Broomfield County, all metropolitan counties showed decreases in foreclosure filings of 20 percent or more, comparing year-over-year. From February 2010 to February 2011, foreclosure filings were flat in Broomfield County, but foreclosure filings fell 51.5 percent in Douglas County and 45.8 percent in Denver County.
Foreclosure sales totals also showed declines across the state. With the exception of Denver County, all metropolitan counties showed decreases in foreclosure sales at auction, comparing year-over-year. From February 2010 to February 2011, foreclosure sales were up 9.3 percent in Denver County while they fell 38.8 percent in Douglas County and 37.4 percent in El Paso County.
The Division of Housing’s monthly foreclosure report surveys foreclosure activity in the twelve largest counties of Colorado. The report is a supplement to the Division’s quarterly foreclosure report that includes all counties in Colorado.
Housing News Digest, March 16
Housing Starts decrease sharply in February
Total housing starts were at 479 thousand (SAAR) in February, down 22.5% from the revised January rate of 618 thousand, and barely up from the all time record low in April 2009 of 477 thousand (the lowest level since the Census Bureau began tracking housing starts in 1959).
Wholesale prices up 1.6 pct. on steep rise in food
Food prices soared 3.9 percent last month, the biggest gain since November 1974. Most of that increase was due to a sharp rise in vegetable costs, which increased nearly 50 percent. That was the most in almost a year. Meat and dairy products also rose.
Separately, the Commerce Department said home construction plunged to a seasonally adjusted 479,000 homes last month, down 22.5 percent from the previous month. It was lowest level since April 2009, and the second-lowest on records dating back more than a half-century.
New foreclosure filings fall to 30-month low in Colorado
New foreclosure filings dropped to a 30-month low in Colorado's metropolitan counties during February, according to a report released today.
More help available to Coloradans facing foreclosure
DENVER - Colorado Attorney General John Suthers has awarded a two-year, $600,000 grant to the nonprofit Foreclosure Hotline in hopes of helping more homeowners trying to avoid losing their homes. "The Colorado Foreclosure Hotline is the best resource available for consumers facing foreclosure," Suthers said in a Tuesday news release.
Colorado's foreclosure filings hit 30-month low
Month-over-month for February, Larimer County saw a 14.2 percent decline in filings and a 20 percent drop in sales. Looking at year-over-year, Larimer saw a 32.2 percent and a 12.3 percent decline in filings and sales respectively.
Subscribe to:
Posts (Atom)