Pending home sales in the western US in October rose 6.6 percent year over year, according to new pending home sales data released today by the National Association of Realtors. According to the press release:
Lawrence Yun, NAR chief economist, said improved contract activity is a hopeful sign. “Home sales have been plodding along at a sub-par level while interest rates are hovering at record lows and there is a pent-up demand from buyers who normally would have entered the market in recent years. We hope this is indicates more buyers are taking advantage of the excellent affordability conditions,” he said.
The pending home sales index for the western region of the US, which includes Colorado, rose from 105.3 to 112.3, year over year, while the national index rose 7.3 percent from 84.0 to 90.1, year over year.
All regions of the country showed gains in pending home sales, year over year.
Month to month, the pending home sales index fell 5.0 percent in the West and rose 8.3 percent nationally. The west was the only region to report a month-to-month decline in pending sales although sales activity tends to generally fall from September to October.
The West showed the second-smallest increase in the index among all regions, after the Northeast which showed an increase of 1.5 percent. The Midwest showed the biggest gains with a year-over-year increase of 10.8 percent.
Pending home sales help us predict future closings, so this news suggests that closings in November may be stronger in 2011 in the year-over-year comparisons.
An analysis of 12-month moving averages for home sales closings through September in Colorado showed an ongoing and slow decline of overall sales activity in the state. The statewide data has shown more weakness in home sales activity than has the regional NAR data in recent months.
Wednesday, November 30, 2011
Beige Book: real estate in Kansas City District remained "sluggish"
The Kansas City Fed released its Beige Book today for the Fed's tenth district which includes Colorado. In the District, residential and commercial real estate remained sluggish, while overall growth "edged higher."
Sections of interest:
Sections of interest:
Real Estate and Construction
Residential and commercial real estate activity remained generally sluggish in October and early November. Housing starts dropped from the previous survey, with construction of higher-priced homes particularly weak. Expectations for future homebuilding remained slow, and materials were generally available. Sales at residential construction supply firms improved somewhat, driven in part by an increase in remodeling as more consumers updated existing homes. Home sales picked up slightly but remained weak overall. Expectations for future home sales were more positive than in previous months, and home inventories drifted lower as home prices continued to ease in most areas. Mortgage lending activity was positive and remained above year-ago levels, though some contacts reported continued buyer financing difficulties. Commercial real estate activity edged higher from the previous survey, but remained sluggish overall with little further improvement expected. Vacancy rates dropped slightly, though they were expected to rise somewhat in future months. Office prices and rents increased but remained below year-ago levels, and expectations were flat. One contact in Joplin, Missouri noted considerable building activity as a result of the devastating tornado in that area last spring.
Banking
Most bankers reported steady or stronger loan demand, stable or improving loan quality, and increased deposits compared with the previous survey. Overall loan demand increased marginally as demand for commercial and residential real estate loans strengthened, demand for consumer installment loans declined, and demand for commercial and industrial loans weakened slightly. Credit standards remained largely unchanged in all major loan categories, and deposits increased for the seventh straight survey. Bankers generally reported loan quality as steady or improving compared to a year ago, with even more improvement expected for the next six months.
Housing News Digest, November 30
New home market picking up
A housing report released Tuesday afternoon provides the latest sign that the worst may be over for the Denver-area home building market, the hardest-hit sector of the local and national economies.
Home builders in the metro area - from Boulder to Castle Rock, Erie to Englewood - pulled 2,959permits in the first 10 months of the year for single-family detached houses, 2 percent more than the 2,896 during the same period in 2010, according to the report by the HBA of Metro Denver.
Vail Resorts to narrow focus of lodging division
Vail Resorts Inc. on Wednesday announced a “strategic shift” for its lodging division, saying it plans to focus on adding properties at its ski resorts and Grand Teton National Park rather than elsewhere, and anticipates staff cuts in the division.
Ethics Watch files complaint against public trustee association over contributions
An ethics watchdog group filed a complaint today charging the Pubic Trustees Association of Colorado with wrongly accepting contributions from companies and individuals they did business with, then using the funds to pay convention expenses at a Black Hawk casino.
MIG Real Estate Acquires Denver Rosemont Ridge Multi-Family Community for $29.7 Million
NEWPORT BEACH, Calif. & DENVER, Nov 29, 2011 (BUSINESS WIRE) -- MIG Real Estate, LLC, a Newport Beach, Calif.-based real estate investment company, has acquired Rosemont Ridge at Lowry, an amenity-rich multi-family housing community in Denver, Colorado. The 240-unit community includes 242,562 square feet of rentable space and is located near the master-planned communities of Lowry and Stapleton in a highly desirable, infill area of Denver. The transaction reflects MIG's investment strategy, which focuses on real estate opportunities in the western states with upside potential.
Housing Recovery Hinges on Household-Formation Gain, Case Says
Nov. 29 (Bloomberg) -- U.S. home prices won’t recover until the economy improves enough to boost the number of households and clear an oversupply of properties, said economist Karl Case, co-founder of the S&P;/Case-Shiller home price index.
“Normally, the way we’ve cleared the market is we’ve had more household formation,” Case, a retired Wellesley College professor, said in an interview today with Tom Keene and Ken Prewitt on Bloomberg Radio’s “Surveillance.” Lackluster economic growth has encouraged people to move in with friends or family, meaning “demand is not going anywhere,” he said.
Tuesday, November 29, 2011
Corelogic: 20 percent of Colorado homes underwater
Colorado is tenth in the nation for the percentage of its mortgages that were underwater during the third quarter. According to a report released today by CoreLogic,20 percent of homes with mortgages in Colorado had a "negative equity share."
Of the 1.15 million mortgages outstanding in Colorado, 234,200 of them were underwater, while an additional 88,600, or 7.7 percent of them, were "near" underwater.
Nationwide, 22 percent of loans were underwater during the third quarter and an additional 5 percent were nearly so.
The only states with higher percentages of combined negative equity and near negative equity are Nevada, Arizona, Florida, Michigan, Georgia, California, Virginia, Ohio and Maryland. This makes Colorado 10th in the nation, although Idaho, Illinois and Utah all have rates very similar to Colorado.
According to the report:
Comparisons with the third quarter of 2010:
During the third quarter of 2010, 19.6 of Colorado's mortgages were underwater and an additional 8.1 percent were "near" underwater.
Out of a total of 1.12 million mortgages, 221,000 mortgages were underwater, and an additional 91,000 were "near" underwater.
Of the 1.15 million mortgages outstanding in Colorado, 234,200 of them were underwater, while an additional 88,600, or 7.7 percent of them, were "near" underwater.
Nationwide, 22 percent of loans were underwater during the third quarter and an additional 5 percent were nearly so.
The only states with higher percentages of combined negative equity and near negative equity are Nevada, Arizona, Florida, Michigan, Georgia, California, Virginia, Ohio and Maryland. This makes Colorado 10th in the nation, although Idaho, Illinois and Utah all have rates very similar to Colorado.
According to the report:
Nevada has the highest negative equity percentage with 58 percent of all of its mortgaged properties underwater, followed by Arizona (47 percent), Florida (44 percent), Michigan (35 percent) and Georgia (30 percent). This is the first quarter that Georgia entered the top five, surpassing California which had been in the top five since tracking began in 2009.
The top five states combined have an average negative equity ratio of 41.4 percent, while the remaining states have a combined average negative equity ratio of 17.6 percent.
Comparisons with the third quarter of 2010:
During the third quarter of 2010, 19.6 of Colorado's mortgages were underwater and an additional 8.1 percent were "near" underwater.
Out of a total of 1.12 million mortgages, 221,000 mortgages were underwater, and an additional 91,000 were "near" underwater.
Corelogic: 20 percent of Colorado homes underwater
Colorado is tenth in the nation for the percentage of its mortgages that were underwater during the third quarter. According to a report released today by CoreLogic,20 percent of homes with mortgages in Colorado had a "negative equity share."
Of the 1.15 million mortgages outstanding in Colorado, 234,200 of them were underwater, while an additional 88,600, or 7.7 percent of them, were "near" underwater.
Nationwide, 22 percent of loans were underwater during the third quarter and an additional 5 percent were nearly so.
The only states with higher percentages of combined negative equity and near negative equity are Nevada, Arizona, Florida, Michigan, Georgia, California, Virginia, Ohio and Maryland. This makes Colorado 10th in the nation, although Idaho, Illinois and Utah all have rates very similar to Colorado.
According to the report:
Comparisons with the third quarter of 2010:
During the third quarter of 2010, 19.6 of Colorado's mortgages were underwater and an additional 8.1 percent were "near" underwater.
Of the 1.15 million mortgages outstanding in Colorado, 234,200 of them were underwater, while an additional 88,600, or 7.7 percent of them, were "near" underwater.
Nationwide, 22 percent of loans were underwater during the third quarter and an additional 5 percent were nearly so.
The only states with higher percentages of combined negative equity and near negative equity are Nevada, Arizona, Florida, Michigan, Georgia, California, Virginia, Ohio and Maryland. This makes Colorado 10th in the nation, although Idaho, Illinois and Utah all have rates very similar to Colorado.
According to the report:
Nevada has the highest negative equity percentage with 58 percent of all of its mortgaged properties underwater, followed by Arizona (47 percent), Florida (44 percent), Michigan (35 percent) and Georgia (30 percent). This is the first quarter that Georgia entered the top five, surpassing California which had been in the top five since tracking began in 2009.
The top five states combined have an average negative equity ratio of 41.4 percent, while the remaining states have a combined average negative equity ratio of 17.6 percent.
Comparisons with the third quarter of 2010:
During the third quarter of 2010, 19.6 of Colorado's mortgages were underwater and an additional 8.1 percent were "near" underwater.
October permits: multifamily permits up 113 percent in 2011
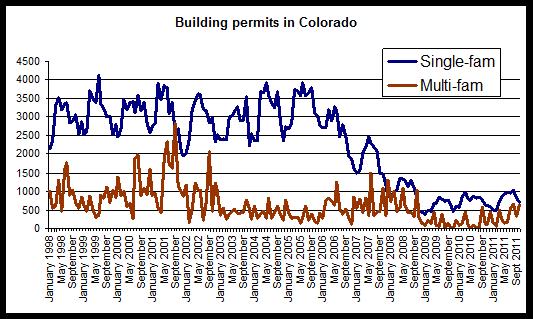
During the first ten months of 2011 in Colorado, building permits issued for multifamily construction are up 113 percent, year over year, while permits issued for single-family construction are up 1.5 percent for the same period.
This year, through October, there have been 3,335 multifamily permits issued in Colorado, and 7,963 single-family permits issued. For the same period during 2010, there were 1,559 multi-family permits issued, and 7,844 single-family permits.
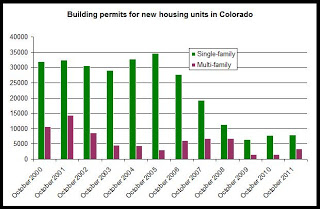
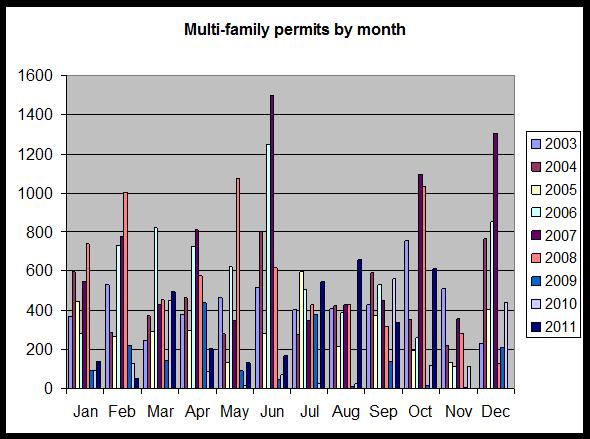
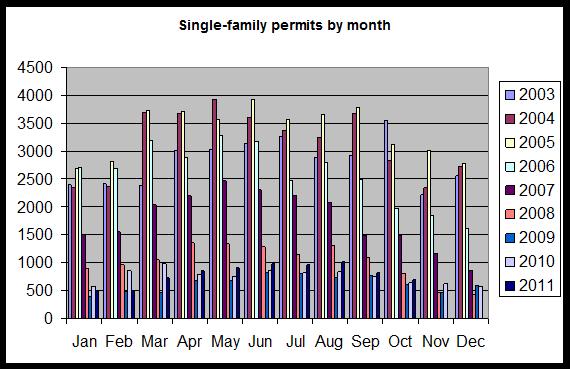
For the month of October alone, single-family permits are up, year-over-year, by 9.1 percent, and multi-family permits are up by 433 percent. There were 695 single-family permits and 614 multi-family permits issued during October 2011. There were 637 single-family permits and 115 multi-family permits issued during October 2010.
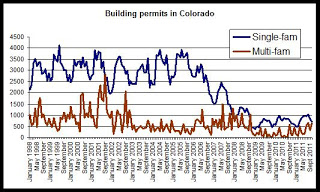
The second graph shows that overall, both multi-family and single-family permits in October were at levels below what were typical over the past decade, but that both are increasing.
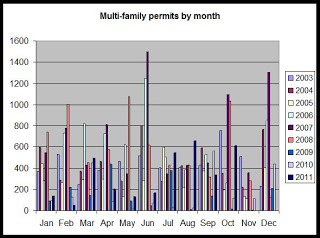
During October, the number of new multi-family permits issued was up significantly from October 2011, and was the fourth-highest September total for multi-family permits in ten years. 2011 overall has shown some significant growth in multi-family activity.
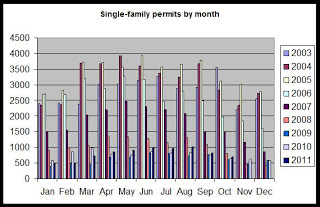
Growth in single-family permit activity suggests there is some hope among single-family homebuilders, but that demand is restrained. October's permit total for single-family units was at a 3-year high, although it remains well below typical September totals reported over the past decade.
Conclusions: This data further reinforces the notion that interest in new multifamily construction continues to increase at a much faster rate than interest in single-family construction.
This year, through October, there have been 3,335 multifamily permits issued in Colorado, and 7,963 single-family permits issued. For the same period during 2010, there were 1,559 multi-family permits issued, and 7,844 single-family permits.

For the month of October alone, single-family permits are up, year-over-year, by 9.1 percent, and multi-family permits are up by 433 percent. There were 695 single-family permits and 614 multi-family permits issued during October 2011. There were 637 single-family permits and 115 multi-family permits issued during October 2010.
The second graph shows that overall, both multi-family and single-family permits in October were at levels below what were typical over the past decade, but that both are increasing.
During October, the number of new multi-family permits issued was up significantly from October 2011, and was the fourth-highest September total for multi-family permits in ten years. 2011 overall has shown some significant growth in multi-family activity.
Growth in single-family permit activity suggests there is some hope among single-family homebuilders, but that demand is restrained. October's permit total for single-family units was at a 3-year high, although it remains well below typical September totals reported over the past decade.
Conclusions: This data further reinforces the notion that interest in new multifamily construction continues to increase at a much faster rate than interest in single-family construction.
Housing News Digest, November 29
Demand For Denver Apartments Outstrips Supply
The housing crisis has stalled home building but apartment construction is undergoing a bit of a renaissance. There's now a huge pool of people forced to rent because they can't afford to buy a home, or they were a victim of foreclosure. In Denver, there aren't enough apartment vacancies.
Imagine! plans group home in Broomfield
The U.S. Department of Housing and Urban Development earlier this month named Imagine! in Lafayette as one of two Colorado recipients of federal assistance to construct affordable housing for persons with disabilities.
Imagine! plans to use the funds to construct a six-bedroom group home for low-income, developmentally disabled persons near Broomfield's eastern border. The facility also will include a room for a resident manager. The group home will feature Enterprise Green Communities construction standards.
'Every Day Is Black Friday' In Housing As Prices Tank, Case-Shiller Shows
Housing markets remain deeply depressed, as the latest S&P;/Case-Shiller Home Price Indices show. September data, released Tuesday, show that prices continue to drift lower, with three cities posting new index lows, as real estate markets remain unable to shrug off a massive inventory of foreclosed homes and a weak economy.
Global squatter economy second-largest economy in world
In his first book, Shadow Cities: A Billion Squatters, a New Urban World, published in 2005, he wrote about "people who came to the city, needed a place to live that they and their families could afford, and, not being able to find it on the private market, built it for themselves on land that wasn't theirs." In almost all cases the land in question belonged to the local state. Back in the 1980s, when squatters first arrived on the then-empty piece of hillside land in Rio de Janeiro now known as Rocinha, for example, they "assumed that building a stone or brick home would be so brazen that it might encourage the government to come out and demolish the homes." So they built "rickety mud and wood houses," where they "survived with no water, no electricity, no gas, no toilets, nothing."
Things have changed there in the past couple of decades. "Today," Neuwirth wrote in 2005,
there are thirty thousand homes in Rocinha.… Most are two, three, or four stories tall, made from reinforced concrete and brick. Many boast shiny tile facades or fantastic Moorish balustrades or spacious balconies, which look out over the endless waves crashing on the beach at São Conrado, far down the hill. Electricity and water have come to this illegal city, and with them a degree of consumerism. Most families have a refrigerator, a color television … and a stereo.
Case-Shiller index in Denver falls for 15th month in a row
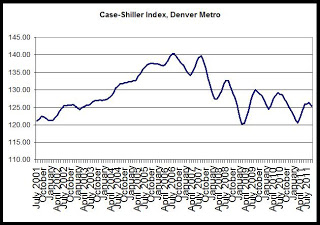
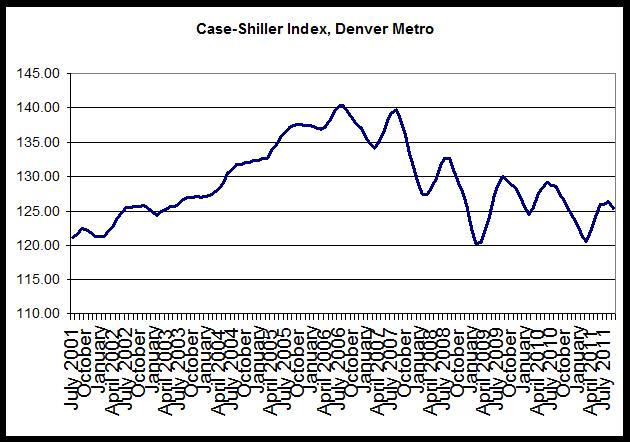
Case-Shiller released its home price index for September today. The home price index for the Denver area fell 0.8 percent from August to September, and fell 1.5 percent,year over year, from September 2010 to September 2011. Prices fell in September due at least partially to seasonal factors, although the overall index for the year remains below the index values seen during 2010. As can be seen in the first graph below, home prices are not likely to match even the levels seen at seasonal peaks during 2009 and 2010.
According to S&P;'s press release, home prices are still facing headwinds:
In year-over-year comparisons for September, Minneapolis again showed the largest drop, with a decline of 7.4 percent, while the index in Las Vegas fell 7.3 percent. Year over year, home price indices fell in 18 of the 20 cities included in the study. Only Washington, DC and Detroit showed increases.
The second chart shows trends in the Case-Shiller index for the Denver area and for the 20-city composite index. It is clear that Denver did not experience the kind of price bubble that occurred in many other metropolitan areas, and consequently, the index has not fallen nearly as far in Denver compared to the larger composite. Prices have been largely flat since mid-2009.
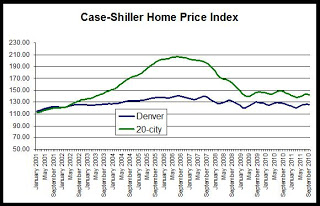
The 20-city composite is down 31.3 percent since it peaked in July 2006, but the Denver index is down only 10.5 percent from its August 2006 peak.
Nevertheless, the Denver index during August was at the lowest September value seen since 2003.
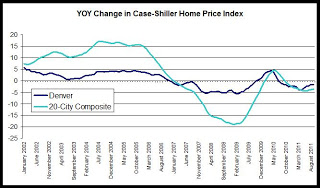
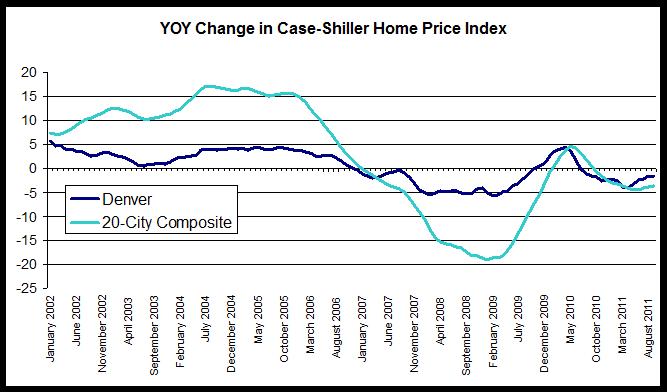
The third chart compares year-over-year changes in the Denver area index and in the 20-city composite. The Denver index did not achieve the rates of growth experienced by the national index, but the Denver index did not experience comparable rates of decline following the onset of the national recession either. Overall, the index has been less volatile in Denver than has been the case for the 20-city composite. However, year-over-year growth in the 20-city composite during September was negative with a decrease of 3.6 percent, and the Denver area index’s fall of 1.5 percent is the 15th month in a row in which the growth rate has been negative. In the 20-city index, the year-over-year change has been negative for the most recent 12 months.
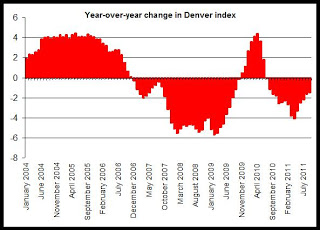
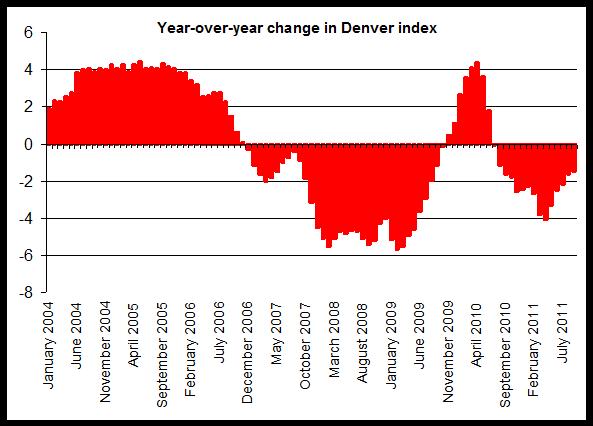
The last chart provides a closer look at year-over-year changes in the Denver index. Note the the change has been below zero since June 2010, and likely reflects the end of the homebuyer tax credit’s end which has led to a fall in demand and a decline in the home price index. The upward trend in the index in response to the tax credit is clear during late 2009 and early 2010. Since the end of the credit, however, home prices have consistently drifted downward.
According to S&P;'s press release, home prices are still facing headwinds:
“Home prices drifted lower in September and the third quarter,” says David M. Blitzer, Chairman of the Index Committee at S&P; Indices. “The National Index was down 3.9% versus the third quarter of 2010 and up only 0.1% from the previous quarter. Three cities posted new index lows in September 2011 - Atlanta, Las Vegas and Phoenix. Seventeen of the 20 cities and both Composites were down for the month. Over the last year home prices in most cities drifted lower. The plunging collapse of prices seen in 2007-2009 seems to be behind us. Any chance for a sustained recovery will probably need a stronger economy."
In year-over-year comparisons for September, Minneapolis again showed the largest drop, with a decline of 7.4 percent, while the index in Las Vegas fell 7.3 percent. Year over year, home price indices fell in 18 of the 20 cities included in the study. Only Washington, DC and Detroit showed increases.
The second chart shows trends in the Case-Shiller index for the Denver area and for the 20-city composite index. It is clear that Denver did not experience the kind of price bubble that occurred in many other metropolitan areas, and consequently, the index has not fallen nearly as far in Denver compared to the larger composite. Prices have been largely flat since mid-2009.
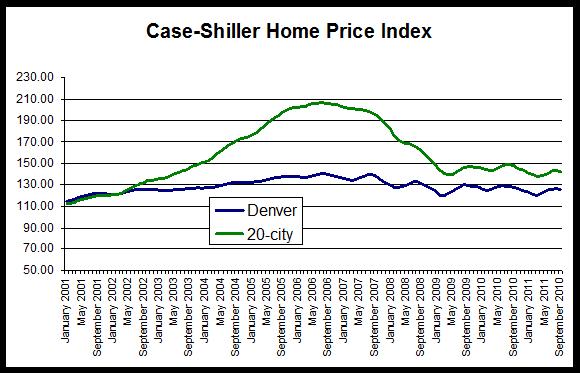
The 20-city composite is down 31.3 percent since it peaked in July 2006, but the Denver index is down only 10.5 percent from its August 2006 peak.
Nevertheless, the Denver index during August was at the lowest September value seen since 2003.
The third chart compares year-over-year changes in the Denver area index and in the 20-city composite. The Denver index did not achieve the rates of growth experienced by the national index, but the Denver index did not experience comparable rates of decline following the onset of the national recession either. Overall, the index has been less volatile in Denver than has been the case for the 20-city composite. However, year-over-year growth in the 20-city composite during September was negative with a decrease of 3.6 percent, and the Denver area index’s fall of 1.5 percent is the 15th month in a row in which the growth rate has been negative. In the 20-city index, the year-over-year change has been negative for the most recent 12 months.
The last chart provides a closer look at year-over-year changes in the Denver index. Note the the change has been below zero since June 2010, and likely reflects the end of the homebuyer tax credit’s end which has led to a fall in demand and a decline in the home price index. The upward trend in the index in response to the tax credit is clear during late 2009 and early 2010. Since the end of the credit, however, home prices have consistently drifted downward.
Monday, November 28, 2011
First-time unemployment claims down 26 percent during 2011 in Colorado
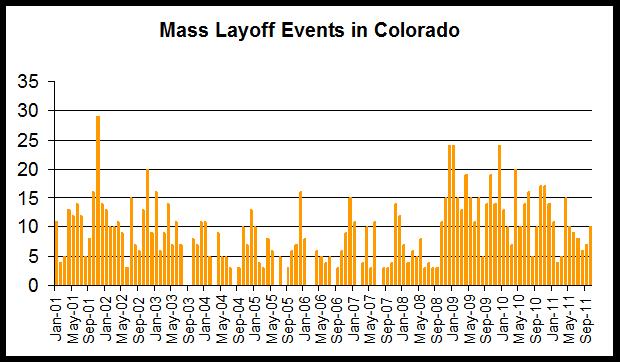
Mass layoff events fell 30 percent to 85 events during the first ten months of 2011 in Colorado. There were 122 mass layoff events during the same period last year. According to a new report released last week by the U.S. Bureau of Labor Statistics, there were 10 mass layoff events during October 2011, which is down 41 percent from the 17 events reported during October of last year.
Monthly mass layoff events grew rapidly after October 2008 in Colorado, and have gradually lessened since early 2010.

Nationally, mass layoff events decreased 33 percent from 1,642 during October 2010 to 1,101 during October of this year.
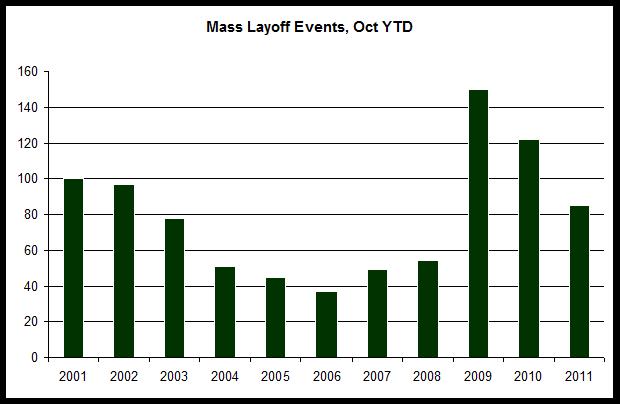
In the year-to-date Colorado total for October, mass layoffs have now fallen two years in a row after peaking at 150 mass layoffs during the first ten months of 2009. The second graph shows year-to-date totals for October since 2001:
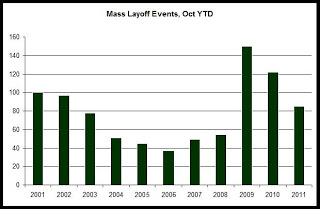
Mass layoffs were rare from 2004 through most of 2008.
Overall, the most recent mass layoffs data suggests that the employment situation continues to stabilize. New layoffs continue to lessen, and as we've seen in the most recent employment data, October 2011 showed the strongest year-over-year growth in employment in 53 months.
New claims for unemployment insurance
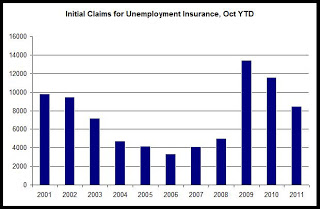
New claims for unemployment insurance in Colorado fell year over year by 48 percent to 873 in October 2011. There were 1675 new claims during September of last year. New claims for unemployment insurance have also gradually fallen since early 2010. Nationally, new claims fell 34 percent during the same period.
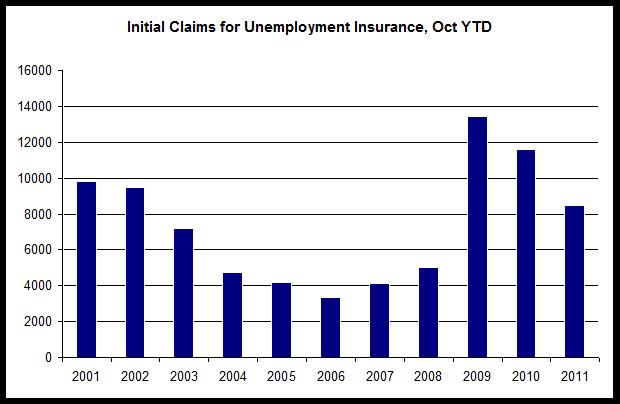
In year-to-date totals for new unemployment claims in Colorado through September, totals are down 26 percent year over year. There were 8,499 new claims during the first ten months of 2011, compared to 11,572 new claims during the same period last year. In the year-to-date total for October, new claims for unemployment insurance have now fallen two years in a row after peaking at 13,419 claims during the first ten months of 2009. The last graph shows year-to-date totals for October since 2001:
See the employment data archive for more on October's job creation.
The Mass Layoff Statistics (MLS) program collects reports on mass layoff actions that result in workers being separated from their jobs. Monthly mass layoff numbers are from establishments which have at least 50 initial claims for unemployment insurance (UI) filed against them during a 5-week period. Extended mass layoff numbers (issued quarterly) are from a subset of such establishments—where private sector nonfarm employers indicate that 50 or more workers were separated from their jobs for at least 31 days.
Monthly mass layoff events grew rapidly after October 2008 in Colorado, and have gradually lessened since early 2010.
Nationally, mass layoff events decreased 33 percent from 1,642 during October 2010 to 1,101 during October of this year.
In the year-to-date Colorado total for October, mass layoffs have now fallen two years in a row after peaking at 150 mass layoffs during the first ten months of 2009. The second graph shows year-to-date totals for October since 2001:
Mass layoffs were rare from 2004 through most of 2008.
Overall, the most recent mass layoffs data suggests that the employment situation continues to stabilize. New layoffs continue to lessen, and as we've seen in the most recent employment data, October 2011 showed the strongest year-over-year growth in employment in 53 months.
New claims for unemployment insurance
New claims for unemployment insurance in Colorado fell year over year by 48 percent to 873 in October 2011. There were 1675 new claims during September of last year. New claims for unemployment insurance have also gradually fallen since early 2010. Nationally, new claims fell 34 percent during the same period.
In year-to-date totals for new unemployment claims in Colorado through September, totals are down 26 percent year over year. There were 8,499 new claims during the first ten months of 2011, compared to 11,572 new claims during the same period last year. In the year-to-date total for October, new claims for unemployment insurance have now fallen two years in a row after peaking at 13,419 claims during the first ten months of 2009. The last graph shows year-to-date totals for October since 2001:
See the employment data archive for more on October's job creation.
The Mass Layoff Statistics (MLS) program collects reports on mass layoff actions that result in workers being separated from their jobs. Monthly mass layoff numbers are from establishments which have at least 50 initial claims for unemployment insurance (UI) filed against them during a 5-week period. Extended mass layoff numbers (issued quarterly) are from a subset of such establishments—where private sector nonfarm employers indicate that 50 or more workers were separated from their jobs for at least 31 days.
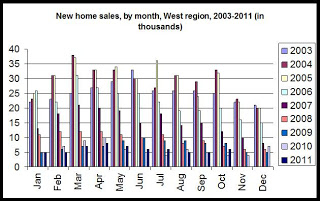
October new home sales up 50 percent in West
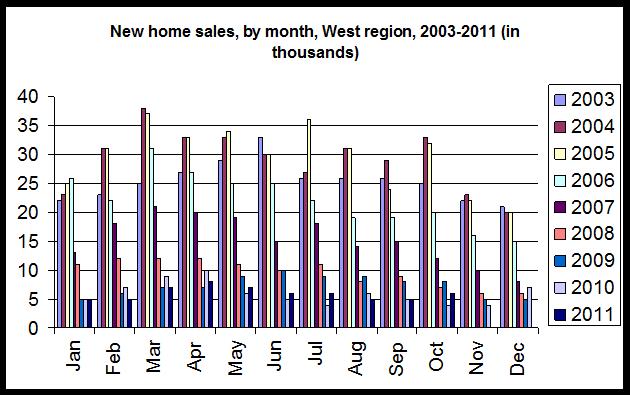
In October of this year, new single-family home sales rose slightly in the US, and rose in the West region, which includes Colorado. However, according to new data released by the Census Bureau today, new home sales in October were at the second-lowest October total recorded in at least ten years.
The report, which monitors sales activity for newly constructed houses, reported that in the West, new home sales were up year over year, increasing 50 percent to 6,000 in October 2011 from 4,000 new homes sold in October 2010. October of last year showed the lowest monthly total for new home sales during the past ten years. Nationwide, sales rose 8.6 percent, increasing from 23,000 to 25,000 during the same period.
In the West, no month has shown fewer than 4,000 new home sales for the region during the past decade, and October 2011's total of 6,000 new home sales, while at a three-month high, remains the second-lowest total for October reported over the past decade.
For the West region:
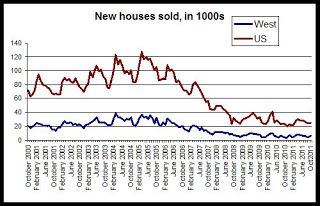
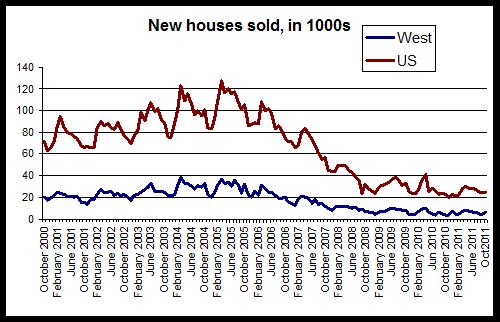
The second graph shows that new home sales continue to fall and have generally followed a downward trend since the middle of the decade.
New home sales peaked during the spring and summer of 2005 and have trended downward since. The number of new houses sold in the United States is down 80 percent since the peak of March 2005, and new home sales in the West have fallen 84 percent since sales peaked in the region during March 2004.
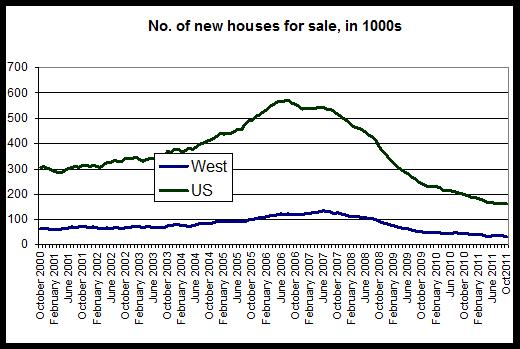
The third graph shows the declines in both US and regional totals in new homes for sale.
The number of new homes for sale has also fallen off considerably. The number of new houses for sale in the West has fallen 75 percent since the total peaked during June 2007, and the same total has fallen 71 percent in the US since the number of new homes for sale peaked in the US during August 2006.
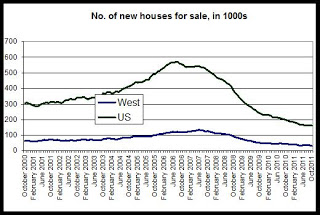
At 33,000, the number of new single-family homes for sale in the West is tied at the lowest level it's been in more than ten years. This reflects very low demand in the face of an ongoing and large number of new foreclosures and low-priced properties in many areas of the West, including Colorado. Although foreclosures have fallen in Colorado in recent years, foreclosure rates remain near historic highs. The national total of new homes for sale is at a ten-year low of 162,000.
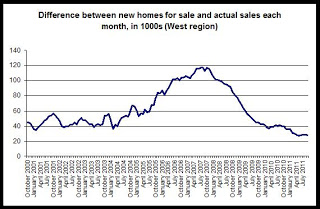
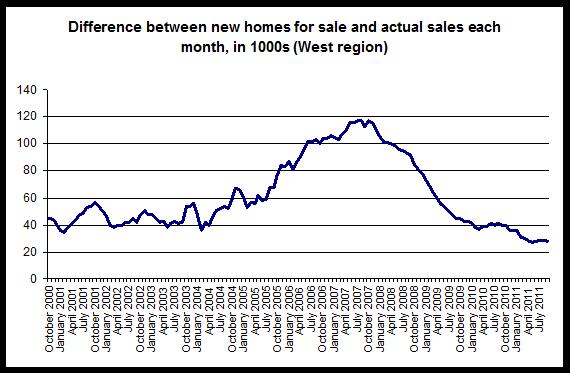
As a final note, we can also look to the new home inventory. In this case, we calculate inventory by subtracting the number of new home sales in a given month from the number of new homes for sale at the end of the previous month. In the final graph, we see that the inventory is now at a ten-year low for October with 28,000 homes. This is good news for owners of existing homes seeking to sell homes since it suggests that fewer new homes are sitting and waiting to be sold, thus diminishing some of the inventory-driven downward pressure on prices.
The report, which monitors sales activity for newly constructed houses, reported that in the West, new home sales were up year over year, increasing 50 percent to 6,000 in October 2011 from 4,000 new homes sold in October 2010. October of last year showed the lowest monthly total for new home sales during the past ten years. Nationwide, sales rose 8.6 percent, increasing from 23,000 to 25,000 during the same period.
In the West, no month has shown fewer than 4,000 new home sales for the region during the past decade, and October 2011's total of 6,000 new home sales, while at a three-month high, remains the second-lowest total for October reported over the past decade.
For the West region:
The second graph shows that new home sales continue to fall and have generally followed a downward trend since the middle of the decade.
New home sales peaked during the spring and summer of 2005 and have trended downward since. The number of new houses sold in the United States is down 80 percent since the peak of March 2005, and new home sales in the West have fallen 84 percent since sales peaked in the region during March 2004.
The third graph shows the declines in both US and regional totals in new homes for sale.
The number of new homes for sale has also fallen off considerably. The number of new houses for sale in the West has fallen 75 percent since the total peaked during June 2007, and the same total has fallen 71 percent in the US since the number of new homes for sale peaked in the US during August 2006.
At 33,000, the number of new single-family homes for sale in the West is tied at the lowest level it's been in more than ten years. This reflects very low demand in the face of an ongoing and large number of new foreclosures and low-priced properties in many areas of the West, including Colorado. Although foreclosures have fallen in Colorado in recent years, foreclosure rates remain near historic highs. The national total of new homes for sale is at a ten-year low of 162,000.
As a final note, we can also look to the new home inventory. In this case, we calculate inventory by subtracting the number of new home sales in a given month from the number of new homes for sale at the end of the previous month. In the final graph, we see that the inventory is now at a ten-year low for October with 28,000 homes. This is good news for owners of existing homes seeking to sell homes since it suggests that fewer new homes are sitting and waiting to be sold, thus diminishing some of the inventory-driven downward pressure on prices.
Housing News Digest, November 28
Empty Stocking Fund to help neighbors
According to the Colorado Division of Housing, the average rent cost in Greeley rose 5.1 percent from August 2010 to August 2011 and in Loveland by 11.7 percent.
Vacancy rates remain tight, at less than 6.7 percent, throughout Northern Colorado.
The average rent in Fort Collins/Loveland is $882 a month, according to state statistics released in August.
“Even the smallest of emergencies or unexpected expense can put a person with disabilities and their families at risk of homelessness,” said Beth Danielson, executive director of Connections for Independent Living in Greeley. “The funds Connections receives from NCESF help to stabilize families so that they can continue to work toward their goals of independence and self-sufficiency.”
Denver engages in a street struggle as number of homeless sleeping downtown continues to rise
Some lawmakers and business owners are pushing for tougher laws; others are seeking increased shelter space and more funding for services. The concern is that the current solution won't stop the number of homeless from growing and that next summer on the mall will be worse than this year.
Some worry that what is meant to be a safety net for Denver's most at-risk residents has also become a magnet for a steady stream of outsiders looking for help or a handout.
Mortgage bankers: Colorado rates well on delinquent loans
Colorado had the eighth-lowest percentage of mortgage loans in foreclosure or 90 days delinquent in the third quarter, according to a survey by the Mortgage Bankers Association .
A total of 4.22 percent of mortgage loans in Colorado were either in foreclosure or 90 days delinquent in the third quarter, the Colorado Division of Housing reported Wednesday, citing the survey.
Union Station deal update
The Evaluation Panel for the Denver Union Station Historic Building competitive process on Tuesday night made a presentation to the Regional Transportation District Board of Directors that recommends the proposal offered by Union Station Alliance.
USA’s proposal features utilizing a portion of the inside of Denver Union Station as a hotel, supplemented with restaurants and retail establishments. The USA group’s plan is headed by Walter Isenberg, the chairman, president and co-founder of Denver-based Sage Hospitality and long-time historic preservationist Dana Crawford.
Money & the Law: Real estate brokerage rules are a little tricky
Although for most people the legal profession doesn’t leap to mind as a place to find inspiration in ethical matters, lawyers function under strict ethical rules, in particular when it comes to conflicts of interest. Lawyers don’t represent plaintiffs and defendants in the same lawsuit; husbands and wives in the same divorce; or buyers and sellers in the same transaction.
Other professions seem more casual about conflicts of interest. Historically, the profession that has struggled most with conflicts of interest has been real estate brokerage. In part, that’s because, a few years ago, a broker representing a buyer was considered to be a “subagent” of the broker representing the seller — the buyer’s agent was, legally, working for the seller.
Wednesday, November 23, 2011
Colorado 8th best in nation for foreclosures and delinquent loans
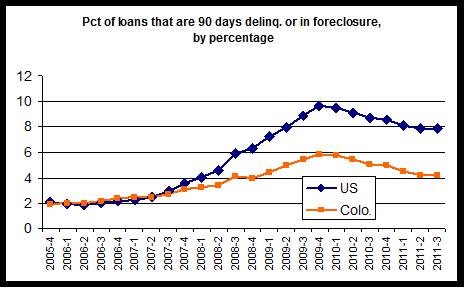
During the third quarter of 2011, only seven states reported lower percentages of mortgage loans that were were either in foreclosure or were 90 days delinquent. According to the third quarter's national delinquency survey, released last week by the Mortgage Bankers Association, the percentage of mortgage loans in Colorado that are either in foreclosure or are either 90-days delinquent, was 4.22 percent. Nationally, the rate was 7.89 percent. Only Nebraska, Virginia, Alaska, Montana, Wyoming and the Dakotas reported a delinquency/foreclosure rate that was lower than Colorado's.
The graph shows the the percentage of loans that are either in foreclosure or 90+ days delinquent in both the US and in Colorado over the past six years. The foreclosure/90-day delinquency measure has decreased in both the US and in Colorado for every quarter since the fourth quarter of 2009.
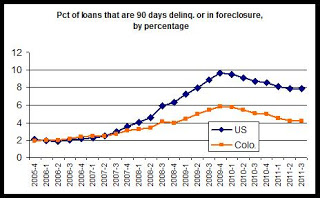
At the same time, Colorado has continued to compare more favorably to more and more states over time. This has been due to the number of states that have continued to report growth in delinquencies and foreclosures while Colorado's rate has declined.
More analysis to come after the long weekend.
The graph shows the the percentage of loans that are either in foreclosure or 90+ days delinquent in both the US and in Colorado over the past six years. The foreclosure/90-day delinquency measure has decreased in both the US and in Colorado for every quarter since the fourth quarter of 2009.
At the same time, Colorado has continued to compare more favorably to more and more states over time. This has been due to the number of states that have continued to report growth in delinquencies and foreclosures while Colorado's rate has declined.
More analysis to come after the long weekend.
Corelogic: Colorado home prices down 1.48 percent in September
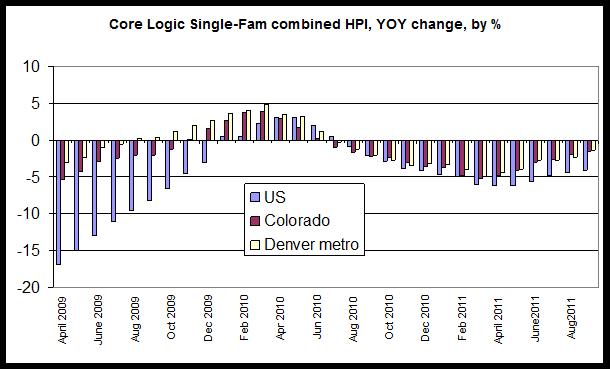
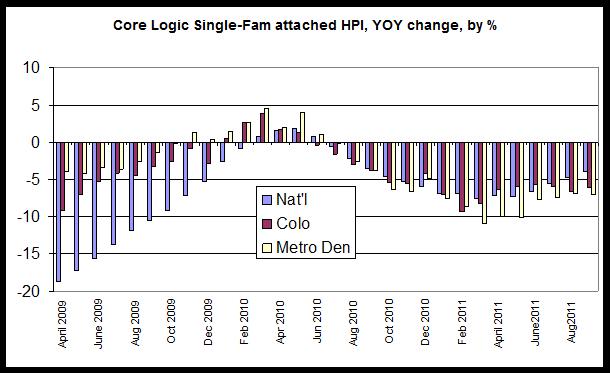
Home prices in Colorado fell 1.48 percent from September 2010 to September 2011, continuing a downward trend in home prices in Colorado and nationwide. Nevertheless, the degree to which homeprices have declined has lessed each month for the past five months. According to the September Home Price Index (HPI), released earlier this month by CoreLogic, The year-over-year decline for Colorado was the smallest decline in 13 months, and the drop for the Denver area was the smallest in 13 months. However, the trend in negative year-over-year changes continues and year-over-year changes have been negative for each month since July 2010.
Nationally, the index fell 4.1 percent, and it fell 1.3 percent in the Denver-Aurora-Broomfield metro area during the same period.
The graph shows the year-over-year changes for the past 29 months in the US, Colorado and the Denver metro area. Over the past two years, the general trend in all three areas has been shaped by the home buyer tax credit, which was introduced in 2008 and expired in April 2010. Clearly, home prices climbed throughout the duration of the tax credit period, but have declined since the credit's expiration.
During most months in the past two years, the Colorado and metro Denver HPI have performed better (from a property owner's perspective) than the national HPI. The national HPI has declined more than the local HPIs in each month since September 2010.
This data for September suggests that, although the year-over-year declines have lessened in magnitude, home prices have not yet turned around in Colorado as of September 2011. Local Realtor data, as well as the Case-Shiller data, all show that in year-over-yea comparisons, home prices continue to fall when compared to the same month in the prior year.
New pending home sales data from NAR suggests some new strength in home sales transactions at the regional level in some areas, but in Colorado statewide, home sales activity through September remains about equal with 2009.
See the home price data archive for more.
Corelogic also provides one of the few publicly-available indices that looks at home prices in attached homes such as condos and townhomes. Among attached homes, home prices have fallen significantly more than is the case for all single-family properties. Although the combined single-family Colorado index fell by 1.48 percent, year-over-year for September, the same index for attached housing fell by 6.12 percent. In the metro Denver area, the index for attached homes fell 7.05 percent. Notably, the national index in these types of properties shows a smaller decline than is the case in Colorado and Denver area.
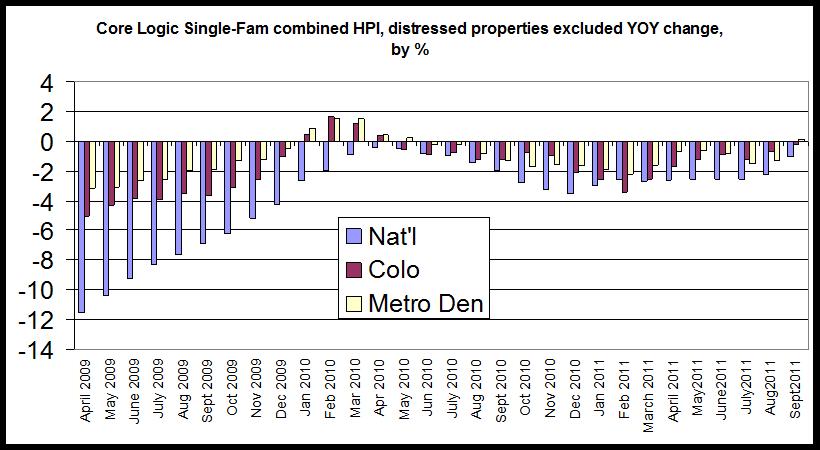
And finally, Corelogic provides a look at home prices with distressed properties excluded.
With distressed properties excluded, home prices were virtually flat from September 2010 to September 2011, with the Colorado index falling 0.19 percent year over year. During the same period, the national index fell 1.05 percent and the metro Denver index rose 0.1 percent.
So, we find that the declines in the home price indices are being driven in large part by the presence of distressed properties.
The CoreLogic HPI is a three-month weighted average of July, August and September (with September weighted the most) and is not seasonally adjusted.
HUD grant to aid development around three metro rail stops
The words "collaboration," "cooperation" and "working together" were on the lips of Colorado politicians and government officials who gathered in downtown Arvada on Tuesday to celebrate the award of a $4.5 million federal grant for transit-oriented development.
The money, awarded by the U.S. Department of Housing and Urban Development to the Denver Regional Council of Governments, will be used to plan and design urban centers near three rail stops on future FasTracks lines.
Small real estate firms in the valley making changes
EAGLE COUNTY, Colorado — The local real estate business has always been competitive. Sometimes, keeping up means looking for outside help.
A handful of local real estate companies have either sold, merged or expanded in the past few weeks. Those involved say there's a simple reason for the moves: resources.
Housing Prices Won't Recover Until 2013: Economists
U.S. home prices will stagnate through next year and only start recovering in 2013, according to economists polled by Reuters who also felt the stimulus options being floated will not do much to reinvigorate the market.
The housing market, considered by many as critical to any meaningful economic recovery, is still struggling to find its footing after collapsing by a third over the past several years, leaving many owing more than their homes are worth.
Federal Housing Administration Could be the Next Housing Bailout
First it was the big banks with their failed "credit-default swap" schemes and subprime mortgage meltdown. Then it was federally-backed mortgage giants Fannie Mae and Freddie Mac who sagged under the weight of risky home loans.
Now the government agency responsible for insuring more than $1 trillion in mortgages could be in financial trouble, with most of its cash reserves depleted and claims on defaulting mortgages mounting
Real estate trends: College town real estate
If your child is on his or her way to college, you're already thinking about the big checks you'll have to write. There's little you can do about tuition at a top college or university, but what about the "room and board" part of the equation?
One of the hottest real estate trends is college students who opt out of living in the dorms and instead are paying "room and board" to their parents in the form of a mortgage payment.
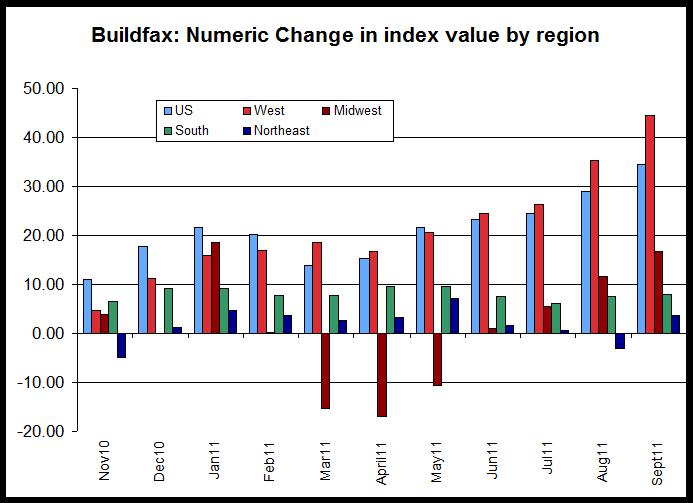
Remodeling in West region up 43 percent during September
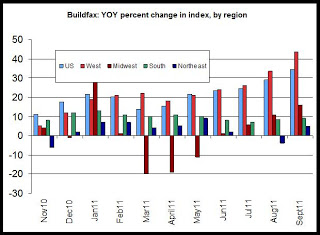
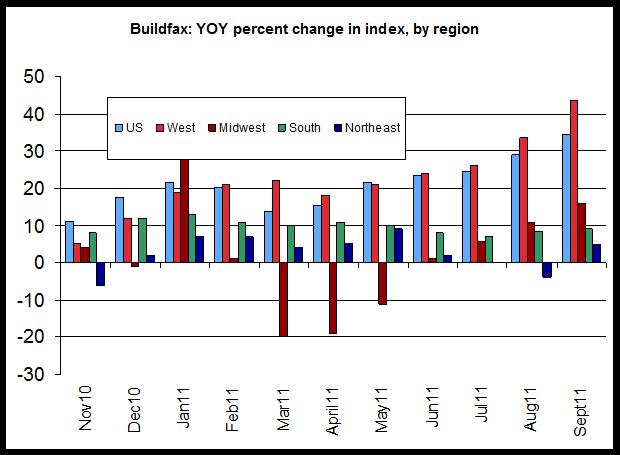
Residential remodeling activity increased 43.5 percent in the Western U.S. from September 2010 to September 2011. According to the September 2011 Residential Buildfax Remodeling Index, released this week by BUILDERadius, The Western U.S. showed the largest rate of increase in its index for September 2011, outpacing all other regions and the U.S. as a whole.
According to Buildfax's September 2011 release:
In September, all regions posted month-over-month gains for the first time since February 2011. The West was up 44.4 points (43.5%) year-over-year and up 6.4 points (4.6%) month-over-month. The Midwest was up 16.8 points (15.9%) year-over-year and up 6.4 points (4.9%) month-over-month. The Northeast was up 3.7 points (4.7%) year-over-year and 1.1 points (1.5%) month-over-month, and the South was up 8 points (9%) year-over-year and 2.9 points (2.9%) month-over-month.
In the graph, we see that the year-over-year percent change in the western region has outpaced all other regions and the U.S. as a whole for the past four months. Growth rates have been solid in recent months, and September's year-over-year percent change for both the West and the US were the largest in more than nine months.
Overall, the report suggests substantial increases in the amount of residential remodeling activity in the economy. Often, remodeling activity reflects an availability of household capital for some construction and home-improvement activities while there may be an absence of the large amounts of household capital necessary for relocation and new home purchases.
The Buildfax press release makes the plausible claim that the most growth in residential construction right now is found in multifamily construction and in remodeling.
As we've seen in recent data for new home sales and housing starts, new home construction remains at historic lows. Many homeowners turn to remodeling projects, as is reflected in recent Buildfax reports.
The exception is the Northeast region, which has shown only slight growth and some declines in recent months.
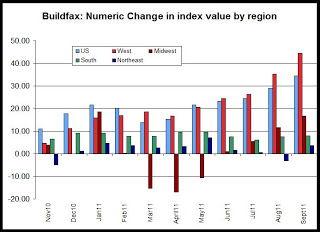
As a supplement, I've included the second graph which shows the year-over-year change in the numeric value of the index by region.
About the BuildFax Remodeling Index
The BuildFax Remodeling Index is based on construction permits filed with local building departments across the country. The index tracks the number of properties permitted. The national and regional indexes all have an initial value of 100 set in April of 2004, are based on a three-month moving average, and are not seasonally adjusted.
According to Buildfax's September 2011 release:
In September, all regions posted month-over-month gains for the first time since February 2011. The West was up 44.4 points (43.5%) year-over-year and up 6.4 points (4.6%) month-over-month. The Midwest was up 16.8 points (15.9%) year-over-year and up 6.4 points (4.9%) month-over-month. The Northeast was up 3.7 points (4.7%) year-over-year and 1.1 points (1.5%) month-over-month, and the South was up 8 points (9%) year-over-year and 2.9 points (2.9%) month-over-month.
In the graph, we see that the year-over-year percent change in the western region has outpaced all other regions and the U.S. as a whole for the past four months. Growth rates have been solid in recent months, and September's year-over-year percent change for both the West and the US were the largest in more than nine months.
Overall, the report suggests substantial increases in the amount of residential remodeling activity in the economy. Often, remodeling activity reflects an availability of household capital for some construction and home-improvement activities while there may be an absence of the large amounts of household capital necessary for relocation and new home purchases.
The Buildfax press release makes the plausible claim that the most growth in residential construction right now is found in multifamily construction and in remodeling.
As we've seen in recent data for new home sales and housing starts, new home construction remains at historic lows. Many homeowners turn to remodeling projects, as is reflected in recent Buildfax reports.
The exception is the Northeast region, which has shown only slight growth and some declines in recent months.
As a supplement, I've included the second graph which shows the year-over-year change in the numeric value of the index by region.
About the BuildFax Remodeling Index
The BuildFax Remodeling Index is based on construction permits filed with local building departments across the country. The index tracks the number of properties permitted. The national and regional indexes all have an initial value of 100 set in April of 2004, are based on a three-month moving average, and are not seasonally adjusted.
Housing starts in West region increase 152 percent
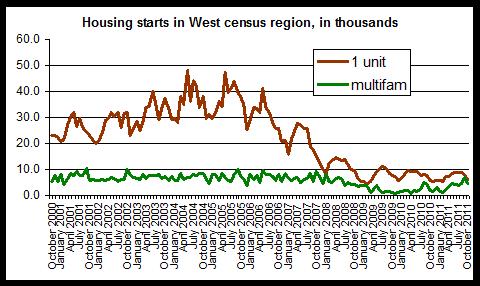
Multifamily housing starts in the West Census region of the US, which includes Colorado, rose 152 percent from October 2010, showing the highest October total in multifamily starts in four years. Single-family housing starts were up 3.4 percent from October 2010 to October 2011, while the combined total for both single-family and multifamily units were up 40.2 percent during the same period.
According to new housing construction and housing starts data released last week by the US Census Bureau, there were approximately 10,800 housing units started in the West during October 2011. Of the new units started, 6,000 were single-family structures and 4,800 were structures containing more than one housing unit.
Nationally, housing starts overall increased 18.9 percent during the same period, with total housing starts rising to a total of 54,000.
Total housing starts remain well below peak levels both nationally and in the West. October 2011 housing starts in the West were 80 percent below the peak reached during May 2004. Nationally, October 2011 was 72 percent below peak levels. The national peak in housing starts was reached during May 2005.
Multifamily starts have rebounded more than single-family starts. In the West, single-family starts are 87 percent below peak levels while multifamily starts are only 52 percent below peak levels.
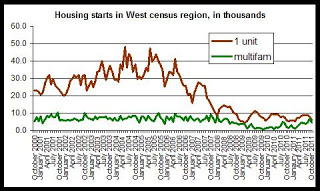
The West census region includes California, so given the size of the West census region, the fact that total housing starts are at 10,800 indicates that new home construction continues to be very light throughout the region. Housing starts totals ranging from 35,000 to 45,000 were common from 2004 to 2006. However, most of this decline was driven by drops in single-family activity, and not by large drops in multifamily activity.
The first graph shows the difference between single-family starts and starts for structures with more than one housing unit in the West region. Single-family starts rose 1.3 percent from October 2010 to October 2011. Starts for structures with more than one unit rose by 152 percent during the same period, rising from 1,900 units during October 2010, to 4,800 units during October of this year.
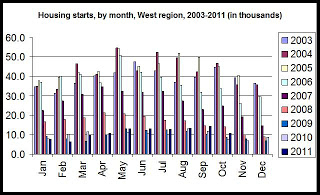
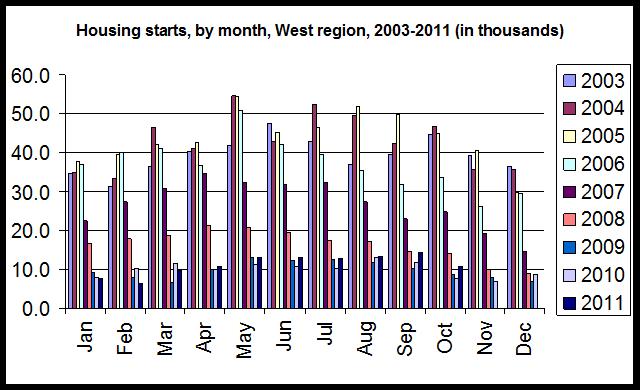
The second graph shows month-by-month comparisons in housing starts for each year in the West. October's housing-starts total decreased from September to October, reflecting a trend found since 2008. Prior to 2008, starts tended to increase from September to October. However, October 2011's total is now at a three-year high for October, but remains well below totals reported from 2003 to 2007.
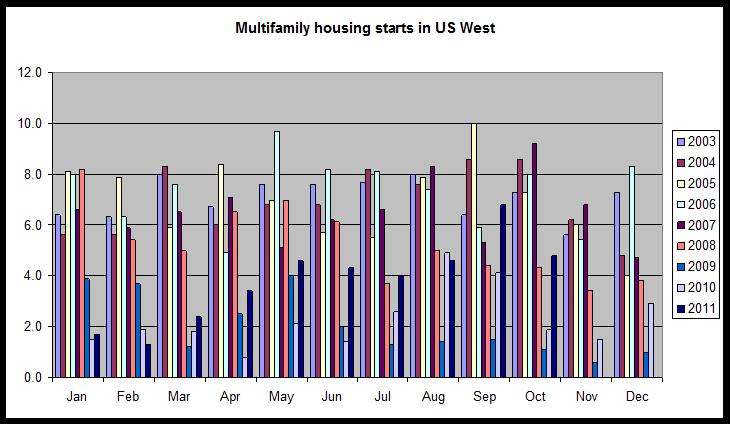
More sustained growth was visible in starts for structures with more than one housing unit. As can be seen in the third graph, October's total was significantly higher than October 2010, and is at a four-year high.
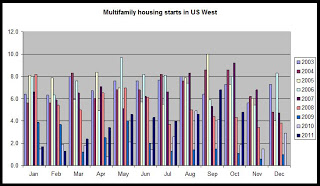
Starts for buildings with more than one unit were relatively numerous in October, showing a continued trend of growing activity in multifamily construction. Single-family starts showed signs of life as well, but were far more restrained than was the case in multifamily starts.
We can also note that the surge in multifamily starts is reinforced by recent increases in new multifamily permit data as well.
According to new housing construction and housing starts data released last week by the US Census Bureau, there were approximately 10,800 housing units started in the West during October 2011. Of the new units started, 6,000 were single-family structures and 4,800 were structures containing more than one housing unit.
Nationally, housing starts overall increased 18.9 percent during the same period, with total housing starts rising to a total of 54,000.
Total housing starts remain well below peak levels both nationally and in the West. October 2011 housing starts in the West were 80 percent below the peak reached during May 2004. Nationally, October 2011 was 72 percent below peak levels. The national peak in housing starts was reached during May 2005.
Multifamily starts have rebounded more than single-family starts. In the West, single-family starts are 87 percent below peak levels while multifamily starts are only 52 percent below peak levels.
The West census region includes California, so given the size of the West census region, the fact that total housing starts are at 10,800 indicates that new home construction continues to be very light throughout the region. Housing starts totals ranging from 35,000 to 45,000 were common from 2004 to 2006. However, most of this decline was driven by drops in single-family activity, and not by large drops in multifamily activity.
The first graph shows the difference between single-family starts and starts for structures with more than one housing unit in the West region. Single-family starts rose 1.3 percent from October 2010 to October 2011. Starts for structures with more than one unit rose by 152 percent during the same period, rising from 1,900 units during October 2010, to 4,800 units during October of this year.
The second graph shows month-by-month comparisons in housing starts for each year in the West. October's housing-starts total decreased from September to October, reflecting a trend found since 2008. Prior to 2008, starts tended to increase from September to October. However, October 2011's total is now at a three-year high for October, but remains well below totals reported from 2003 to 2007.
More sustained growth was visible in starts for structures with more than one housing unit. As can be seen in the third graph, October's total was significantly higher than October 2010, and is at a four-year high.
Starts for buildings with more than one unit were relatively numerous in October, showing a continued trend of growing activity in multifamily construction. Single-family starts showed signs of life as well, but were far more restrained than was the case in multifamily starts.
We can also note that the surge in multifamily starts is reinforced by recent increases in new multifamily permit data as well.
Colorado reports largest job gains in 53 months
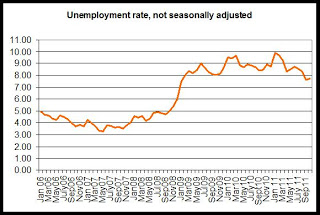
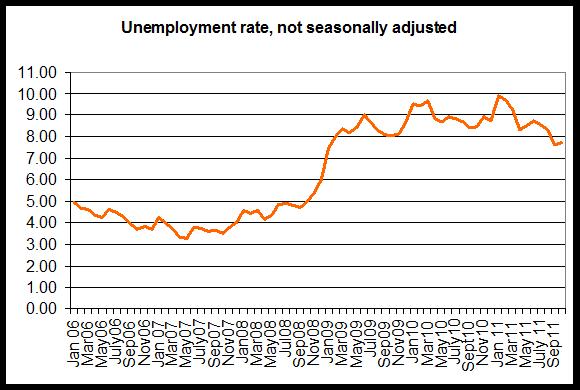
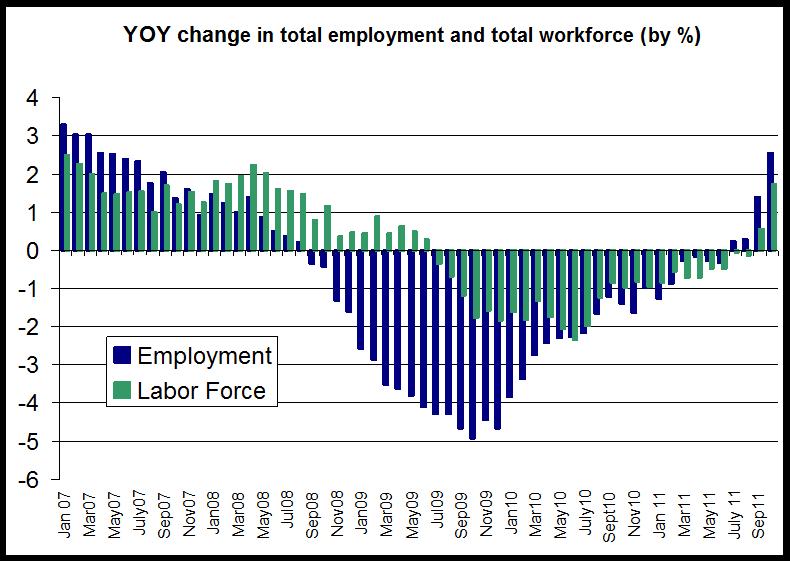
Colorado gained 62,499 jobs in October 2011 compared to October of last year, and the non-seasonally-adjusted unemployment rate fell year-over-year from 8.4 percent to 7.7 percent. According to the most recent employment data, released yesterday by the Colorado Department of Labor and Employment, total employment in October, not seasonally adjusted, rose to 2.517 million jobs. There were also 46,000 more people in the work force during October, compared to October 2010.
From October 2010 to October 2011, total employment rose 2.5 percent, while the labor force rose 1.7 percent. The total labor force in October included 2.72 million workers.
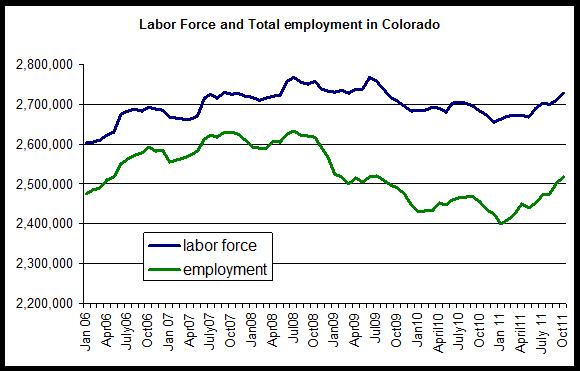
As can be seen in the second graph, total employment and total workforce size have increased month-over-month. Year over year, both total employment and the labor force rose together. However, both remain well below the July 2008 peak.
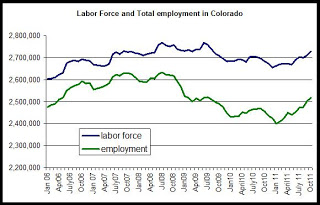
The employment total is now 114,000 jobs below the peak levels experienced during July 2008 when there were 2.63 million employed workers. Compared to the labor force peak in July 2008, the labor force is now down by more than 39,700 workers.
In the third graph is shown the year-over-year comparisons, by percent, for total employment. October 2011 was the fourth month in a row showing a positive year-over-year change in total employment. This followed 33 months in a row of negative job growth in year-over-year comparisons. At 2.5 percent, the year-over-year percent change in total employment was the largest gain since July 2007 and was at a 53-month high in October 2011. Between August 2008 and July 2011, no month posted a positive change in total employment when compared to the same month a year earlier.
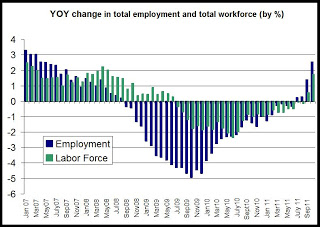
The graph also shows the year-over-change in the labor force. Total labor force size rose from October 2010 to October 2011, and was only the second time that the labor force has grown, year over year, since June 2009 . The labor force size had shrunk, year over year, for 26 months in a row from July 2009 to August 2011.
These numbers come from the Household Survey employment data, so the size of the workforce is dependent on the number of people stating that they are actively looking for work if not employed. Discouraged workers who have stopped looking for work are excluded.
From October 2010 to October 2011, total employment rose 2.5 percent, while the labor force rose 1.7 percent. The total labor force in October included 2.72 million workers.
As can be seen in the second graph, total employment and total workforce size have increased month-over-month. Year over year, both total employment and the labor force rose together. However, both remain well below the July 2008 peak.
The employment total is now 114,000 jobs below the peak levels experienced during July 2008 when there were 2.63 million employed workers. Compared to the labor force peak in July 2008, the labor force is now down by more than 39,700 workers.
In the third graph is shown the year-over-year comparisons, by percent, for total employment. October 2011 was the fourth month in a row showing a positive year-over-year change in total employment. This followed 33 months in a row of negative job growth in year-over-year comparisons. At 2.5 percent, the year-over-year percent change in total employment was the largest gain since July 2007 and was at a 53-month high in October 2011. Between August 2008 and July 2011, no month posted a positive change in total employment when compared to the same month a year earlier.
The graph also shows the year-over-change in the labor force. Total labor force size rose from October 2010 to October 2011, and was only the second time that the labor force has grown, year over year, since June 2009 . The labor force size had shrunk, year over year, for 26 months in a row from July 2009 to August 2011.
These numbers come from the Household Survey employment data, so the size of the workforce is dependent on the number of people stating that they are actively looking for work if not employed. Discouraged workers who have stopped looking for work are excluded.
Tuesday, November 22, 2011
Housing News Digest, November 22
Denver-area rental housing vacancy rate rises
“The small increase in vacancies reflects the fact that we’re continuing to see new inventory come onto the market,” Susan Melton, owner of Assured Management in Lakewood, said in a statement. “We’re still being approached by homeowners who can’t sell their homes, but don’t want to manage rentals themselves, and we also have established investor clients who are adding to the inventory of rental homes they already own.”
Summit County: FIRC offers new foreclosure counseling service
With Summit County ranked as having one of the top 10 foreclosure rates in the state by the Colorado Division of Housing, the Family & Intercultural Resource Center saw the need to offer a free foreclosure counseling service to locals.
“The Summit Combined Housing Authority found earlier this year that more deed-restricted homeowners than in the past were reporting being unemployed and struggling to keep up with their mortgages,” Rob Murphy, FIRC community support manager said. “In addition, market analysis reports from Land Title Guarantee Company show elevated levels of foreclosures in Summit County and over the last three years, FIRC had been seeing an increase in requests for help with past due mortgage payments.”
Mercy Housing Begins Construction on Bluff Lake Apartment Homes in Denver
DENVER, CO - November 21, 2011 - (RealEstateRama) — Award-winning KTGY Group, Inc., Architecture + Planning, is pleased to announce the construction of Bluff Lake Apartment Homes, a new high-quality, eco-friendly residential community for 92 families earning between 30 percent and 50 percent of the area median income. This $11.5 million affordable housing community is the result of extensive collaboration with leading national affordable housing developer Mercy Housing, the City of Denver, and architecture and planning firm KTGY Group in Denver. Bluff Lake Apartment Homes is slated to be completed by spring 2012.
River Edge subdivision gets preliminary nod
GLENWOOD SPRINGS, Colorado — The approvals are not formal or final yet, but for all intents and purposes the county has given the nod to an unincorporated community of 366 homes almost exactly halfway between here and Carbondale.
The Garfield Board of County Commissioners on Monday voted 2-1, Commissioner John Martin dissenting, to approve the River Edge Colorado planned unit development (PUD), which was proposed to be built over seven distinct phases lasting 20 years.
Denver rental vacancies edge higher in third quarter
The rate is up from 2.9% in the second quarter and 2.6% a year earlier.
Triplexes and fourplexes experienced the highest vacancy rate of 4% for three months ended Sept. 30. Meanwhile, the vacancy rate on detached houses hit 2.6%. Vacancies on rental townhomes and condominiums hit 3.3% and 3.8%, respectively.
Monday, November 21, 2011
Colorado data: extended mass layoffs and initial unemployment claims
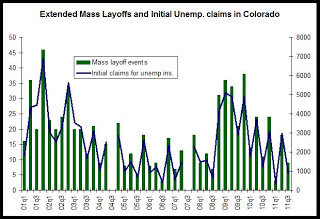
The Bureau of Labor Statistics released quarterly data on extended mass layoffs and initial unemployment claims for the third quarter of 2011.
"Extended mass layoffs" are a little different from the mass layoffs that are reported on monthly by the BLS. Specifically, an extended mass layoff is "defined by the filing of 50 or more initial claims for unemployment insurance benefits from an employer during a 5-week period, with at least 50 workers separated for more than 30 days. Such layoffs involve both persons subject to recall and those who are terminated."
This quarterly report focuses a little bit more on permanent and longer-term separations while the monthly statistics track all separations regardless of duration.
The report also tracks initial claims for unemployment insurance associated with the extended mass layoffs.
In Colorado, the trend in both mass layoffs and in initial claims continues downward. As can be seen in the first graph, totals for both claims and layoffs are returning to levels commonly reported during the inter-recession period from 2004 to 2007.
This trend largely mirrors the national trend which is also downward. According to the BLS press release:
In the second graph, we see the year-over-year changes in initial claims for both the US and Colorado. For the past seven quarters, the year-over-year change in new claims has been down-year-over-year. This mirrors the recovery period of 2003 and 2004. The declines follow a period of seven quarters of significant year-over-year increases in claims during 2008 and 2009.
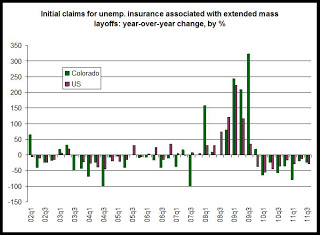
The ongoing declines in mass layoff events and claims suggest a slow and ongoing recovery in the job markets, although the volume in job creation has yet to prove sufficient to absorb new additions to the labor force.
"Extended mass layoffs" are a little different from the mass layoffs that are reported on monthly by the BLS. Specifically, an extended mass layoff is "defined by the filing of 50 or more initial claims for unemployment insurance benefits from an employer during a 5-week period, with at least 50 workers separated for more than 30 days. Such layoffs involve both persons subject to recall and those who are terminated."
This quarterly report focuses a little bit more on permanent and longer-term separations while the monthly statistics track all separations regardless of duration.
The report also tracks initial claims for unemployment insurance associated with the extended mass layoffs.
In Colorado, the trend in both mass layoffs and in initial claims continues downward. As can be seen in the first graph, totals for both claims and layoffs are returning to levels commonly reported during the inter-recession period from 2004 to 2007.

This trend largely mirrors the national trend which is also downward. According to the BLS press release:
Employers in the private nonfarm sector initiated 1,226 mass layoff events in the third quarter of 2011 that resulted in the separation of 184,493 workers from their jobs for at least 31 days, the U.S. Bureau of Labor Statistics reported today. Total extended mass layoff events decreased over the year from 1,370 to 1,226, and associated worker separations fell from 222,357 to 184,493. Events and separations reached their lowest third quarter levels since 2007. Both events and separations have decreased over the year for eight consecutive quarters. Third quarter 2011 layoff data are preliminary and are subject to revision.
Both events and separations in the manufacturing sector declined to series’ lows during the third quarter of 2011. Fifty percent of private nonfarm employers indicated they anticipated some type of recall, up from 45 percent a year earlier.
In the second graph, we see the year-over-year changes in initial claims for both the US and Colorado. For the past seven quarters, the year-over-year change in new claims has been down-year-over-year. This mirrors the recovery period of 2003 and 2004. The declines follow a period of seven quarters of significant year-over-year increases in claims during 2008 and 2009.
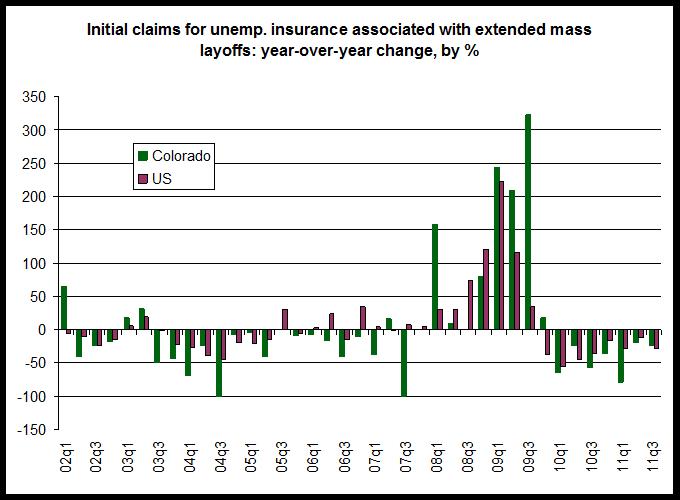
The ongoing declines in mass layoff events and claims suggest a slow and ongoing recovery in the job markets, although the volume in job creation has yet to prove sufficient to absorb new additions to the labor force.
Vacancies in rental houses rise as inventory grows
Click here for the full report.
Vacancies in for-rent condos, single-family homes, and other small properties across metro Denver rose slightly during the third quarter although the market remained tight with a rate of 3.4 percent. According to a report released Monday by the Colorado Division of Housing, the metro-wide vacancy rate during the third quarter of this year was up from 2010’s third-quarter rate of 2.9 percent, and the vacancy rate was also up from this year’s second-quarter rate of 2.6 percent.
The vacancy rate varied among different types of properties, although only triplexes and fourplexes reported vacancy rates above 4 percent. The vacancy rate in detached houses was 2.6 percent, and it was 3.3 percent in rental townhouses. Rental condominiums reported a vacancy rate of 3.8 percent.
At the county level, the lowest vacancy rates were found in Douglas County and in the Boulder/Broomfield area. The vacancy rate was 1.6 percent in Douglas County, and was 1.9 percent in Boulder/Broomfield.
The highest county-wide vacancy rate, found in Adams County, was 5.2 percent.
Vacancy rates for all counties surveyed were: Adams, 5.2 percent; Arapahoe, 3.1 percent; Boulder/Broomfield, 1.9 percent; Denver, 3.0 percent; Douglas, 1.6 percent; and Jefferson, 4.1 percent.
“The small increase in vacancies reflects the fact that we’re continuing to see new inventory come onto the market,” said Susan Melton, owner of Assured Management in Lakewood. “We’re still being approached by homeowners who can’t sell their homes, but don’t want to manage rentals themselves, and we also have established investor clients who are adding to the inventory of rental homes they already own. The net effect has been a slowly expanding inventory which can produce some new vacancies while also preventing rent levels from taking off the way they have in some apartment properties.”
The average rent in metro Denver for single-family and similar properties rose to $1,049 during 2011’s third quarter, rising 0.5 percent from 2010’s third-quarter average rent of $1,041. The third quarter’s average rent was down from this year’s second-quarter average rent of $1,063. Average rents are not adjusted for inflation.
“Year over year, these properties have experienced an increase in the average rent for 21 of the last 22 quarters,” said Ron Throupe, Assistant Professor of business at the University of Denver and the report’s author. “However, most of those annual increases over the past three years have ranged from two to three percent. So, generally speaking, the rent growth is there, but it’s been relatively mild.
Growth in the average rent was strongest in Jefferson County where the average rent grew 3.05 percent from 2010’s third quarter to the same period this year. The average rent fell the most in Adams County where it fell 2.5 percent, year over year.
Average rents for all counties were: Adams, $1,093; Arapahoe, $1,007; Boulder/Broomfield, $1,601; Denver, $973; Douglas, $1,399; and Jefferson, $1,011.
The average number of days on the market for single-family rentals and similar properties fell from 36.0 days during the third quarter of 2010 to 24.5 days during the third quarter of 2011. The number of days on the market rose from 2011’s second-quarter average of 15.7 days.
Friday, November 18, 2011
Workshop: Building Your Organization’s Sustainability
Building Your
Organization’s Sustainability
December 6, 2011
Co-Sponsored By:
Mile High United Way • Denver, CO
2505 18th Street • Founder’s Room
10:00 a.m. - 2:00 p.m.
In-depth workshop to help you build a more effective business model to increase your organization’s long-term sustainability.
What you will learn:
• Why its important to evaluate your organization and it’s lines of business, services and programs for short term and long term sustainability
• What factors you must consider when determining whether to grow, expand or cut back services or programs
• What you should include on a checklist of sustainable criteria to evaluate everything your organization undertakes
• How to recognize when its time to consolidate, conserve, change direction or wind down
• How to plan alternatives to ensure sustainability
See more here.
CPI growth in October rises to post-2008 high
Yesterday, the Bureau of Labor Statistics released the October CPI for US urban areas and regions. From October 2010 to October 2011, the CPI for all urban areas increased 3.5 percent. In the West region, the CPI increased 3.4 percent, not seasonally adjusted, which is the second-largest year-over-year October increase during the past ten years.
Nationally, the CPI increased 3.5 percent, year-over-year, and was driven by increases in food and transportion costs, according to the BLS release:
In the first graph, which shows CPI change in the West region, we can see that the CPI growth in October 2011 is now the second-highest increase observed for October during the past ten years. Only 2008 showed larger increases. Price increases in those years were partially countered by strong growth in employment and incomes, but income growth has been flat in recent years, as discussed here.
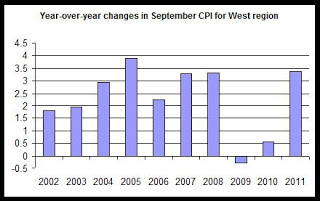
In the West region, as well as nationally, price increases are being largely driven by transportation costs, which increased by 8.4 percent, year over year. Food costs also increased significantly, rising 4.1 percent, while apparel rose 4.4 percent. Price increases in housing have begun to inch up with September's year-over-year increase at 1.6 percent. Housing costs to consumers continue to be muted as a result of declining prices in purchase housing. Prices will likely move upward slowly as rent increases in the face of increasing demand and little new construction.
Recent price increases will impact household calculations and attitudes on spending as many households conclude that discretionary spending will need to be scaled back in the face of increasing food and transportation costs. These price increases come in the face of continued lackluster performance in the labor markets.
The second graph shows year-over-year changes in CPI for all months since 2002. October's CPI showed the second-largest month-over-month increase reported since September 2008.
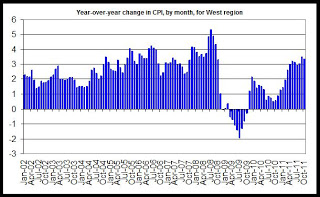
Nationally, the CPI increased 3.5 percent, year-over-year, and was driven by increases in food and transportion costs, according to the BLS release:
A decline in the energy index more than offset small increases in the
indexes for food and all items less food and energy to create the all
items decline. The energy index turned down in October after
increasing in each of the three previous months as the gasoline and
household energy indexes declined after a series of seasonally
adjusted increases. The food index rose in October, but posted its
smallest increase of the year as the fruits and vegetables index
declined sharply.
In the first graph, which shows CPI change in the West region, we can see that the CPI growth in October 2011 is now the second-highest increase observed for October during the past ten years. Only 2008 showed larger increases. Price increases in those years were partially countered by strong growth in employment and incomes, but income growth has been flat in recent years, as discussed here.
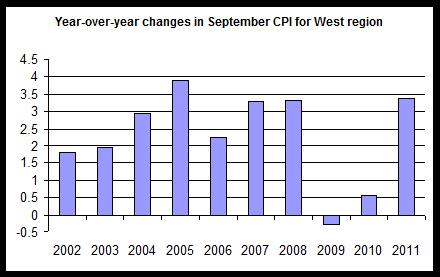
In the West region, as well as nationally, price increases are being largely driven by transportation costs, which increased by 8.4 percent, year over year. Food costs also increased significantly, rising 4.1 percent, while apparel rose 4.4 percent. Price increases in housing have begun to inch up with September's year-over-year increase at 1.6 percent. Housing costs to consumers continue to be muted as a result of declining prices in purchase housing. Prices will likely move upward slowly as rent increases in the face of increasing demand and little new construction.
Recent price increases will impact household calculations and attitudes on spending as many households conclude that discretionary spending will need to be scaled back in the face of increasing food and transportation costs. These price increases come in the face of continued lackluster performance in the labor markets.
The second graph shows year-over-year changes in CPI for all months since 2002. October's CPI showed the second-largest month-over-month increase reported since September 2008.
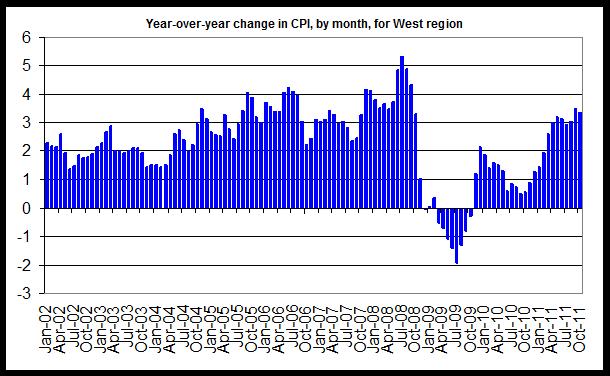
New author for vacancy and rent surveys
As is now noted at the web archive for the vacancy and rent surveys, the new principal author of the surveys is Ron L. Throupe, Ph.D. of the University of Denver. His profile can be found here.
Gordon Von Stroh will continue as a senior advisor on the reports.
Gordon Von Stroh will continue as a senior advisor on the reports.
Housing News Digest, November 18
Vacancy rates plummet in Northern Colorado
Fort Collins-Loveland might be falling victim to its own success.
A combination of the cities' relatively healthy job market, diverse economy and positive national press is putting the squeeze on available apartments.
The vacancy rates in September plummeted to critically low levels, meaning rents are going up and will continue to do so until more apartments are built.
Greeley, Fort Collins-Loveland among state's lowest apartment vacancy rates
The report said that, among the state's metro areas, Greeley had the largest vacancy rate drop at 1.8 percent. That compares to 3.9 percent in the same quarter in 2010.
The Fort Collins-Loveland vacancy rate was 2.3 percent for the third quarter.
Statewide, the vacancy rate for Colorado apartments fell to 5 percent in the third quarter of 2011, dropping to the lowest rate recorded since 2001.
Rental market tightens
In Pueblo, where the housing market remains in its deepest slump of the recession, the trends were mixed. Vacancy rates declined slightly to 7.3 percent while rents also dropped to an average of $541, the lowest among the city's larger cities.
Pueblo County rents vary by neighborhood. Average prices are the highest in the southwest quadrant ($585 to $700) and lower ($400 to $500) elsewhere.
Developer wants to build 315 apartments near police station
Loveland developer Mc-Whinney has submitted plans to the city of Fort Collins to build up to 315 apartments at the intersection of Drake and Timberline roads.
The proposal is winding its way through the Fort Collins development review process, said Mike Hill, senior vice president for multifamily development.
Property managers: Jobs drive low apartment vacancy rate
While Greeley’s apartment vacancy rate hit its lowest level in more than a decade in the third quarter of this year, it’s unclear what the tight renta...
Grand Junction vacancy rate at 7.7 percent this summer
After decreasing or remaining flat quarter-to-quarter for a year-and-a-half, Grand Junction’s rental vacancy rate increased to 7.7 percent in the third quarter of 2011, according to the…
Durango rental rates on rise
Conversely, investment is spurred when rents and demands rise, state and local officials said, affecting the building market and local economy overall.
In fact, the latest rental market trends already are bringing new projects and investments to the area, said Jarrod Nixon, president of the Durango Area Association of Realtors.
“We are beginning to see investors returning to the market due to higher returns that make Durango a better long-term investment,” Nixon said.
Thursday, November 17, 2011
Housing News Digest, November 17
Report: Greeley’s apartment vacancy rate posts largest decline in state
The vacancy rate for apartments in Greeley fell to the lowest level among metropolitan areas in the state during the three-month period ending Sept. 3
Apartment vacancies at 10-year low
The vacancy rate in Colorado apartments fell during the third quarter of 2011, dropping to the lowest rate recorded since 2001.
According to a report released Thursday by the Colorado Division of Housing, the combined vacancy rate for apartments in 22 markets across Colorado during the third quarter was 5.0 percent. The vacancy rate was 5.5 percent during the third quarter of last year, and the rate was 5.2 percent during the second quarter of this year.
Vacancies plummet, rents rise in Fort Collins/Loveland
Meanwhile, in a simple supply-and-demand market, the median rent has soared from $856.53 a year ago to $932.58, a $76 jump. Just over the last six months — from the first quarter to third quarter — the median rent has gone up $53.
It’s no surprise that the closer one gets to the Colo-rado State University campus the tighter the rental market becomes.
RedPeak gets an earful
With the passion and fervor found in a fundamentalist congregation, hundreds of people gathered Wednesday night - appropriately in a former church - and voiced their opposition to an apartment community planned in the heart of the trendy West Highland neighborhood.
But the only soul the people attending “listening session” in the Highland Event Center - formerly a Presbyterian church at West 29th Avenue and Julian Street - was that of the neighborhood, which many in the audience feared will be irreparably harmed if RedPeak Properties, a $400 million multifamily housing developer based in Denver - is allowed to build three, five-story buildings on three parcels just north of West 32nd Avenue and Lowell Boulevard.
Colorado foreclosures fall to 42-month low (VIDEO)
Colorado foreclosures fall to 42-month low. 9NEWS at 11 a.m. 11/16/11
Apartment vacancies fall
Colorado's apartment-vacancy rate has reached its lowest level since 2001, the Colorado Division of Real Estate reported today.
The statewide apartment-vacancy rate, not including Denver, averaged 5 percent in the third quarter, down from 5.5 percent a year earlier and from 5.2 percent in the second quarter.
Colorado apartment vacancy rate falls to 5.0 percent, rents rise
Colorado apartment vacancy rate falls to 5.0 percent, rents rise
Click here for full report.
The vacancy rate in Colorado apartments fell during the third quarter of 2011, dropping to the lowest rate recorded since 2001. According to a report released Thursday by the Colorado Division of Housing, the combined vacancy rate for apartments in 22 markets across Colorado during the third quarter was 5.0 percent. The vacancy rate was 5.5 percent during the third quarter of last year, and the rate was 5.2 percent during the second quarter of this year.
The Colorado statewide vacancy rate has not been below 5.0 percent since the first quarter of 2001 when the rate was 4.3 percent.
The year-over-year drop in the statewide rate reflects declines in the vacancy rates in eighteen of the twenty-two markets surveyed. All metropolitan areas of the state reported declines in vacancies, year over year. Among smaller markets, only Canon City, Durango and Montrose reported increases in the vacancy rate.
Among the state’s metro areas, the largest drop was found in Greeley where the vacancy rate fell from 3.9 percent during the third quarter of 2010 to 1.8 percent during the same period this year.
The metro Denver vacancy rate, measured last month in a separate survey, fell year-over-year from 5.3 percent to 4.9 percent.
Vacancy rates in all metropolitan areas were Colorado Springs, 6.2 percent; Ft. Collins/Loveland, 2.3 percent; Grand Junction, 7.7 percent; Greeley, 1.8 percent; Pueblo, 7.3 percent.
“Declining vacancies are now a statewide trend, and it’s no longer a matter of just a few tight markets,” said Ron Throupe, an assistant professor of business at the University of Denver and the report’s author. “Even among the areas with sizable drops in vacancies, northern Colorado stands out with rates in Larimer County and in Greeley now dropping below 4 percent.”
Average rents across the state have increased as vacancies have fallen.
The statewide average rent in Colorado increased 3.1 percent from the third quarter of last year to the third quarter of this year, rising from $871 to $898. Across metro areas in the state, however, growth in average rents varied considerably. The average rent in the Colorado Springs area, for example, increased 6.7 percent, year over year, while the average rent in Pueblo fell 1.8 percent. During the same period, the average rent in Greeley increased 3.1 percent while the average rent in Grand Junction was unchanged.
The largest increase in the average rent was found in the Fort Collins/Loveland area where the average rent increased 8.5 percent from the third quarter of last year to the same period this year.
“Now that a trend of declining vacancies has been firmly established in some areas, we’re starting to see rent growth accelerate,” said Ryan McMaken, a spokesman with the Colorado Division of Housing. “Not surprisingly, Fort Collins and Loveland are showing some of the largest growth, but Colorado Springs is also starting to show a solid upward trend as well.”
Average rents in all metropolitan areas measured were Colorado Springs; $778, Ft. Collins/Loveland, $954; Grand Junction, $655; Greeley, $682; Pueblo, $541.
The metro Denver average rent, measured in a separate survey, was $936 during the third quarter.
The Vacancy and Rent Surveys are a service provided by the Colorado Division of Housing to renters and the multi-family housing industry on a quarterly basis. The Colorado Vacancy and Rent Survey reports averages and, as a result, there are often differences in rental and vacancy rates by size, location, age of building, and apartment type. The Report is available online at the Division of Housing web site: www.divisionofhousing.com
Wednesday, November 16, 2011
Foreclosure auction sales fall to 42-month low
Click here for the October report.
Foreclosure auction sales fall to 42-month low
Foreclosure sales at auction dropped to a 42-month low in Colorado’s metropolitan counties during October. According to a report released Wednesday by the Colorado Division of Housing, foreclosure auction sales in Colorado’s metropolitan counties were down 28.3 percent from October 2010 to October of this year. Sales fell from October 2010’s total of 1,308 to 938 sales during October of this year.
New foreclosure filings also fell with total filings dropping 23.2 percent from 3,059 filings in October 2010 to 2,350 filings in October of this year.
From September 2011 to October 2011, foreclosure filings fell 3.3 percent, and foreclosure sales at auction fell 16.5 percent.
Year-to-date through October, foreclosure auction sales were down 22.6 percent, falling from 2010’s ten-month total of 17,533 to 13,564 during the same period this year. Foreclosure filings were down 29.3 percent when comparing the same periods. There were 21,260 filings year-to-date this year, and 30,050 filings during the same period last year.
“October’s auction sales fell off more than expected, and it’s pretty clear at this point that there’s a well-established downward trend now in place,” said Ryan McMaken, a spokesman with the Colorado Division of Housing. “We’re cautiously optimistic that the trend will continue, but we’re waiting to see how things look after homeowners begin to pay off holiday bills early next year.”
Year-to-date through October, the counties with the largest decreases in foreclosure auction sales, year-over-year, were Adams County and Broomfield County, where sales decreased by 31.3 percent and 42.3 percent, respectively. Pueblo County reported the smallest decline in auction sales with a decrease of 10.2 percent from the first ten months of 2010 to the same period this year. All counties surveyed reported year-over-year decreases in foreclosure auction sales.
The county with the highest rate of foreclosure sales during October was Pueblo County with a rate of 950 households per foreclosure sale. Arapahoe County came in second with 1,183 households per foreclosure sale. The lowest rate was found in Boulder County where there were 3,988 households per foreclosure sale.
The Division of Housing’s monthly foreclosure report surveys foreclosure activity in the twelve largest counties of Colorado. The report is a supplement to the Division’s quarterly foreclosure report that includes all counties in Colorado.
Tuesday, November 15, 2011
Housing News Digest, November 15
City buying, fixing up foreclosed houses
Englewood is nearing its neighborhood stabilization program goal of buying 20 foreclosed houses and almost halfway to the program goal of repairing, renovating and selling all 20 of those homes.
“We are closing on the purchase of our 18th house, and we are looking at two more houses that may soon become available,” said Janet Grimmett, city housing finance specialist. “If we are able to buy those two houses, it will complete our housing purchases.”
Two local real estate projects fall into foreclosure
Two prominent commercial real estate projects have been hit with eight-figure foreclosure notices, the third and fourth largest foreclosures of the year in El Paso County and more signs that the area’s commercial market has a ways to go before it fully recovers.
A $16.4 million notice was filed this week against Compass Capital Group, an Arizona limited liability company that owns the Powers Office Park southeast of Powers Boulevard and Briargate Parkway on Colorado Springs’ northeast side, according to El Paso County Public Trustee records.
Out-of-state investors are eying Colorado Springs’ rapidly improving apartment market.
The average rent in Colorado Springs hit a record high during the third quarter of this year as vacancy rates dropped to their second-lowest in a decade, according to a report from the Colorado Division of Housing.
The Colorado Springs market was depressed longer and is now coming back stronger and more aggressively than any other market in the state, said division spokesman Ryan McMaken. And that dramatic comeback after a decade of stagnate rents and double-digit vacancy rates has interested out-of-state investors in our apartment market.
Boulder among nation’s costliest college towns for homes
Boulder is the nation’s fifth most expensive college town in which to buy a home, according to a report Tuesday from Coldwell Banker Real Estate LLC.
U.S. farmland prices hit record highs on crop demand
The average cost of a three-bedroom, two-bathroom home in Boulder, home of the University of Colorado Boulder, is $731,617, the report states.
(Reuters) - U.S. farmland prices in the third quarter saw their biggest surge in over three decades in an accelerating agricultural boom that has so far defied fears of a bubble about to burst.
Prices hit record highs in the U.S. Plains, where wheat and cattle dominate production, and jumped 25 percent in the Midwest Corn Belt where bumper grain crops and recovering livestock markets put more money in farmers' wallets and enticed investors to bid up for the fertile ground, according to two Federal Reserve bank surveys issued on Tuesday
Monday, November 14, 2011
New toolkit for carbon monoxide poisoning prevention
CDC has recently released a new toolkit for carbon monoxide poisoning prevention. The toolkit features downloadable and easy to use resources that organizations can include in their own awareness materials and communication channels. These materials are available to download free of charge.
The toolkit includes:
· Web banner ads,
· flyers and posters,
· print PSAs,
· B-roll video, and
· bill inserts that can be re-formatted into magnets.
The content of the toolkit also provides strategic approaches and suggestions to use and distribute these resources.
CDC has partnered with Consumer Product Safety Commission, the American Lung Association, the National Public Health Information Coalition (NPHIC) and others, and you are invited to join the effort to raise awareness about this important topic.
You can access the materials at http://www.nphic.org/component/docman/cat_view/66-emergency-communications/101-carbon-monoxide
Thursday, November 10, 2011
Unemployment rates in all metro areas except Pueblo fall below national rate
The BLS released its report last week on unemployment in 372 metro areas in the US. The data for Colorado is not different from the statewide report already released by the Colorado Department of Labor and Employment. The chart with local unemployment rates is here.
Nevertheless, the report does provide some comparisons with other metro areas in the nation. The map on the last page shows that the all metro areas in Colorado, except for Pueblo, have unemployment rates (not seasonally adjusted) below the national rate of 8.8 percent (not seasonally adjusted). This is a significant change from September when the Colorado Springs, Grand Junction, Pueblo and Greeley areas all reported unemployment rates above the national rate.
The map:
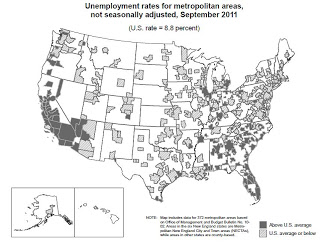
Statewide, Colorado's unemployment rate (seasonally adjusted) remains below the national rate for the sixth month in a row following a three month period(January-March 2011) during which Colorado's unemployment rate was higher than the nation's. Prior to January 2011, the unemployment rate in Colorado had been below the national rate for several years.
The Boulder and Fort Collins areas have posted better unemployment rates than the nation for quite some time. Denver has in the past several months dropped below the national rate, and now only Pueblo remains above the national rate.
National comparisons remain important insofar as perceptions of the local job market drive household creation in Colorado. As long as Colorado is perceived as being a better job market than many metro areas in the nation, such a perceptions will foster household creation and population growth in the state.
Nevertheless, the report does provide some comparisons with other metro areas in the nation. The map on the last page shows that the all metro areas in Colorado, except for Pueblo, have unemployment rates (not seasonally adjusted) below the national rate of 8.8 percent (not seasonally adjusted). This is a significant change from September when the Colorado Springs, Grand Junction, Pueblo and Greeley areas all reported unemployment rates above the national rate.
The map:
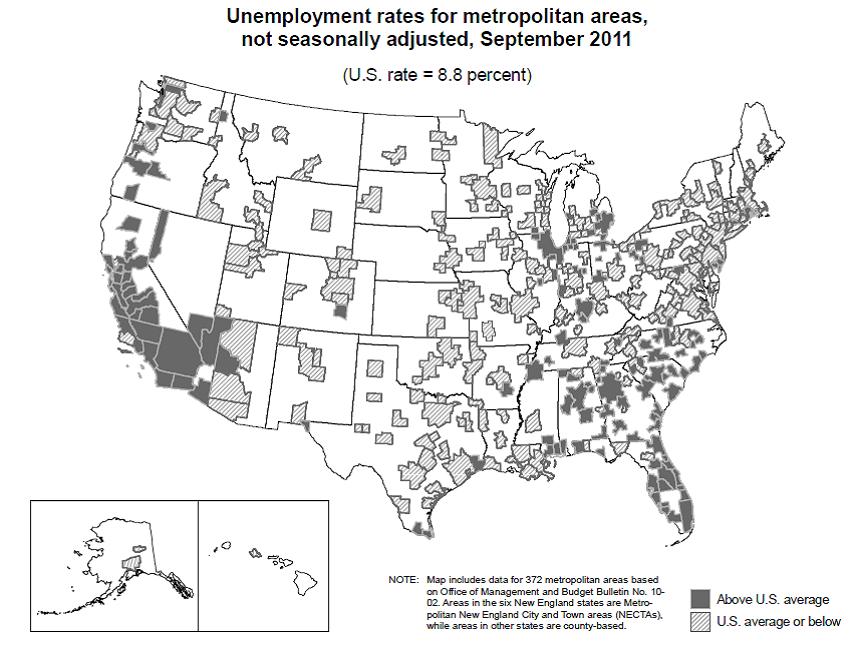
Statewide, Colorado's unemployment rate (seasonally adjusted) remains below the national rate for the sixth month in a row following a three month period(January-March 2011) during which Colorado's unemployment rate was higher than the nation's. Prior to January 2011, the unemployment rate in Colorado had been below the national rate for several years.
The Boulder and Fort Collins areas have posted better unemployment rates than the nation for quite some time. Denver has in the past several months dropped below the national rate, and now only Pueblo remains above the national rate.
National comparisons remain important insofar as perceptions of the local job market drive household creation in Colorado. As long as Colorado is perceived as being a better job market than many metro areas in the nation, such a perceptions will foster household creation and population growth in the state.
Bankruptcy filings decrease for ninth month in a row
In Colorado during October, total bankruptcy cases filed fell 5.4 percent, year over year, to 2,469 cases. During October 2010, 2,6112 cases were filed. October was the ninth month in a row in which bankruptcies declined year over year.
The first graph shows the year-over-year changes in bankruptcy case filings since January 2007:

The appearance of sustained declines in the year-over-year comparisons reinforces the likelihood that consumers are beginning to get a handle on debts now that more than three years have passed since the beginning of the national 2007-2009 recession.
In general, however, bankruptcy filings have grown since 2006 following the implementation of the 2005 Bankruptcy Act (discussed here).
The large spike in 2005 preceded the implementation of the new bankruptcy rules. Filings totals have now returned to the levels experienced just prior to the final run-up in cases in 2005.
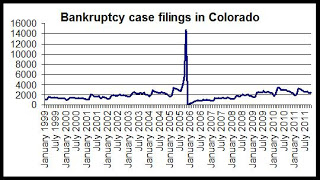
Recent monthly bankruptcy totals are now on a level similar to what was experienced during several months of 2004 and 2005, during a non-recessionary period. Bankruptcies increased from September to October, but this appears to be due to seasonal factors.
Note: April tends to be a peak month for bankruptcy filings as people use their tax refunds to pay for bankruptcy attorneys and filing costs.
The first graph shows the year-over-year changes in bankruptcy case filings since January 2007:
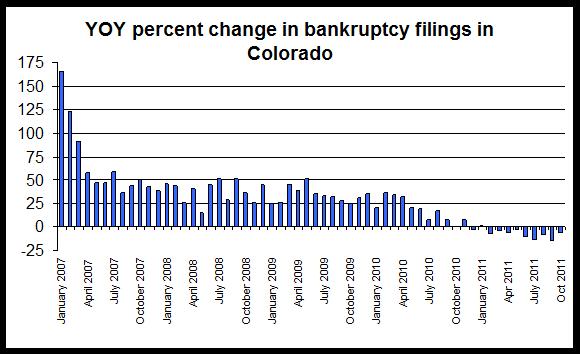
The appearance of sustained declines in the year-over-year comparisons reinforces the likelihood that consumers are beginning to get a handle on debts now that more than three years have passed since the beginning of the national 2007-2009 recession.
In general, however, bankruptcy filings have grown since 2006 following the implementation of the 2005 Bankruptcy Act (discussed here).
The large spike in 2005 preceded the implementation of the new bankruptcy rules. Filings totals have now returned to the levels experienced just prior to the final run-up in cases in 2005.
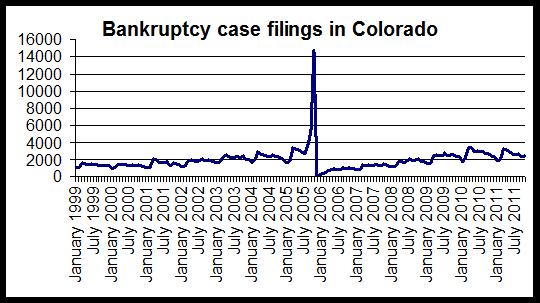
Recent monthly bankruptcy totals are now on a level similar to what was experienced during several months of 2004 and 2005, during a non-recessionary period. Bankruptcies increased from September to October, but this appears to be due to seasonal factors.
Note: April tends to be a peak month for bankruptcy filings as people use their tax refunds to pay for bankruptcy attorneys and filing costs.
Upcoming posts for next week
We've released a lot of our own data over the past week with new foreclosure reports and vacancy surveys. As a result, I've gotten a little behind with some of the BLS data and other reports that have come out. Over the next week, I'll be posting the following:
The latest CoreLogic (September) home price changes for Colorado and metro Denver
Colorado data for mass layoffs and new unemployment insurance claims (3rd Q)
Metro area unemployment information
Regional data for job openings and labor turnover
Colorado Statewide vacancy and rent data
October foreclosure statistics for Colorado
Analysis: Colorado Springs rents rise, vacancies fall
According to new Colorado Springs vacancy and rent data released today by the Colorado Division of Housing, multifamily rental vacancies fell again while rent levels increased to record highs.
The region-wide vacancy rate fell 6 percent from 6.6 percent during the 3rd quarter of 2011 to 6.2 percent during the 3rd quarter of this year. As can be seen in the first graph, the vacancy rate has been down, year-over-year for nine out of the last ten quarters. With the exception of the second quarter of this year, the year-over-year change has been negative for every quarter since during the 3rd quarter of 2008. This suggests a solid downward trend in vacancy rates over the past two years and helps to explain the sizable increases in rent that have been reported in recent quarters in the region.

The second chart, which shows the vacancy rate itself for each quarter, shows that the vacancy rate for the Colorado Springs metro area remains near the ten-year low of 5.8 percent, reached earlier this year, and is well below what has been typical for the vacancy rate over the past ten years.
At 6.2 percent, the third quarter's vacancy rate is the lowest third-quarter rate since 2001.
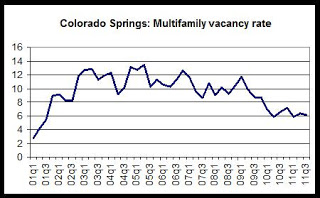
Average and median rents in the region also continued a fairly rapid upward trend in rent levels.
The third graph shows the value of the average and median rents in each quarter. Notably, the average rent for the Colorado Springs area has not decreased since the third quarter of 2009. In each quarter since, the average rent has been flat or has increased from each quarter to the next, creating the longest period of sustained rental increases in ten years.
The region began to show some significant growth in both the median and average rent in 2010, and this trend has accelerated during the third quarter of 2011. Both median and average rents are now at record highs.
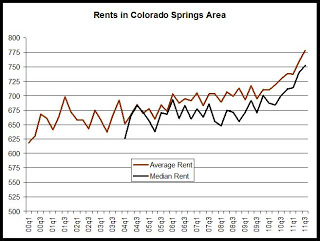
The region-wide average rent in Colorado Springs has increased for the past seven quarters when compared to the same quarter the previous year. It increased 6.7 percent from the third quarter of 2010 to the third quarter of this year. As can be seen in the last graph, the past five quarters have shown growth rates near or above 4 percent which is somewhat similar to the sort of growth in average rents seen in Colorado Springs before the 2002 recession hit Colorado. At 6.7 percent, the year-over-year change in the average rent for the second quarter of 2011 was the largest change reported in more than ten years.
This rate of increase is well above September's annual CPI increase (3.5 percent), and illustrates that rent growth in the region is notable, even when adjusted for inflation.
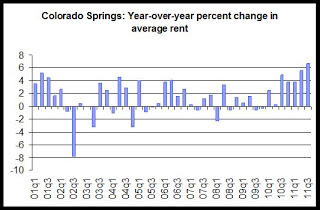
While the recent growth in rents and the declines in vacancy rates does not in itself prove continued demand for multifamily rentals in the region, the absence of any substantial amount of new construction of rentals in the area will contribute to ongoing rent growth and tightness in vacancies. Barring a large mobilization of troops out of the area, there will be sufficient population to sustain continued demand for rentals.
See here for the latest on multifamily permit data in El Paso County.
In addition, the relative unattractiveness or lack of accessibility to for-purchase housing at this time will reinforce this trend.
Note: The average rent information above is not adjusted for inflation. For information on inflation-adjusted rents, see here.
The vacancy and rent report also contains information on median rents. For more information on the differences between median and average rents, see here.
The region-wide vacancy rate fell 6 percent from 6.6 percent during the 3rd quarter of 2011 to 6.2 percent during the 3rd quarter of this year. As can be seen in the first graph, the vacancy rate has been down, year-over-year for nine out of the last ten quarters. With the exception of the second quarter of this year, the year-over-year change has been negative for every quarter since during the 3rd quarter of 2008. This suggests a solid downward trend in vacancy rates over the past two years and helps to explain the sizable increases in rent that have been reported in recent quarters in the region.
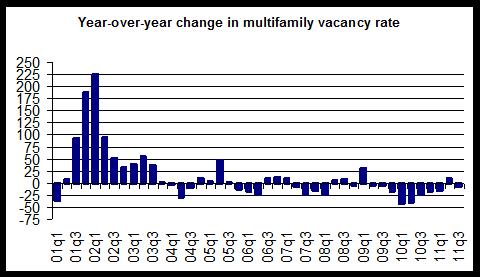
The second chart, which shows the vacancy rate itself for each quarter, shows that the vacancy rate for the Colorado Springs metro area remains near the ten-year low of 5.8 percent, reached earlier this year, and is well below what has been typical for the vacancy rate over the past ten years.
At 6.2 percent, the third quarter's vacancy rate is the lowest third-quarter rate since 2001.
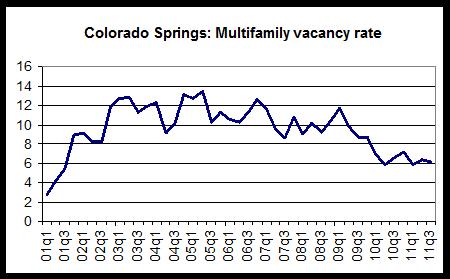
Average and median rents in the region also continued a fairly rapid upward trend in rent levels.
The third graph shows the value of the average and median rents in each quarter. Notably, the average rent for the Colorado Springs area has not decreased since the third quarter of 2009. In each quarter since, the average rent has been flat or has increased from each quarter to the next, creating the longest period of sustained rental increases in ten years.
The region began to show some significant growth in both the median and average rent in 2010, and this trend has accelerated during the third quarter of 2011. Both median and average rents are now at record highs.
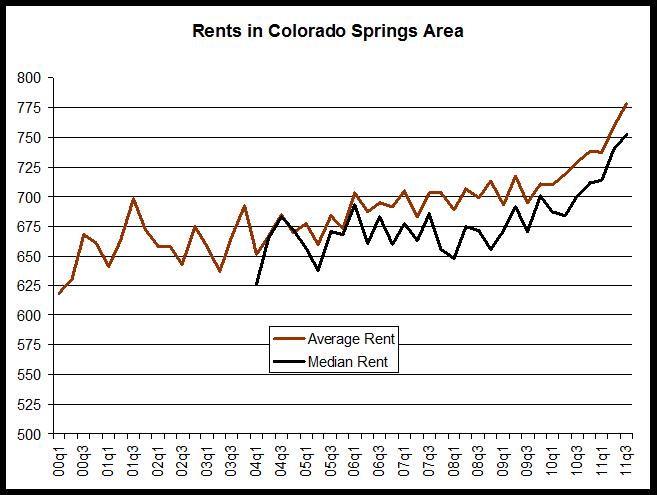
The region-wide average rent in Colorado Springs has increased for the past seven quarters when compared to the same quarter the previous year. It increased 6.7 percent from the third quarter of 2010 to the third quarter of this year. As can be seen in the last graph, the past five quarters have shown growth rates near or above 4 percent which is somewhat similar to the sort of growth in average rents seen in Colorado Springs before the 2002 recession hit Colorado. At 6.7 percent, the year-over-year change in the average rent for the second quarter of 2011 was the largest change reported in more than ten years.
This rate of increase is well above September's annual CPI increase (3.5 percent), and illustrates that rent growth in the region is notable, even when adjusted for inflation.
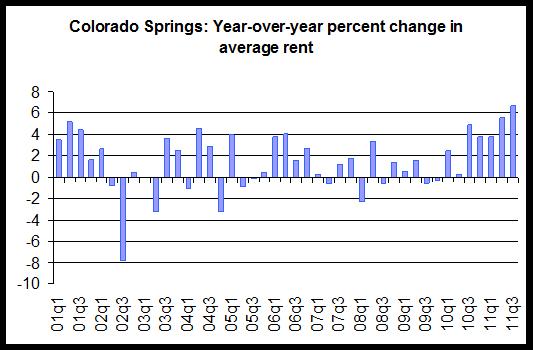
While the recent growth in rents and the declines in vacancy rates does not in itself prove continued demand for multifamily rentals in the region, the absence of any substantial amount of new construction of rentals in the area will contribute to ongoing rent growth and tightness in vacancies. Barring a large mobilization of troops out of the area, there will be sufficient population to sustain continued demand for rentals.
See here for the latest on multifamily permit data in El Paso County.
In addition, the relative unattractiveness or lack of accessibility to for-purchase housing at this time will reinforce this trend.
Note: The average rent information above is not adjusted for inflation. For information on inflation-adjusted rents, see here.
The vacancy and rent report also contains information on median rents. For more information on the differences between median and average rents, see here.
Subscribe to:
Posts (Atom)