New personal income data for Colorado was
released today by the BLS.
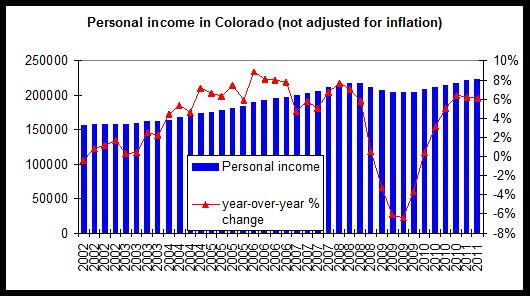
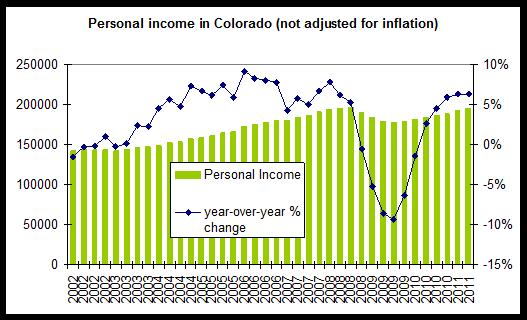
Colorado has now surpassed the personal income peak achieved before the 2008 financial crisis. At $224.3 billion, personal income in Colorado is above the peak levels reached during the third quarter of 2008, when personal income reached $218.1 billion. Personal income is now up by 2.7 percent from previous peak levels.
In year-over-year comparisons, personal income in Colorado is up 6.1 percent from the second quarter of 2010 to the same period this year. This is the lowest year-over-year rate of increase since the third quarter of 2010, when personal income grew 5.0 percent, year over year.
Personal income in Colorado still lags the US as a whole and the Rocky Mountain region. As of the 2nd quarter of 2011, The Rocky Mountain region is 3.1 percent above peak levels and the US is 3.2 percent above its own previous peak which occurred during the second quarter of 2008.
Over ten years from the 2nd quarter of 2002 to the 2nd quarter of 2011, US personal income increased 43 percent, and in Colorado it increased 41 percent. In the Rocky Mountain region, the increase for the same period was 49 percent.
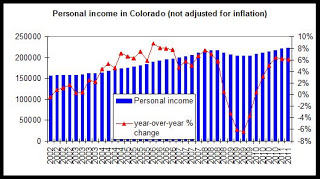
(personal income is shown in 1,000,000s)
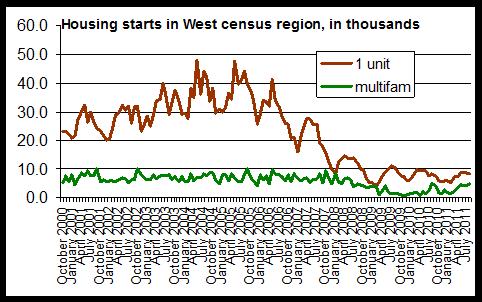
Personal income figures are not adjusted for inflation. Over the past decade, the consumer price index in the United States West region increased 23 percent. So, income growth has outpaced inflation, but real income growth is about half of nominal income growth.
Since the peak levels reached during the third quarter of 2008, personal income is up 2.7 percent, but the CPI in the U.S. West has increased 1.9 percent during the same period.
Much of the increase that has occurred may be attributed to a 34 percent increase in personal current transfer receipts since the 2008 peak.
The effect of personal current transfer receiptsAn important component of personal income is "personal current transfer receipts." These are forms of income not died to wages and employment income and include payments such as social security payments, unemployment insurance, Medicare and Medicaid.
When personal current transfer receipts are removed from personal income, income growth is not as robust.
The second chart shows personal income minus personal current transfer receipts.

(personal income is shown in 1,000,000s)
Without the inclusion of transfer receipts, personal income in Colorado is down 0.7 percent from peak levels. In other words, by this measure, Colorado has seen no personal income growth since the peak unless these transfer receipts are included.
Naturally, when adjusted for inflation, personal income (minus transfer receipts) has also declined since 2008. Since the peak period, the CPI has increased 1.9 percent. Comparing the 0.7 percent decline in income since the peak with the 1.9 percent increase in the CPI, we see that income growth has not kept up with price inflation and that real incomes have not yet returned to peak levels.
By this measure we also find that Colorado lags both the nation and the Rocky Mountain Region. Since the peak period, income minus transfer receipts in the Rocky Mountain Region has dropped 0.6 percent. Nationally, personal income minus transfer receipts is 0.01 percent above peak levels.
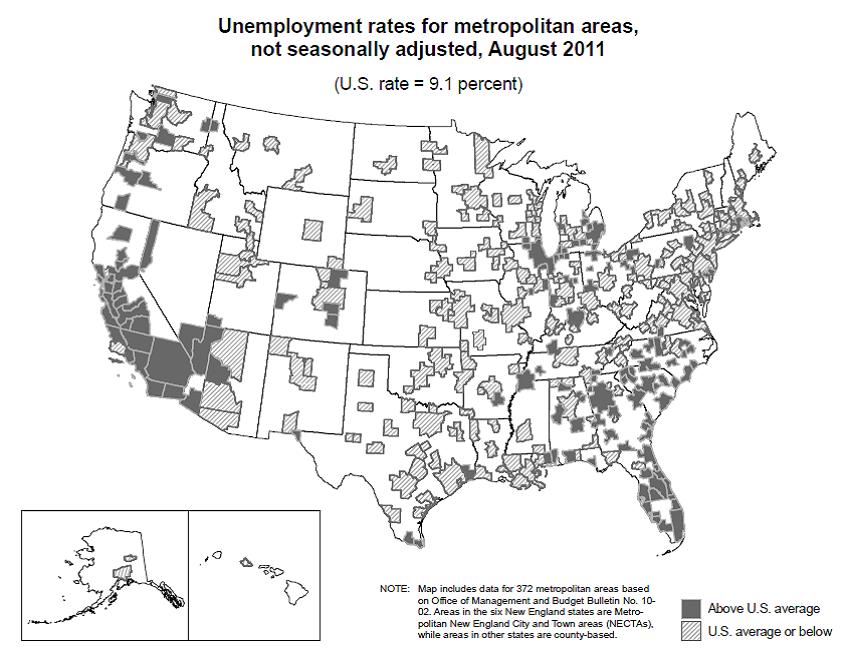
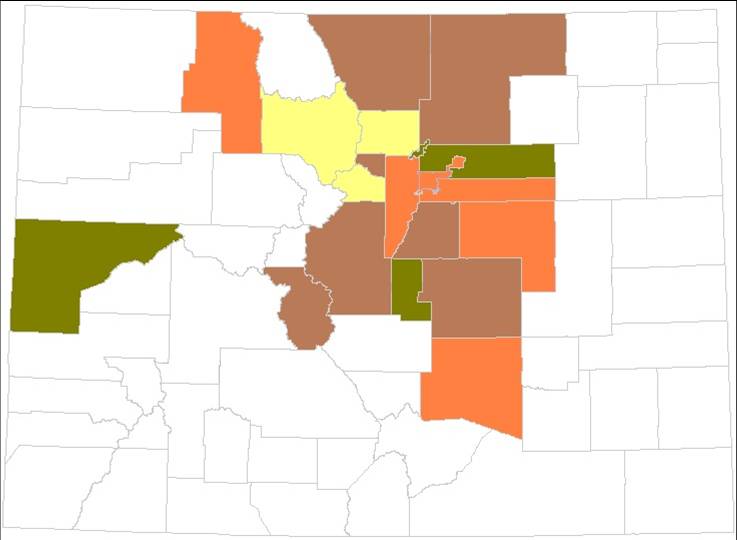
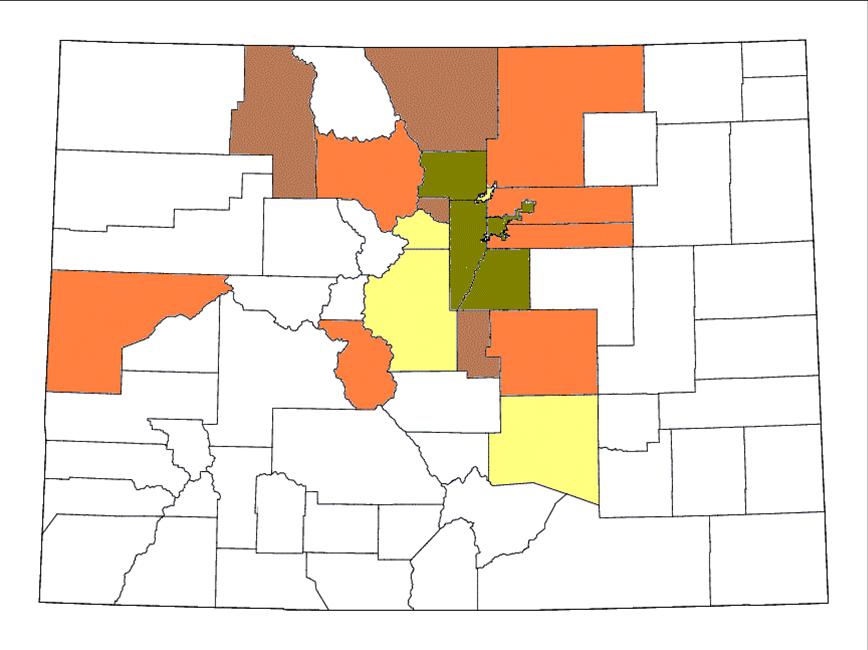
ConclusionsOverall, Colorado's real estate markets and labor markets have not suffered as much as many markets, but in a variety of ways, including personal income, Colorado is recovering more slowly than the nation. Compared to all other states, Colorado is ranked below the middle, placing in the second-to-lowest quintile. See the map
here.
Generally speaking, personal income has been largely flat in Colorado since 2008 reflecting a sluggish job market and wage growth. Income growth from wages and employment has been sluggish as is shown when transfer receipts are excluded from calculations. This makes sense given that May 2011 employment data showed Colorado's total employment totals falling by 6,100 jobs when compared year over year.
Note: Personal income is the income received by all persons from all sources. Personal income is the sum of net earnings by place of residence, property income, and personal current transfer receipts. Total personal income will rise as population rises, even if household incomes are declining. Property income is rental income of persons, personal dividend income, and personal interest income. Net earnings is earnings by place of work (the sum of wage and salary disbursements, supplements to wages and salaries, and proprietors' income) less contributions for government social insurance, plus an adjustment to convert earnings by place of work to a place-of-residence basis. Personal income is measured before the deduction of personal income taxes and other personal taxes and is reported in current dollars (no adjustment is made for inflation).