Colorado foreclosure auction sales down 25 percent in 2012 (Denver Post)
New foreclosure auction sales were down
25 percent in Colorado during the first quarter of 2012, compared to the
first quarter of 2011, according to a report released today by the
Colorado Division of Housing.
Following three quarters of
declines, auction sales rose slightly during the first quarter of this
year, but remained well below the totals reported during the first
quarter of last year, according to the report.
Sharp drop in Colorado foreclosures in Q1 (DBJ)
By county, 11 of the state’s 12 metropolitan counties reported year-over-year declines in foreclosure sales in the first quarter. Denver and Douglas counties both had 39 percent drops, while El Paso County fell 24 percent. Only Broomfield County reported an increase, with auction sales rising 36 percent there.
Foreclosure activity down in Larimer County and statewide (Loveland RH)
In Larimer County, lenders filed for foreclosure on 306 properties in the first quarter of this year, a 3.8 decrease from the first quarter of 2011. That number also was a 3.5 percent decline from the previous quarter, the report said.
Statewide in the first quarter, new filings declined 3.7 percent from last year and 8.9 percent from the previous quarter.
Foreclosure activity slows in Pikes Peak region during 1st quarter (CS Gazette)
The Pikes Peak region was one of several areas in the state that saw a slowdown in foreclosure activity during the first few months of 2012, according to a Colorado Division of Housing report released Thursday.
Foreclosure filings in El Paso County, which includes Colorado Springs, fell 11.3 percent in the first quarter when compared with the same period a year ago. Meanwhile, year-over-year foreclosure sales saw a 24.1 percent reduction.
Weld Foreclosure Sales Down 33.8% in 2012 Compared to 2011 (Greeley Trib)
Foreclosures are continuing their downward spiral in Weld County with a decline of 17.8 percent in filings and 33.8 percent in sales at the end of the first quarter of 2012 compared to last year at the same time.
Boulder County foreclosure sales, filings outpace state average (Longmont Times Call)
The Colorado Division of Housing said Wednesday that Boulder County reported 214 foreclosure filings in the first quarter of 2012, a 7 percent drop from the 231 reported in the first quarter of 2011.
That compares with 7,783 filings statewide during the quarter, down nearly 4 percent from a year ago.
New stats show improving housing market (NCBR)
Foreclosure activity in Larimer and Weld counties is slowing amid new signs of a real estate recovery.
According to state data, new foreclosure filings were down in the first quarter compared with the same period a year earlier, declining by 3.8 percent to 318 filings in Larimer and by 17.8 percent to 412 filings in Weld.
Thursday, April 26, 2012
Foreclosure auction sales down 25 percent in 2012
New foreclosure auction sales were down 25 percent in Colorado during the
first quarter of 2012, compared to the first quarter of 2011. Following three
quarters of declines, auction sales rose slightly during the first quarter of
this year, but remained well below totals reported during the first quarter of
last year. According to a report released today by the Colorado Division of
Housing, there were 4,221 foreclosure auction sales, or completed foreclosures,
reported during the first quarter of 2012. There were 5,605 sales reported
during the same period of last year. Sales totals rose four percent from the
fourth quarter of last year to the first quarter of this year, rising from 4,057.
New foreclosure filings also fell during the first quarter. Foreclosure
filing totals for the first quarter of this year were down 3.7 percent, falling
to 7,783 from 2011’s first-quarter total of 8,079. From the fourth quarter of
last year to the first quarter of this year, foreclosure filings fell 8.9
percent.
Foreclosure auction sales during the first quarter fell 40
percent below the 2007’s peak of 7,117 auction sales reported during the third
quarter of that year. Auction sales totals are now near a five-year low. New
foreclosure filings during the first quarter fell 37 percent below 2009’s peak
of 12,468 reported during the third quarter of that year.
“Foreclosure activity continues to trend downward in Colorado, even when compared
to early 2011 which itself saw a big drop from 2010 totals,” said Ryan McMaken,
spokesman for the Colorado Division of Housing. “Toward the end of 2011, we saw
employment and home prices stabilize while home buying appeared to increase, so
these foreclosure numbers likely reflect those factors.”
While several regions of Colorado saw improvement during 2011, some areas
continued to experience growth in foreclosures.
Eleven of the state’s twelve metropolitan counties reported
year-over-year declines in the number of foreclosure auction sales occurring
during the first quarter. Sales declined 39 percent in Denver
and Douglas counties from the first quarter of last year to the first quarter
this year, while El Paso
County declined 24
percent during the same period. Only Broomfield
County reported an
increase, with auction sales rising 36 percent.
Those counties that did experience increases were generally
found outside the Front Range. From the first
quarter of 2011 to the first quarter of 2012, 16 of Colorado’s 64 counties reported increases in
foreclosure auction sales. Among those 16, 11 were mountain counties including
Garfield, San Miguel, Ouray and Eagle counties.
The five counties with the highest foreclosure rates during the
first quarter were San Juan, Eagle, Garfield, Las Animas, and
Park. Mesa County
was the only metro county among the counties with the top ten highest
foreclosure rates in the state. Boulder
County, on the other
hand, reported the lowest foreclosure rate of any metropolitan county and also
had one of the lowest foreclosure rates overall.
“Several mountain counties are still dealing with growth in
foreclosure activity, and may not have peaked yet,” McMaken said. “The Front Range, however, which drives the overall statewide
totals, looks like it peaked back in 2010.”
Foreclosure sales are
opened foreclosures that have proceeded through the full foreclosure process to
final sale at public auction. Filings denote the beginning of the foreclosure
process, and once a foreclosure is filed, the borrower has at least 110-120
days to work with the lender to avoid a completed foreclosure. It is during
this period that borrowers work with lenders and housing counselors to work out
loan modifications, short sales, or other ways of withdrawing the foreclosure.
Wednesday, April 25, 2012
Colorado outpaces most states in latest Philly Fed index
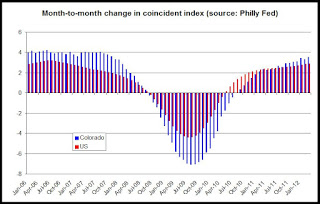
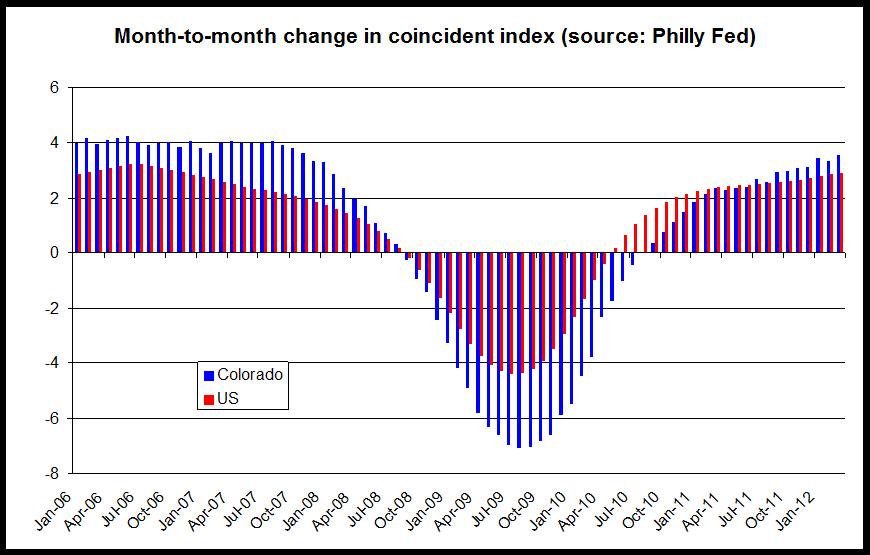
The Coincident Index for Colorado rose 0.4 percent from February 2012
to March 2012, which was a larger growth rate than 34 states. March's index, which was released yesterday by
the Philadelphia Federal Reserve Bank, is an index calculated from
nonfarm payroll employment, average hours worked in manufacturing, the
unemployment rate, and wage and salary disbursements deflated by the
consumer price index (U.S. city average).
Colorado's increase of 0.4 percent was above the national index's increase of 0.29.
According to the March 2012 report:
March's month-over-month increase was the 18th increase in a row for Colorado, and was the longest stretch of monthly increases reported since 2007.
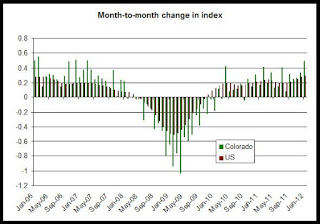
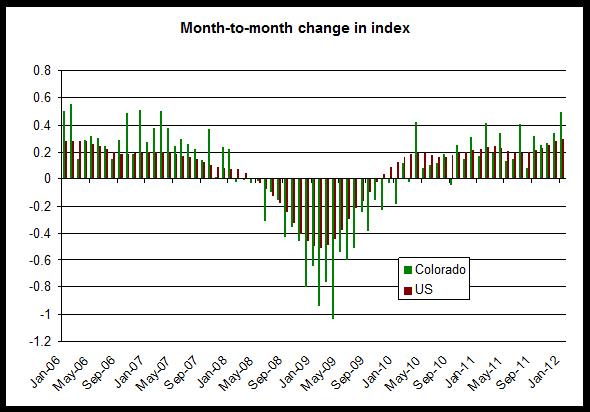
The graph below compares the month-to-month change in both the Colorado Index and the US index. In recent months, the growth rate in Colorado has begun to outpace that of the nation.
The second graph shows year-over-year changes in the index, and an upward trend is evident here as well:
Overall, this report reinforces earlier data showing ongoing slow and steady increases in real estate demand and employment.
The coincident indexes combine four state-level indicators to summarize current economic conditions in a single statistic. The four state-level variables in each coincident index are nonfarm payroll employment, average hours worked in manufacturing, the unemployment rate, and wage and salary disbursements deflated by the consumer price index (U.S. city average). The trend for each state’s index is set to the trend of its gross domestic product (GDP), so long-term growth in the state’s index matches long-term growth in its GDP.
Colorado's increase of 0.4 percent was above the national index's increase of 0.29.
According to the March 2012 report:
The Federal Reserve Bank of Philadelphia has released the coincident indexes for the 50 states for March 2012. In the past month, the indexes increased in 48 states, decreased in one state (Rhode Island), and remained stable in one state (South Dakota), for a one-month diffusion index of 94. Over the past three months, the indexes increased in all 50 states, for a three-month diffusion index of 100. For comparison purposes, the Philadelphia Fed has also developed a similar coincident index for the entire United States. The Philadelphia Fed’s U.S. index rose 0.3 percent in March and 0.9 percent over the past three months.
March's month-over-month increase was the 18th increase in a row for Colorado, and was the longest stretch of monthly increases reported since 2007.
The graph below compares the month-to-month change in both the Colorado Index and the US index. In recent months, the growth rate in Colorado has begun to outpace that of the nation.
The second graph shows year-over-year changes in the index, and an upward trend is evident here as well:
Overall, this report reinforces earlier data showing ongoing slow and steady increases in real estate demand and employment.
The coincident indexes combine four state-level indicators to summarize current economic conditions in a single statistic. The four state-level variables in each coincident index are nonfarm payroll employment, average hours worked in manufacturing, the unemployment rate, and wage and salary disbursements deflated by the consumer price index (U.S. city average). The trend for each state’s index is set to the trend of its gross domestic product (GDP), so long-term growth in the state’s index matches long-term growth in its GDP.
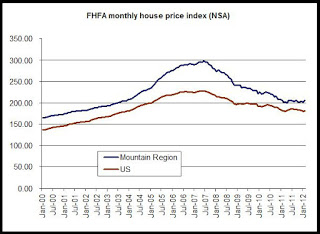
FHFA: Mountain states home prices turn positive in February
House prices in February in the Mountain region, which includes
Colorado, were up, year over year, for the first time in 53 months. During February, the FHFA home price index for the mountain state region increased 1.7 percent over February 2011. Nationally, the house price
index rose slightly for the first time since July 2007, rising 0.4 percent. The new house price index
numbers, released today
by the Federal Housing and Finance Agency, also showed that the
national index is down 20.3 percent from the peak level reached in June
2007, while the Mountain region's index is down 30.7 percent over the
same period.
The FHFA monthly index is calculated using purchase prices of houses purchased with loans that have been sold to or guaranteed by Fannie Mae or Freddie Mac. It is a repeat-sales index similar to the Case-Shiller index, but limited to GSE loans.
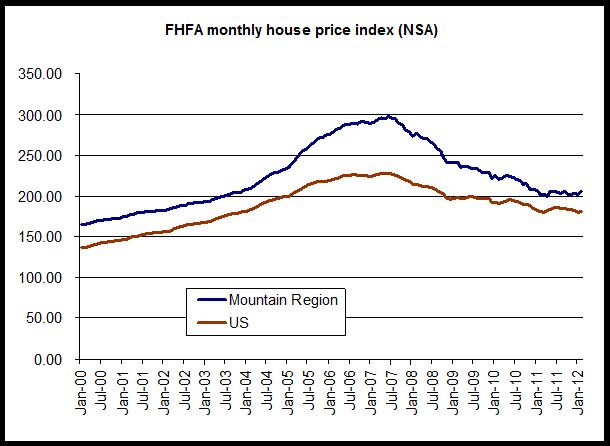
Although it has shown more negative growth than other indices in recent years, the increase in FHFA monthly house prices in the region generally reflects overall trends also found in other home price indices such as the CoreLogic index and the Case-Shiller index. According to FHFA, prices have largely stabilized over the past several months, but remain slightly down from 2009 and 2010 levels. Home prices have shown year-over-year increases since January 2012 in both the Case-Shiller and the CoreLogic indices. The first chart shows the index values for the U.S. and the Mountain region.
The second chart shows each month's house price index compared to the same month a year earlier:
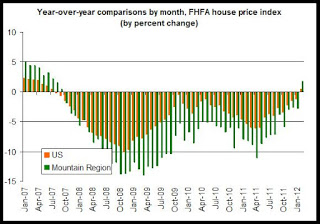
February 2012 was the end of a period of negative year-over-year comparisons in home prices that lasted 52 months in a row. We can note that until February (in the latest revisions), the Mountain region had tended to perform more poorly (from a seller's perspective) than the national index. This runs contrary to some local experience and some statistics. The Case-Shiller data for the Denver metro area, for example, shows that local prices did not decline as much as the national composite index following the financial crisis in 2008. Also, the FHFA "expanded-data" index shows Colorado performing better than the national index. Yet during February, the monthly FHFA index shows that mountain region with a larger increase in the price index than the nation overall.
Since we're looking at regional data, however, we have to keep in mind that this data reflects house prices in Arizona and Nevada, and this no doubt will continue to put downward pressure on regional prices for now.
Overall, this report signals that home prices began to turn positive in the region during early 2012. This reflects trends reported for Colorado and metro Denver in other home price indices as well.
The FHFA monthly index is calculated using purchase prices of houses purchased with loans that have been sold to or guaranteed by Fannie Mae or Freddie Mac. It is a repeat-sales index similar to the Case-Shiller index, but limited to GSE loans.
Although it has shown more negative growth than other indices in recent years, the increase in FHFA monthly house prices in the region generally reflects overall trends also found in other home price indices such as the CoreLogic index and the Case-Shiller index. According to FHFA, prices have largely stabilized over the past several months, but remain slightly down from 2009 and 2010 levels. Home prices have shown year-over-year increases since January 2012 in both the Case-Shiller and the CoreLogic indices. The first chart shows the index values for the U.S. and the Mountain region.
The second chart shows each month's house price index compared to the same month a year earlier:
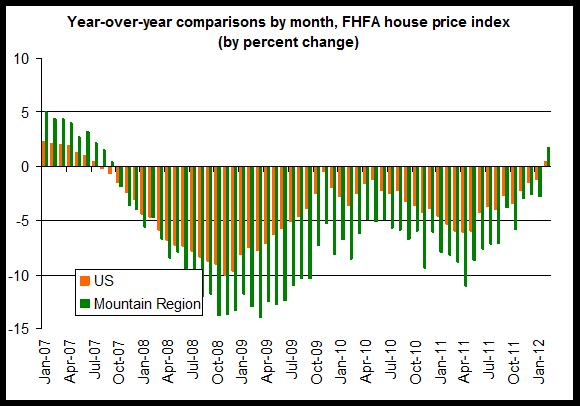
February 2012 was the end of a period of negative year-over-year comparisons in home prices that lasted 52 months in a row. We can note that until February (in the latest revisions), the Mountain region had tended to perform more poorly (from a seller's perspective) than the national index. This runs contrary to some local experience and some statistics. The Case-Shiller data for the Denver metro area, for example, shows that local prices did not decline as much as the national composite index following the financial crisis in 2008. Also, the FHFA "expanded-data" index shows Colorado performing better than the national index. Yet during February, the monthly FHFA index shows that mountain region with a larger increase in the price index than the nation overall.
Since we're looking at regional data, however, we have to keep in mind that this data reflects house prices in Arizona and Nevada, and this no doubt will continue to put downward pressure on regional prices for now.
Overall, this report signals that home prices began to turn positive in the region during early 2012. This reflects trends reported for Colorado and metro Denver in other home price indices as well.
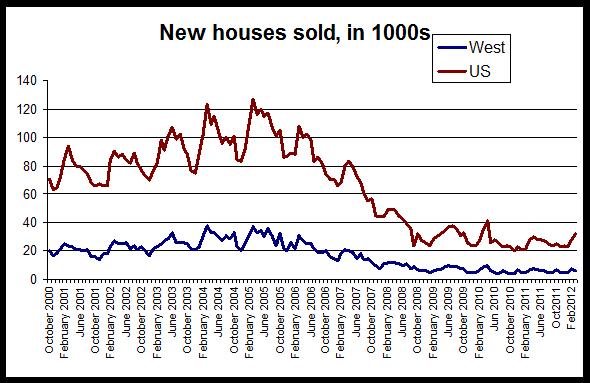
New home sales hit new March low in Western U.S.
New single-family home sales were at the lowest total reported during March in more than ten years in the West region
of the US, which includes Colorado. According to Tuesday's New Home Sales report, released by the Census Bureau,there were six thousand new home sales in the Western U.S. during March 2012.
The report, which monitors sales activity for newly constructed houses, reported that in the West, new home sales were down 14 percent during March 2012 from the 7,000 new homes sold in March 2011. Nationwide, sales rose 14 percent, rising from 28,000 to 32,000 during the same period.
At 6,000 new home sales during March, sales are also down from February 2012's total of 8,000, signaling weakness in the regional homebuilding market going into the warmer spring season.
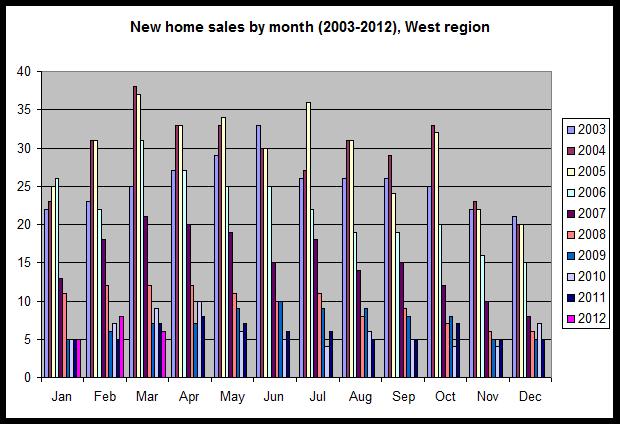
The first graph shows monthly new home sales totals for each month since 2003:
For the West region:
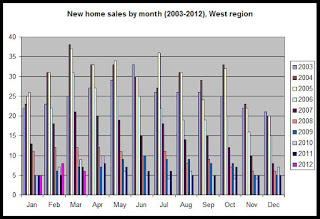
The second graph shows that new home sales continue to fall and have generally followed a downward trend since the middle of the decade.
New home sales peaked during the spring and summer of 2005 and have trended downward since. The number of new houses sold in the United States is down 80 percent since the peak of March 2005, and new home sales in the West have fallen 881 percent since sales peaked in the region during March 2004.

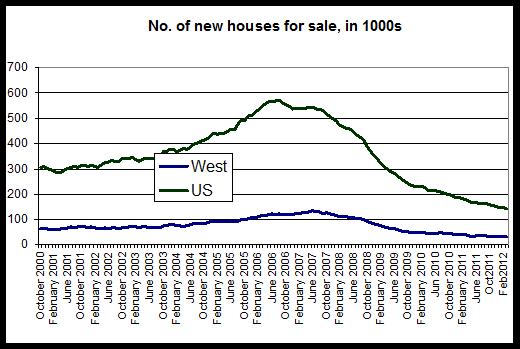
The third graph shows the declines in both US and regional totals in new homes for sale.
The number of new homes for sale has also fallen off considerably. The number of new houses for sale in the West has fallen 76 percent since the total peaked during June 2007, and the same total has fallen 74 percent in the US since the number of new homes for sale peaked in the US during August 2006.
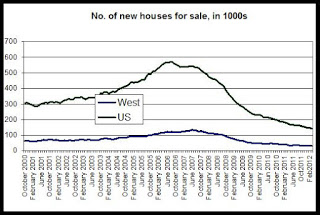
The number of new single-family homes for sale in the West remained near Febuary's ten-year low during March.
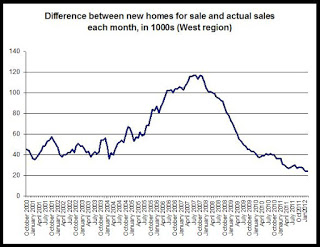
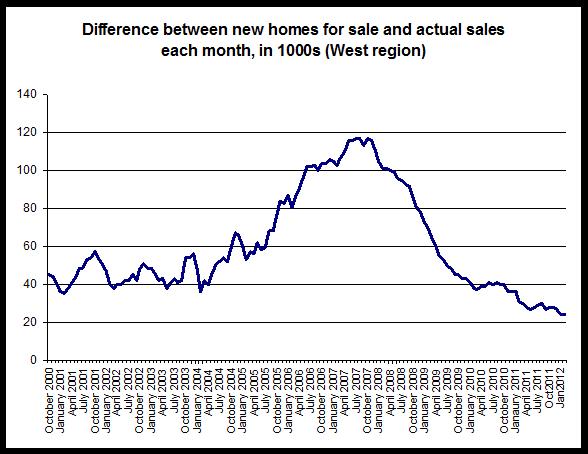
As a final note, we can also look to the new home inventory. In this case, we calculate inventory by subtracting the number of new home sales in a given month from the number of new homes for sale at the end of the previous month. In the final graph, we see that the inventory is now at a ten-year low of 24,000 homes. This is good news for owners seeking to sell homes since it suggests that fewer new homes are sitting and waiting to be sold, thus diminishing some of the inventory-driven downward pressure on prices.
 Overall,
this report shows that new home sales are not recovering quickly, and in spite of some mild rebounding in single-family permit activity (see here), new home activity is largely flat or declining and that totals are still near the same levels they
were during the 2008-2009 recession. Inventory of new homes continues to
decline which is good news for many people looking to see existing homes.
Overall,
this report shows that new home sales are not recovering quickly, and in spite of some mild rebounding in single-family permit activity (see here), new home activity is largely flat or declining and that totals are still near the same levels they
were during the 2008-2009 recession. Inventory of new homes continues to
decline which is good news for many people looking to see existing homes.
The report, which monitors sales activity for newly constructed houses, reported that in the West, new home sales were down 14 percent during March 2012 from the 7,000 new homes sold in March 2011. Nationwide, sales rose 14 percent, rising from 28,000 to 32,000 during the same period.
At 6,000 new home sales during March, sales are also down from February 2012's total of 8,000, signaling weakness in the regional homebuilding market going into the warmer spring season.
The first graph shows monthly new home sales totals for each month since 2003:
For the West region:
The second graph shows that new home sales continue to fall and have generally followed a downward trend since the middle of the decade.
New home sales peaked during the spring and summer of 2005 and have trended downward since. The number of new houses sold in the United States is down 80 percent since the peak of March 2005, and new home sales in the West have fallen 881 percent since sales peaked in the region during March 2004.
The third graph shows the declines in both US and regional totals in new homes for sale.
The number of new homes for sale has also fallen off considerably. The number of new houses for sale in the West has fallen 76 percent since the total peaked during June 2007, and the same total has fallen 74 percent in the US since the number of new homes for sale peaked in the US during August 2006.
The number of new single-family homes for sale in the West remained near Febuary's ten-year low during March.
As a final note, we can also look to the new home inventory. In this case, we calculate inventory by subtracting the number of new home sales in a given month from the number of new homes for sale at the end of the previous month. In the final graph, we see that the inventory is now at a ten-year low of 24,000 homes. This is good news for owners seeking to sell homes since it suggests that fewer new homes are sitting and waiting to be sold, thus diminishing some of the inventory-driven downward pressure on prices.
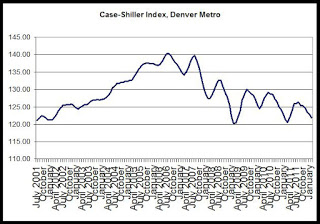
Denver Case-Shiller index up for second month in a row
Case-Shiller released its home price index for February
today. The home price index for the Denver area fell 0.9 percent
percent from January to February, but rose 0.5 percent, year over year,
from February 2011 to February 2012. The year-over-year increase in
February was the second year-over-year increase in a row for Denver, and
was the second increase overall since June 2010. The first graph shows
the index values since 2001:
According to S&P's press release, home prices are still facing headwinds:
In year-over-year comparisons for February, Atlanta showed the largest drop, with a decline of 17.3 percent, while the index in Las Vegas fell 8.5 percent. Year over year, home price indices fell in 15 of the 20 cities included in the study. Only Detroit, Denver, Minneapolis, Miami and Phoenix showed increases.
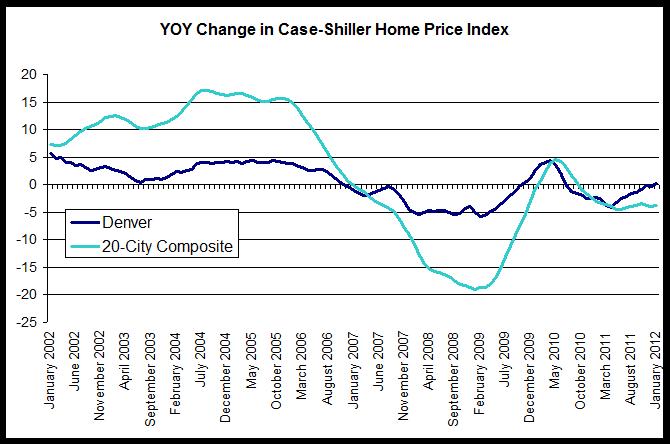
The second chart shows trends in the Case-Shiller index for the Denver area and for the 20-city composite index. It is clear that Denver did not experience the kind of price bubble that occurred in many other metropolitan areas, and consequently, the index has not fallen nearly as far in Denver compared to the larger composite. Prices have been largely flat since mid-2009.
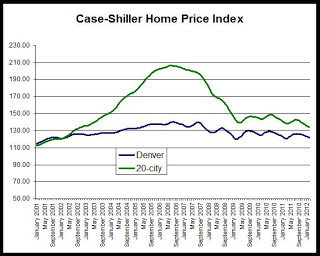
The 20-city composite is down 35 percent since it peaked in July 2006, but the Denver index is down only 13 percent from its August 2006 peak.
Although the Denver index turned positive in February compared to February of last year, the Denver index during February was at levels comparable to those found during 2002.
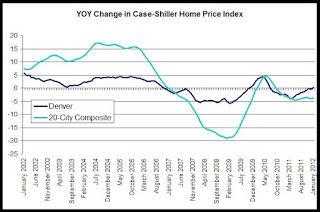
The third chart compares year-over-year changes in the Denver area index and in the 20-city composite. The Denver index did not achieve the rates of growth experienced by the national index, but the Denver index did not experience comparable rates of decline following the onset of the national recession either. Overall, the index has been less volatile in Denver than has been the case for the 20-city composite, and the rates of decline in Denver have been smaller in recent months. The year-over-year change in the 20-city composite during February was negative with a decrease of 3.5 percent while Denver reported a slight increase for the second month in a row. In the 20-city index, the year-over-year change has been negative for the past 17 months.
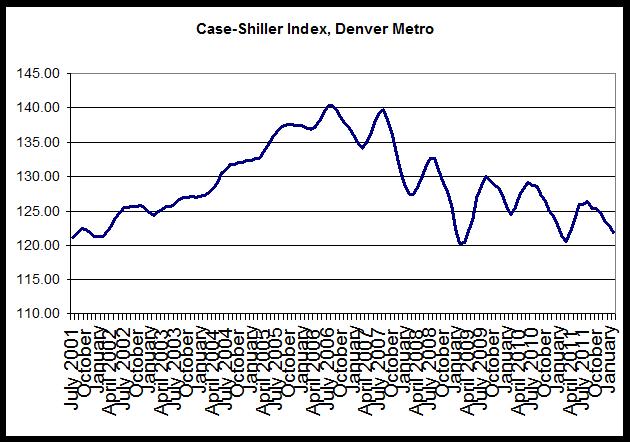
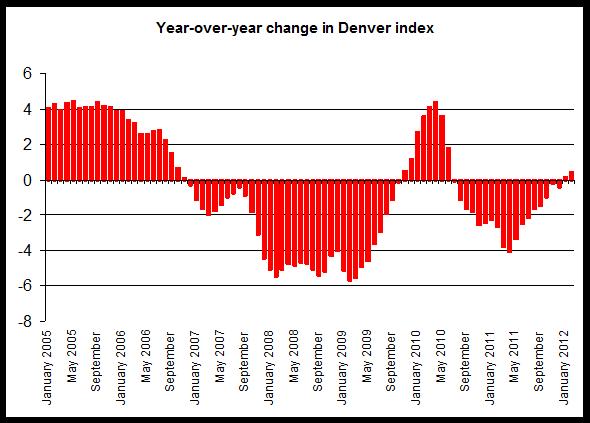
The last chart provides a closer look at year-over-year changes in the Denver index. Note the the change was below zero between June 2010 and December 2011, and likely reflects the end of the homebuyer tax credit’s end which has led to a fall in demand and a decline in the home price index. The upward trend in the index in response to the tax credit is clear during late 2009 and early 2010. Since the end of the credit, however, home prices consistently drifted downward until January 2012.

According to S&P's press release, home prices are still facing headwinds:
“While there might be pieces of good news in this report, such as some improvement in many annual rates of return, February 2012 data confirm that, broadly-speaking, home prices continued to decline in the early months of the year,” says David M. Blitzer, Chairman of the Index Committee at S&P Indices. “Nine MSAs -- Atlanta, Charlotte, Chicago, Cleveland, Las Vegas, New York, Portland, Seattle and Tampa -- and both Composites hit new post-crisis lows. Atlanta continued its downward spiral, posting its lowest annual rate of decline in the 20-year history of the index at -17.3%. The 10-City Composite declined 3.6% and the 20-City was down 3.5% compared to February 2011".
In year-over-year comparisons for February, Atlanta showed the largest drop, with a decline of 17.3 percent, while the index in Las Vegas fell 8.5 percent. Year over year, home price indices fell in 15 of the 20 cities included in the study. Only Detroit, Denver, Minneapolis, Miami and Phoenix showed increases.
The second chart shows trends in the Case-Shiller index for the Denver area and for the 20-city composite index. It is clear that Denver did not experience the kind of price bubble that occurred in many other metropolitan areas, and consequently, the index has not fallen nearly as far in Denver compared to the larger composite. Prices have been largely flat since mid-2009.
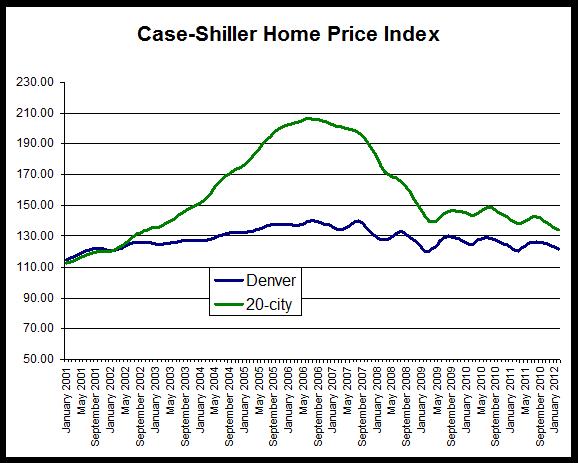
The 20-city composite is down 35 percent since it peaked in July 2006, but the Denver index is down only 13 percent from its August 2006 peak.
Although the Denver index turned positive in February compared to February of last year, the Denver index during February was at levels comparable to those found during 2002.
The third chart compares year-over-year changes in the Denver area index and in the 20-city composite. The Denver index did not achieve the rates of growth experienced by the national index, but the Denver index did not experience comparable rates of decline following the onset of the national recession either. Overall, the index has been less volatile in Denver than has been the case for the 20-city composite, and the rates of decline in Denver have been smaller in recent months. The year-over-year change in the 20-city composite during February was negative with a decrease of 3.5 percent while Denver reported a slight increase for the second month in a row. In the 20-city index, the year-over-year change has been negative for the past 17 months.
The last chart provides a closer look at year-over-year changes in the Denver index. Note the the change was below zero between June 2010 and December 2011, and likely reflects the end of the homebuyer tax credit’s end which has led to a fall in demand and a decline in the home price index. The upward trend in the index in response to the tax credit is clear during late 2009 and early 2010. Since the end of the credit, however, home prices consistently drifted downward until January 2012.
Comment period for new application instructions for grants and loans
The draft revised application instructions for grant
and loan applications to the Colorado Division of Housing have been posted. Due to the number of
formatting changes, the document is not blacklined to show changes from the 2010
version. The proposed revisions have been developed over the last several months
and do not take into account the proposed Colorado Housing Investment Fund
(CHIF). Some revisions will be necessary to account for DOH's administration of
the CHIF and will be made when the structure of the CHIF is finalized.
This document will be posted through May 11, 2012 for public
comment. Please send comments by email to [email protected]. In
particular, please note the following changes:
- Adjustments to cost ranges by project type;
- Clarification for determining to fund a loan verses a grant;
- Single Family Owner Occupied (SFOO) rehabilitation program applications due July 1st;
- Community Housing Development Organization (CHDO) operating grants due September 1st;
- Downpayment Assistance Program (DPA) applications due November 1st; and
- Clarification regarding legal residency requirements.
Tuesday, April 24, 2012
Housing News Digest, April 24
In Colorado, Grand Junction Fares Better than Most for Affordable Housing
GRAND JUNCTION, Colo.- New census figures reveal low-income households outnumber affordable rental units in Colorado. However, Grand Junction fares better than most cities.
Report: Low-income Coloradans Priced Out of Rentals People with the lowest incomes in Colorado are being priced out of rental properties, according to a report issued Monday by the Colorado Division of Housing. "Rental housing in general since 2009 has become more scarce for many households as vacancies fall and rents rise," said Ryan McMaken, a spokesman for the Division of Housing. The report said that among households with the lowest incomes, there are twice as many households as there are affordable rental units in Colorado.
Report: Fort Collins-Loveland residents spend more of incomes on housing "It seems like the grocery stores are getting more expensive, rents are going up ... it's getting to be a whirlwind and a downward spiral." What the numbers say Colorado officials say census data collected from 2006 to 2010 show the number of low-income households outnumbered the affordable rental units in the state.
Boulder County toughest rental market BOULDER - Boulder County is the toughest market in Colorado for low-income families in need of affordable rental units, and it has the highest percentage of "rent-burdened" households in the state, according to a report released Monday by the Colorado Division of Housing. The study, which relies on U.S. Census Bureau data collected from 2006 to 2010, is a comprehensive overview of the availability and affordability of rental units in Colorado. The division conducts the survey in order to determine the state of the market and where it should allocate its resources, spokesman Ryan McMaken said.
Real estate development: a mixed bag A recent report from Beacon Hill Institute ranks Colorado as the third-most economically competitive state. We continue to see decreasing unemployment, positive job growth, and a new sense of optimism from business owners and consumers - all pointing to an improving regional economy. The Governor’s Office of State Planning and Budgeting in March announced that the state general fund revenue is projected to be $164.5 million higher in the next fiscal year than was originally forecasted, due to continued improvement in the job market and increased confidence among households and businesses.
Maybe no housing rebound for a generation: Shiller The Housing market is likely to remain weak and may take a generation or more to rebound, Yale economics professor Robert Shiller told Reuters Insider on Tuesday. Shiller, the co-creator of the Standard & Poor's/Case-Shiller home price index, said a weak labor market, high gas prices and a general sense of unease among consumers was outweighing low mortgage rates and would likely keep a lid on prices for the foreseeable future
Monday, April 23, 2012
Housing News Digest, April 23
Report: Low-income Coloradans priced out of rentals (Denver Post)
The report said that among households with the lowest incomes, there are twice as many households as there are affordable rentals units in Colorado. The report said there are 50 rental units affordable to every 100 renter households that earn less than $20,000 . The report assumes that households earning $20,000 can afford a monthly rent payment of $500 , or 30 percent of monthly income.
Low-income households outnumber affordable housing units (NCBR)
Twice as many low-income households exist in Colorado as there are affordable rental units, according to data released Monday by the Colorado Division of Housing. There are 50 affordable units available for every 100 renter households earning less than $20,000 per year. This annual income suggests that the renter would be able to afford a monthly rent payment of $500, or 30 percent of monthly income.
Colorado low-income families outnumber affordable rentals 2-1 (DBJ)
The shortage is even more acute in the Denver area, where there are 39 units affordable for each 100 households earning $20,000 or less, the Division of Housing report says. The statewide shortage also increases for families earning less than $15,000 a year.
Effect of camping bans debated as Denver considers ordinance
Denver has spent nearly $60 million in the past seven years to end homelessness. Yet even with that massive effort, there are increasing numbers of people on the street. That dynamic is what led city officials to consider joining the ranks of many cities across the United States that have banned camping — and ignited the vigorous debate over whether such a move "criminalizes" homelessness.
Rent burdened households rise (Inside Real Estate News) There are twice as many extremely low-income households in Colorado as there are affordable rental units for them, according to the report released by the Colorado Division of Housing.
There are 100 renter households for every 50 affordable rental units for households that earn less than $20,000, according to the report. The report assumes that households earning $20,000 can afford a monthly rent payment of $500, or 30 percent of monthly income.
Low-income households outnumber affordable rental units in Colorado
Among households with the lowest incomes, there are twice as many households as there are affordable rental units in Colorado. According to a report released today by the Colorado Division of Housing, there are 50 rental units affordable to every 100 renter households that earn less than $20,000. The report assumes that households earning $20,000 can afford a monthly rent payment of $500, or 30 percent of monthly income.
The report, which is based on Census Bureau data collected from 2006 to 2010, stated that there are 45 affordable rental units for every 100 households earning less than $15,000 per year, and 55 units for every 100 households at an income level below $10,000. For households at the $35,000 income level, there are 107 rental units affordable to every 100 households.
In the report, units are deemed affordable if the household pays no more than 30 percent of monthly income to rent. Households that pay more than 30 percent of income for housing are described as “rent burdened.”
“Rental housing in general since 2009 has become more scarce for many households as vacancies fall and rents rise,” said Ryan McMaken a spokesman for the Colorado Division of Housing. “But when one is at the lowest income levels, the impact of growing demand for rentals can be especially severe as once-affordable units are priced out of range.”
At all income levels, there were approximately 298,200 rent burdened households in Colorado, which is equal to 48 percent of all renter households. 50 percent of all rent burdened households are at income levels below $20,000 per year.
The report also noted that in Colorado there are “243,000 households (39 percent of all renter households) paying 35 percent or more of income toward housing. Approximately 150,000 households (24 percent of all renter households) pay 50 percent or more of income toward housing.”
The availability of affordable rental units varied across the state. In the metro Denver area, there were 43 units affordable to every 100 households earning less than $10,000, and 39 units affordable for each 100 households earning less than $20,000. Affordable rentals were more accessible in the Grand Junction area where there were 77 units affordable to every 100 households earning less than $10,000, and 61 units affordable to every 100 households earning less than $20,000.
For households earning $35,000 in all areas except the Boulder area, there were at least 100 units affordable to every 100 households. In the Boulder area there were 78 units for households earning $35,000.
The areas with the largest percentages of rent burdened households were the Boulder area and the Fort Collins-Loveland area where 56 percent and 54 percent of households were rent burdened, respectively. The areas with the smallest percentages of rent burdened households were the Colorado Springs and Grand Junction areas where the proportion of households that were rent burdened was 47 percent and 43 percent, respectively.
Monday’s report is an update of 2011’s housing need report released by the Division of Housing last summer.
“Comparing this year’s report to last year’s we can see that the need increased somewhat during that time” McMaken said. “That’s not surprising because in recent years we’ve seen the homeownership rate drop and rents increase. That squeezes the renters at the lowest income levels.”
Friday, April 20, 2012
Take the survey on the State's contracting process
As a part of Governor Hickenlooper's LEANing government effort, the Department of Local Affairs (DOLA) is seeking input on our contracting process.
Please help DOLA, Division of Housing understand our customers' perspectives by completing the online survey below. We want to improve our contracting process with your input, and we greatly appreciate your time in responding to this survey.
Customer Survey
http://www.zoomerang.com/Survey/WEB22FENK6FPKP
Colorado 31st in nation for unemployment during March
The Bureau of Labor Statistics last week released employment information on all states for March 2012.
According to the BLS press release:
Colorado was not among the 18 states that reported statistically significant decreases in the unemployment rate, year over year. 19 states reported unemployment rates that were higher than Colorado's, including California, Nevada, Florida and Michigan.
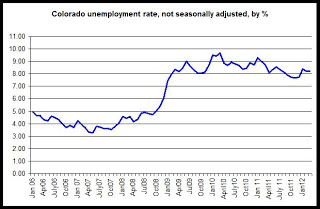
Colorado's unemployment rate remains below that of the nation overall, continuing a trend that has been in place since 2005. Earlier comparisons of Colorado and national unemployment rates had shown Colorado above the national rate during early 2011, but data revised in early 2012 shows that Colorado has not edged above the national rate in almost seven years.
The graph shows a comparison between the two rates since 2006:
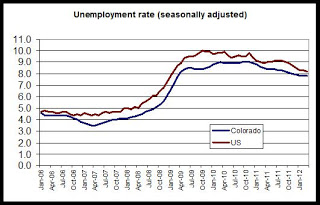
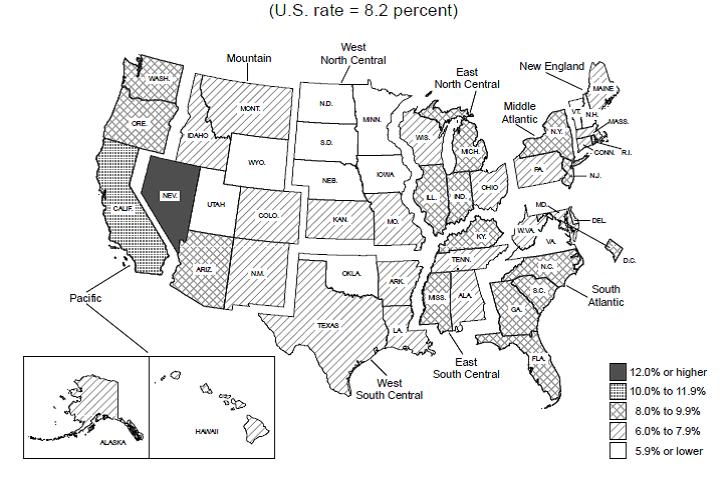
The unemployment rate in Colorado, seasonally adjusted, has been flat at 7.8 percent since January. The national rate fell to 8.2 percent.
The BLS map below shows state-by-state comparisons.
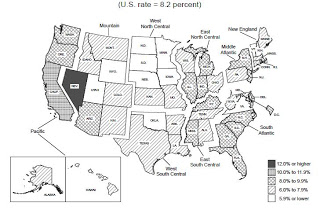
Within the Rocky Mountain region, Colorado has the third highest unemployment rate:
Arizona, 8.6%
Colorado, 7.8%
Idaho, 7.9%
Montana, 6.2%
New Mexico, 7.2%
Utah, 5.8%
Wyoming, 5.3%
Colorado remains in the middle of the pack when it comes to statewide unemployment rates, but has seen its rate rise above more states in recent months. At the regional level, however, Colorado contains some metro areas that have unemployment rate well below the national rate, such as the Boulder area and the Fort Collins area.
According to the BLS press release:
Regional and state unemployment rates were little changed in March. Thirty states recorded unemployment rate decreases, 8 states posted rate increases, and 12 states and the District of Columbia had no change, the U.S. Bureau of Labor Statistics reported today. Forty-nine states and the District of Columbia registered unemployment rate decreases from a year earlier, while New York experienced an increase. The national jobless rate was little changed from February at 8.2 percent but was 0.7 percentage point lower than in March 2011.
Colorado was not among the 18 states that reported statistically significant decreases in the unemployment rate, year over year. 19 states reported unemployment rates that were higher than Colorado's, including California, Nevada, Florida and Michigan.
Colorado's unemployment rate remains below that of the nation overall, continuing a trend that has been in place since 2005. Earlier comparisons of Colorado and national unemployment rates had shown Colorado above the national rate during early 2011, but data revised in early 2012 shows that Colorado has not edged above the national rate in almost seven years.
The graph shows a comparison between the two rates since 2006:

The unemployment rate in Colorado, seasonally adjusted, has been flat at 7.8 percent since January. The national rate fell to 8.2 percent.
The BLS map below shows state-by-state comparisons.
Within the Rocky Mountain region, Colorado has the third highest unemployment rate:
Arizona, 8.6%
Colorado, 7.8%
Idaho, 7.9%
Montana, 6.2%
New Mexico, 7.2%
Utah, 5.8%
Wyoming, 5.3%
Colorado remains in the middle of the pack when it comes to statewide unemployment rates, but has seen its rate rise above more states in recent months. At the regional level, however, Colorado contains some metro areas that have unemployment rate well below the national rate, such as the Boulder area and the Fort Collins area.
Unemployment increases year over year in Colo. Springs, Grand Junct., and Pueblo
Total employment growth in Colorado in February continued to show growth statewide in the year-over-year comparisons. In March, total employment in Colorado was down 139,000 from the July 2008 peak. Employment trends in various regions of the state differ, however, so this article looks at which regions of the state have the highest unemployment rates, and which regions have recovered the most in their labor markets.
Regional employment trends can also provide us with some insights into local housing demand since, all things being equal, those areas with the most robust labor demand will also have the strongest demand for housing. This would be reflected in apartment vacancy rates and in median home price and home sales transactions, among other indicators.
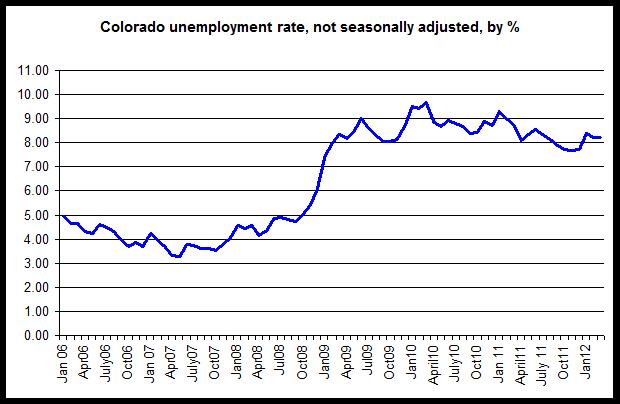
The first graph compares unemployment rates in Colorado's metro areas.
The regional unemployment rates (not seasonally adjusted) for March 2012 are:
Colorado Springs, 9.5%
Denver-Aurora, 8.2%
Fort Collins-Loveland, 6.7%
Grand Junction, 9.5%
Greeley, 9.2%
Pueblo, 10.7%
Statewide, 8.2%
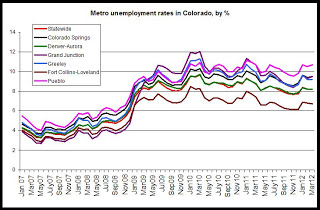
Since mid-2009, The Fort Collins-Loveland area has consistently shown one of the lowest unemployment rates while Grand Junction and Pueblo have generally shown the highest rates. during recent months,however, the unemployment rate in Grand Junction has fallen to the point where Greeley, Grand Junction, and Colorado Springs now all have similar unemployment rates near 9.5 percent.
Year over year, the unemployment rate increased in Colorado Springs, Grand Junction and Pueblo. Total employment declined year over year in both Colorado Springs and Grand Junction, pushin gup the unemployment rate while it was an increase in teh labor force size that pushed up the unemployment rate in Pueblo. The unemployment rate was flat, year over year, in Denver-Aurora, Greeley, and Ft. Collins-Loveland.
The unemployment rate is a reflection of both the total number of employed persons and the total size of the labor force (as reflected in the Household Survey), so the unemployment rate can increase even in times of rising total employment if the size of the labor force increases as well.
To provide some additional context, we can look to see how far below total employment levels are below the most recent peak in employment in each region. The peak time differs in each region. For example, the labor market peaked in mid-2007 in the Colorado Springs area, but it did not peak until late 2008 in the Grand Junction area.
The following numbers reflect how far below the most recent peak are the February 2012 employment totals:
Colorado Springs MSA, 8.3%
Denver-Aurora MSA, 5.1%
Fort Collins-Loveland MSA, 4.7%
Grand Junction MSA, 11.7%
Greeley MSA 4.5%
Pueblo MSA, 3.6%
Statewide, 5.1%
All things being equal, the areas further below the peak have recovered the least from initial job losses.
By far, Grand Junction remains the furthest below peak levels.
The Pueblo area, the Greeley area, and the Ft. Collins-Loveland areas are nearest to peak levels, although both Pueblo and Greeley still report unemployment rates above 9 percent.
(Note: If we include the Boulder-Longmont MSA, we find that the Boulder area has consistently been among the areas with the lowest unemployment rate. In March 2012, the rate in the Boulder-Longmont area was 6.1%, and was down year over year.)
Regional employment trends can also provide us with some insights into local housing demand since, all things being equal, those areas with the most robust labor demand will also have the strongest demand for housing. This would be reflected in apartment vacancy rates and in median home price and home sales transactions, among other indicators.
The first graph compares unemployment rates in Colorado's metro areas.
The regional unemployment rates (not seasonally adjusted) for March 2012 are:
Colorado Springs, 9.5%
Denver-Aurora, 8.2%
Fort Collins-Loveland, 6.7%
Grand Junction, 9.5%
Greeley, 9.2%
Pueblo, 10.7%
Statewide, 8.2%

Since mid-2009, The Fort Collins-Loveland area has consistently shown one of the lowest unemployment rates while Grand Junction and Pueblo have generally shown the highest rates. during recent months,however, the unemployment rate in Grand Junction has fallen to the point where Greeley, Grand Junction, and Colorado Springs now all have similar unemployment rates near 9.5 percent.
Year over year, the unemployment rate increased in Colorado Springs, Grand Junction and Pueblo. Total employment declined year over year in both Colorado Springs and Grand Junction, pushin gup the unemployment rate while it was an increase in teh labor force size that pushed up the unemployment rate in Pueblo. The unemployment rate was flat, year over year, in Denver-Aurora, Greeley, and Ft. Collins-Loveland.
The unemployment rate is a reflection of both the total number of employed persons and the total size of the labor force (as reflected in the Household Survey), so the unemployment rate can increase even in times of rising total employment if the size of the labor force increases as well.
To provide some additional context, we can look to see how far below total employment levels are below the most recent peak in employment in each region. The peak time differs in each region. For example, the labor market peaked in mid-2007 in the Colorado Springs area, but it did not peak until late 2008 in the Grand Junction area.
The following numbers reflect how far below the most recent peak are the February 2012 employment totals:
Colorado Springs MSA, 8.3%
Denver-Aurora MSA, 5.1%
Fort Collins-Loveland MSA, 4.7%
Grand Junction MSA, 11.7%
Greeley MSA 4.5%
Pueblo MSA, 3.6%
Statewide, 5.1%
All things being equal, the areas further below the peak have recovered the least from initial job losses.
By far, Grand Junction remains the furthest below peak levels.
The Pueblo area, the Greeley area, and the Ft. Collins-Loveland areas are nearest to peak levels, although both Pueblo and Greeley still report unemployment rates above 9 percent.
(Note: If we include the Boulder-Longmont MSA, we find that the Boulder area has consistently been among the areas with the lowest unemployment rate. In March 2012, the rate in the Boulder-Longmont area was 6.1%, and was down year over year.)
Colorado adds more jobs in March
Colorado gained 29,882 jobs in March 2012 compared to March of 2011, and the non-seasonally-adjusted unemployment rate fell year-over-year from 8.7 percent to 8.2 percent. According to the most recent employment data, collected through the Household Survey and released today by the Colorado Department of Labor and Employment and the BLS, total employment in March, not seasonally adjusted, rose to 2.49 million jobs. The labor force also increased from March 2011 to March 2012.
In month-to-month comparisons, the unemployment rate was flat at 8.2 percent from February to March. 4,000 jobs were added month-over-month while 4,500 people entered the work force.
From March 2011 to March 2012, total employment rose 1.2 percent while the labor force rose 0.6 percent. The total labor force in March included 2.72 million workers.
As can be seen in the second graph, total employment and total workforce size have risen slightly, month-over-month, for the past two months after falling for the previous three months. Year over year, employment rose and the labor force rose. However, both remain well below July 2008 peaks.
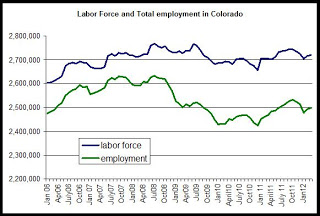
The employment total is now 135,000 jobs below the peak levels experienced during July 2008 when there were 2.63 million employed workers. Compared to the labor force peak in July 2008, the labor force is now down by almost 47,000 workers.
In the third graph is shown the year-over-year comparisons, by percent, for total employment. March 2012 was the 15th month in a row showing a positive year-over-year change in total employment. The 15 months of increases followed 28 months in a row of negative job growth in year-over-year comparisons.
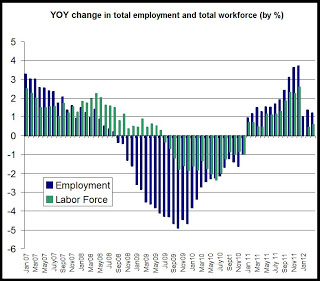
The graph also shows the year-over-change in the labor force. Total labor force size rose slightly from March 2011 to March 2012 for the second month in a row, and follows a slight decrease that occurred from January 2011 to January 2012. The labor force size had shrunk, year over year, for 18 months in a row from July 2009 to December 2010.
These numbers come from the Household Survey employment data, so the size of the workforce is dependent on the number of people stating that they are actively looking for work if not employed. Discouraged workers who have stopped looking for work are excluded. On the other hand, the Household Survey picks up on small business and start-up employment that may be missed by the Establishment Survey, the other commonly-used measure of employment.
Note: This analysis reflects newly revised data released in January. In most cases, total employment was revised upward for the months of 2011.
In month-to-month comparisons, the unemployment rate was flat at 8.2 percent from February to March. 4,000 jobs were added month-over-month while 4,500 people entered the work force.
From March 2011 to March 2012, total employment rose 1.2 percent while the labor force rose 0.6 percent. The total labor force in March included 2.72 million workers.
As can be seen in the second graph, total employment and total workforce size have risen slightly, month-over-month, for the past two months after falling for the previous three months. Year over year, employment rose and the labor force rose. However, both remain well below July 2008 peaks.
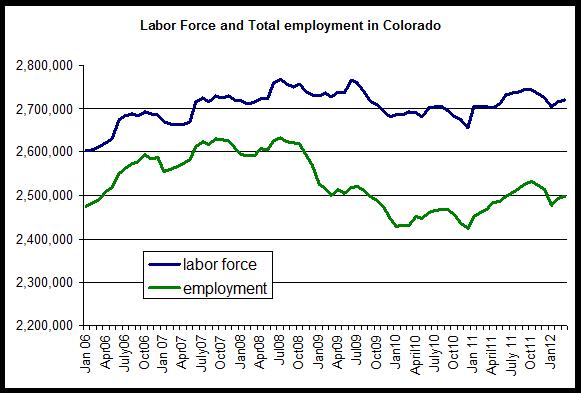
The employment total is now 135,000 jobs below the peak levels experienced during July 2008 when there were 2.63 million employed workers. Compared to the labor force peak in July 2008, the labor force is now down by almost 47,000 workers.
In the third graph is shown the year-over-year comparisons, by percent, for total employment. March 2012 was the 15th month in a row showing a positive year-over-year change in total employment. The 15 months of increases followed 28 months in a row of negative job growth in year-over-year comparisons.
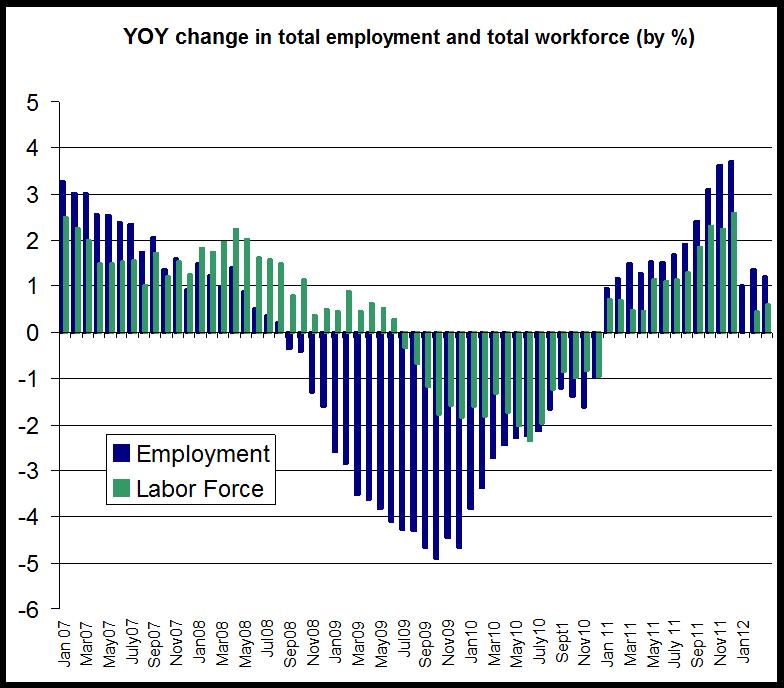
The graph also shows the year-over-change in the labor force. Total labor force size rose slightly from March 2011 to March 2012 for the second month in a row, and follows a slight decrease that occurred from January 2011 to January 2012. The labor force size had shrunk, year over year, for 18 months in a row from July 2009 to December 2010.
These numbers come from the Household Survey employment data, so the size of the workforce is dependent on the number of people stating that they are actively looking for work if not employed. Discouraged workers who have stopped looking for work are excluded. On the other hand, the Household Survey picks up on small business and start-up employment that may be missed by the Establishment Survey, the other commonly-used measure of employment.
Note: This analysis reflects newly revised data released in January. In most cases, total employment was revised upward for the months of 2011.
Colo. Realtors: Median home prices down in February
Median home prices for single-family homes during February 2012 fell in Colorado and in the Pikes Peak region and in the metro Denver area. According to median home price data for February, released by the Colorado Association of Realtors, the median home price for single-family homes in the Denver area was $219,760 during February, which is an decrease of 1 percent from February of 2011. Statewide, the median home price was $183,333 during February, a drop of 5 percent from the same month last year. The median price in the Pikes Peak region fell 9 percent, year over year, falling to $177,234 during February.
The first graph shows the median single-family home price for the state and for the metro Denver and Pikes Peak regions. Median home prices fell dramatically in all three measures following the financial crisis of late 2008, but moved back up quickly by mid-2009. Since mid-2009, however, median home prices have been largely flat in metro Denver. In the Pikes Peak region, on the other hand, the median price remains well below peak levels and was lower during most months of 2011 when compared to 2010. Statewide, as is typical, the median price has been more volatile, but has not recovered as much as the metro Denver median. Statewide, declining prices in western Colorado are a factor in statewide price declines.
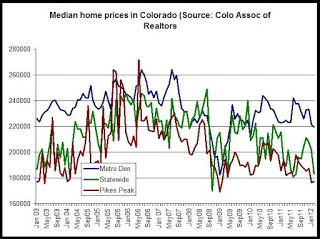
The metro Denver area, where the median price is 17 percent below its June 2007 peak levels, has recovered the most. Metro Denver prices appear to have stabilized since 2009 and the median price generally moves between 220K and 240K. The statewide median price is now 25 percent below its June 2006 peak. The Pikes Peak median price fell in January to 23 percent below its July 07 peak, falling below 180K. The Pikes Peak area's median price ranged between 181K and 197K during 2011.
The second graph shows that the year-over-year changes in all three areas have been generally negative each month for the past six months, and all three areas were down during both January and February 2012 when compared to the same month a year earlier.
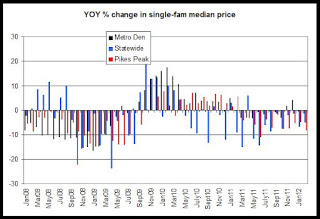
While the overall trend over the past six months has been downward in the year-to-year comparisons, January did begin to show some small price increases in both the Case-Shiller metro Denver report while the CoreLogic February report for Colorado showed an increase in the price index as well. See here for more.
The home price data provided by the Colorado Association of Realtors is based on home sales transactions that are listed in the MLS systems for each area and do not include for-sale-by-owner transactions or new homes sold directly by home builders.
The first graph shows the median single-family home price for the state and for the metro Denver and Pikes Peak regions. Median home prices fell dramatically in all three measures following the financial crisis of late 2008, but moved back up quickly by mid-2009. Since mid-2009, however, median home prices have been largely flat in metro Denver. In the Pikes Peak region, on the other hand, the median price remains well below peak levels and was lower during most months of 2011 when compared to 2010. Statewide, as is typical, the median price has been more volatile, but has not recovered as much as the metro Denver median. Statewide, declining prices in western Colorado are a factor in statewide price declines.
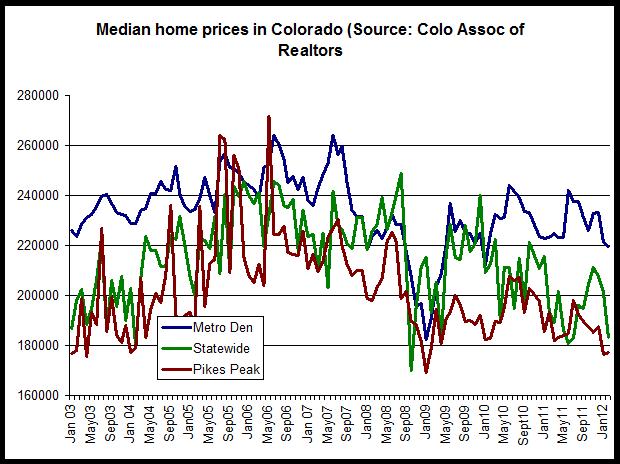
The metro Denver area, where the median price is 17 percent below its June 2007 peak levels, has recovered the most. Metro Denver prices appear to have stabilized since 2009 and the median price generally moves between 220K and 240K. The statewide median price is now 25 percent below its June 2006 peak. The Pikes Peak median price fell in January to 23 percent below its July 07 peak, falling below 180K. The Pikes Peak area's median price ranged between 181K and 197K during 2011.
The second graph shows that the year-over-year changes in all three areas have been generally negative each month for the past six months, and all three areas were down during both January and February 2012 when compared to the same month a year earlier.
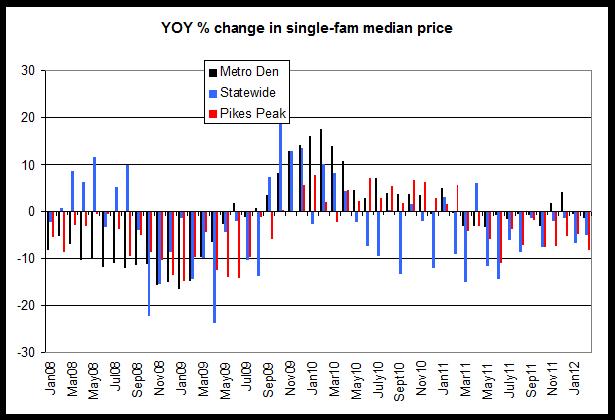
While the overall trend over the past six months has been downward in the year-to-year comparisons, January did begin to show some small price increases in both the Case-Shiller metro Denver report while the CoreLogic February report for Colorado showed an increase in the price index as well. See here for more.
The home price data provided by the Colorado Association of Realtors is based on home sales transactions that are listed in the MLS systems for each area and do not include for-sale-by-owner transactions or new homes sold directly by home builders.
Thursday, April 19, 2012
After four quarters of declining mortgage rates, releases surge
Today, the Division of Housing released its first-quarter 2012 report on releases of deeds of trust. Since release activity reflects trends in home purchase and refinance activity they can help us identify some trends in demand for home loans.
The report notes that, in general, release activity responds to movements in the mortgage rate in ways very similar to that seen in mortgage refinance activity.
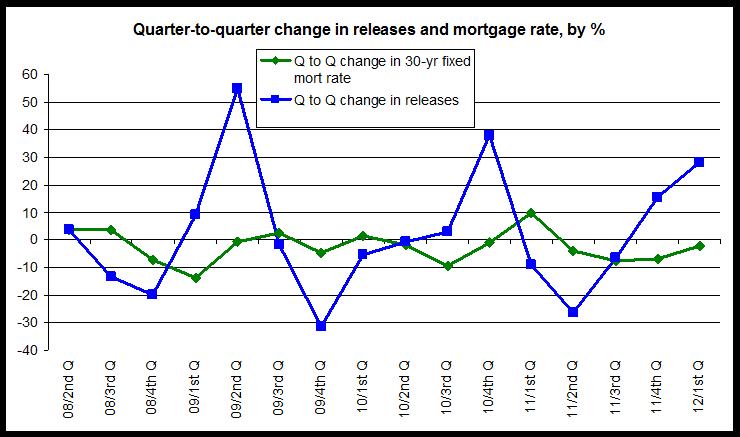
The first graph shows the quarter-to-quarter changes in the 30-yr fixed mortgage rate and in the number of releases. The quarterly data goes back to 2008. Release activity tends to move in the opposite direction of trends in the mortgage rate. In general, the blue line will move above zero following a period in which the green line is below zero. So, after growth in the mortgage rate turned negative during the 4th q of 2008, release activity moved above zero, topping out at a growth rate of more than 50 percent. In other words, a dip in the mortgage rate produced a surge in release activity. A similar phenomenon can then be seen again following the third quarter of 2010, and then again following the third quarter of 2011. Note, however, that the increase in release activity gets smaller after each period of declining mortgage rates. The effect of pushing down the mortgage rate appears to be diminishing when it comes to release activity.
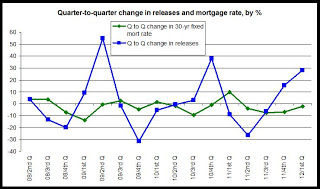
During the first quarter of 2012, however, following four quarters in a row of declining mortgage rates, we get a substantial increase in the number of releases - a 28 percent increase form the fourth quarter of 2011.
See here for analysis of releases and mortgage rates going back to the year 2000.
Although the relationship between mortgage rates and releases has weakened in recent years due to tightening of credit and a lack of consumer confidence, the relationship does appear to still be holding.
The report notes that, in general, release activity responds to movements in the mortgage rate in ways very similar to that seen in mortgage refinance activity.
The first graph shows the quarter-to-quarter changes in the 30-yr fixed mortgage rate and in the number of releases. The quarterly data goes back to 2008. Release activity tends to move in the opposite direction of trends in the mortgage rate. In general, the blue line will move above zero following a period in which the green line is below zero. So, after growth in the mortgage rate turned negative during the 4th q of 2008, release activity moved above zero, topping out at a growth rate of more than 50 percent. In other words, a dip in the mortgage rate produced a surge in release activity. A similar phenomenon can then be seen again following the third quarter of 2010, and then again following the third quarter of 2011. Note, however, that the increase in release activity gets smaller after each period of declining mortgage rates. The effect of pushing down the mortgage rate appears to be diminishing when it comes to release activity.
During the first quarter of 2012, however, following four quarters in a row of declining mortgage rates, we get a substantial increase in the number of releases - a 28 percent increase form the fourth quarter of 2011.
See here for analysis of releases and mortgage rates going back to the year 2000.
Although the relationship between mortgage rates and releases has weakened in recent years due to tightening of credit and a lack of consumer confidence, the relationship does appear to still be holding.
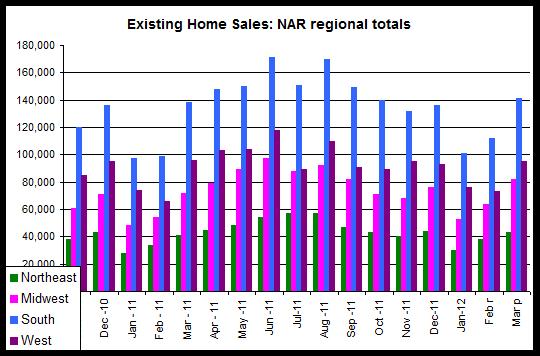
NAR: Home sales down in U.S. West, but prices up
The median home price in the West region of the U.S., which includes Colorado, rose 1.6 percent from March 2011 to March 2012. According to new existing home sales data, released today by the National Association of Realtors, the median home price rose nationally and in all regions except the Northeast region where the median price fell 1.9 percent.
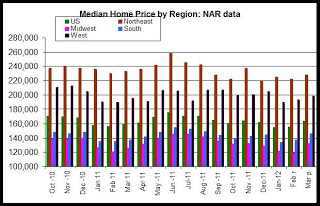
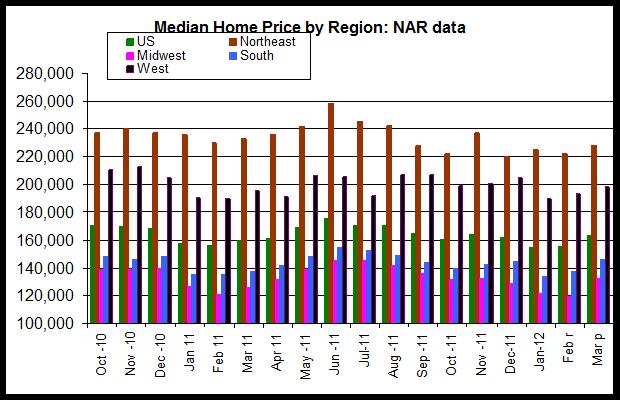
The first graph shows median home prices for all regions plus the U.S. The median home price in the West rose to $198,300. Nationally, the median home price rose to $163,800. In the West, and nationally, median home prices remains well below the prices reached during 2010 when the homebuyer tax credits were in place. The most recent peak for the median home price in the West was $224,100 reached during July of 2010.
Nationally, home prices rose 2.5 percent, year over year.
According to today's report, home sales transactions (closings) fell 1.0 percent, from March 2011 to March 2012, in the West region while nationally, sales rose 4.0 percent during the same period. All regions reported year-over-year increases in sales activity except the West region. The largest increase was reported in the Northeast where sales rose 13.9 percent.
The second graph shows closings by region. All regions showed a month-over-month increase from February to March, which is common due to seasonality. Sales rose nationally 25.8 percent from February to March, while sales in the West fell 1.0 percent.
Overall, March's sales activity was higher than was the case during March of last year.

In short, home sales have increased in most of the country when compared year over year, and median home prices have begun to move up. Although the region-wide data from NAR showed a small decline in home sales transactions,Colorado data shows growth in home sales activity in recent months. Recent data on releases of deeds of trust also suggests more sales and refinance activity. More transactions are taking place, and the most recent home price data from sources other than the Realtors, such as FHFA and Case-Shiller, also suggest some mild increases in home prices during the first quarter of 2012.
The first graph shows median home prices for all regions plus the U.S. The median home price in the West rose to $198,300. Nationally, the median home price rose to $163,800. In the West, and nationally, median home prices remains well below the prices reached during 2010 when the homebuyer tax credits were in place. The most recent peak for the median home price in the West was $224,100 reached during July of 2010.
Nationally, home prices rose 2.5 percent, year over year.
According to today's report, home sales transactions (closings) fell 1.0 percent, from March 2011 to March 2012, in the West region while nationally, sales rose 4.0 percent during the same period. All regions reported year-over-year increases in sales activity except the West region. The largest increase was reported in the Northeast where sales rose 13.9 percent.
The second graph shows closings by region. All regions showed a month-over-month increase from February to March, which is common due to seasonality. Sales rose nationally 25.8 percent from February to March, while sales in the West fell 1.0 percent.
Overall, March's sales activity was higher than was the case during March of last year.
In short, home sales have increased in most of the country when compared year over year, and median home prices have begun to move up. Although the region-wide data from NAR showed a small decline in home sales transactions,Colorado data shows growth in home sales activity in recent months. Recent data on releases of deeds of trust also suggests more sales and refinance activity. More transactions are taking place, and the most recent home price data from sources other than the Realtors, such as FHFA and Case-Shiller, also suggest some mild increases in home prices during the first quarter of 2012.
Housing News Digest, April 19
Colorado home purchase and refinance activity up as rates fall
The number of mortgage loans paid off in Colorado was up 2.4 percent during 2012's first quarter compared to the same period of last year, and they rose 28.2 percent from the fourth quarter of last year to the first quarter of this year, the Colorado Division of Housing said today.
According to the report, public trustees in Colorado released a total of 74,808 deeds of trust during the first quarter of 2012, indicating a sizable increase in the amount of home purchase and refinance activity since late 2011.
Colorado sees 'sizable increase' in homebuying, refis in Q1
Colorado saw a "sizable increase" in home purchases and refinacing in the first quarter following months of sinking mortgage rates, according to a report Thursday from the Colorado Division of Housing.
The quarterly report tracks releases of deeds of trust as an indicator of financed home purchase and refinance activity in the state. Deeds of trust usually are released when a home is refinanced or sold or when a home loan is paid off.
Denver housing market second in nation for quick sales
New advice from the trenches on buying a home: Look early. Think fast. Hone your quick-draw skills with the checkbook.
Metro Denver's real estate market, not long ago a buyer's domain, suddenly has shifted to a seller's paradise, at least in some neighborhoods and price ranges.
U.S. home sales fall in March after earlier gains
WASHINGTON — Americans bought fewer previously owned homes in March, a reminder that the housing market remains weak.
The National Association of Realtors said Thursday that home sales fell 2.6 percent last month to a seasonally adjusted annual rate of 4.48 million. That followed a revised 4.6 million sold in February.
Releases of deeds of trust up statewide, regionally
Releases of deeds of trust in Colorado increased 2.4 percent year-over-year in the first quarter from 73,025 to 74,808, indicating economic improvement.
Releases were also up year-over-year in both Larimer and Weld Counties, according to the most recent data provided by the Colorado Division of Housing.
The Largest Ranch Near Aspen Just Hit The Market For $41 Million
In the posh Colorado resort area of Aspen, one-upmanship is the name of the game when it comes to luxury real estate. Now Christie’s International Real Estate affiliate Joshua & Co. has listed the largest ranch currently available for sale in the region for $41 million.
The property, known as the Child Capitol Creek Ranch, features 1,321 acres of stunning land set against the dramatic backdrop of Haystack Mountain adjacent to chic Snowmass
Releases of deeds of trust up 28 percent during the first quarter
The number of mortgage loans paid off in Colorado was up 2.4 percent during 2012’s first quarter compared to the same period of last year, and they rose 28.2 percent from the fourth quarter of last year to the first quarter of this year. According to a new report released today by the Colorado Division of Housing, public trustees in Colorado released a total of 74,808 deeds of trust during the first quarter of 2012, indicating a sizable increase in the amount of home purchase and refinance activity since late 2011. Typically, a release of a deed of trust occurs when a real estate loan is paid off whether through refinance, sale of property or because the owner has made the final payment on the loan. Release activity rises as refinance and home-sale activity increases.
During the first quarter, the number of deeds of trust released this year rose over 2011’s first-quarter total of 73,025, and it was up from 2011’s fourth quarter total of 58,340. Release activity rose to a five-quarter high during the first quarter and was at the largest total recorded for any first quarter since the Division of Housing began tracking quarterly release totals during 2008.
“Release totals are up quite a bit since the middle of 2011, and this is not surprising since mortgage rates have continued to drop in recent months and home-purchase activity has begun to pick up,” said Ryan McMaken, spokesman for the Colorado Division of Housing. “Numbers are still down significantly from where they were ten years ago, but the first quarter seems to be one of the most active quarters for home loan transactions since 2008.”
According to the report, the number of deeds of trust released during the first quarter was the fourth-highest total recorded in any quarter of the past four years. The 28-percent increase in release activity since last year’s fourth quarter follows three quarters of falling mortgage rates and several months of increasing home purchase activity in Colorado.
Trends in release activity varied by county, however. From the first quarter of 2011 to the same period this year, release totals fell in ten of 21 counties surveyed. The largest year-over-year decline was found in Delta County where releases fell by 24 percent, and the largest increase was found in Eagle County where releases rose 26 percent. Release activity, when adjusted for each county’s population, tended to be the highest in mountain counties and in more affluent counties. The counties with the highest rates of release activity were Summit and Douglas counties, while Pueblo and Delta counties reported the lowest rates.
“Those counties with some of the most desirable real estate are often going to be places with the most release activity since you have more interested buyers, and it’s easier to refinance or sell if your property is in demand,” McMaken said. “Counties with mountain real estate and higher incomes tend to benefit from more demand.”
Totals for releases of deeds of trust are collected quarterly by the Colorado Division of Housing. This report tracks releases of deeds of trust as reported by public trustees in Colorado. The report includes twenty-one counties which are chosen based on population size and to ensure that as many regions of the state as possible are represented. More than 90 percent of all occupied households in Colorado are within the twenty-one counties chosen.
Tuesday, April 17, 2012
Housing News Digest, April 17
Nation's homebuilders request most permits in 3½ years
Homebuilding is showing new life in the Colorado Springs area as well. Single-family building permits, which measure the pace of home construction, totaled 172 last month in Colorado Springs and El Paso County
Hahn new CHFA chairman
James Hahn of JMG Consulting has been appointed chairman of the Colorado Housing and Finance Authority board for the 2012-2013 term.
Hahn was was first appointed to CHFA’s board by former Gov. Bill Ritter in 2009. He was also appointed chair of CHFA’s Finance Committee in February.
RedPeak releases Moncrieff rendering
RedPeak Properties has released a rendering of the four-story, luxury apartment building it plans to build on West Moncrieff Place in West Highland.
Previously, RedPeak had released elevations of two five-story, nearby apartment buildings it plans to develop on Lowell Boulevard and Meade Street in Highland Square, just north of the popular and trendy West 32nd Avenue corridor.
Inconsistent Construction Jobs a Factor In Weld Unemployment
Anyone who reads Weld County's monthly job announcements can see it. Houston-based oil and gas service provider Halliburton announced 500 jobs in Windsor last January. This was followed shortly after with another 1,000 jobs, announced by customer service provider Teletech. And, of course, there is the seemingly endless news of more oil and gas investment into the region -- now estimated in the billions next year from companies like Anadarko and Noble Energy.
RE/MAX: March home prices up 5.8% from last year
Home prices in the 53 largest cities increased 5.8% in March from the same month last year, according to a report from real estate association RE/MAX.
The homes sold in March had a median sales price of $184,525. It was the second-straight month prices rose higher than the year-ago period. Before February, home prices landed below year-ago levels for 18 consecutive months. But home sales steadily picked up over the last nine months.
Home sales rise again in metro Colorado, metro Denver and Colorado Springs
The number of single-family home sales closings increased again in February in metro Denver, the Pikes Peak Region, and statewide. According to home sales information released by the Colorado Association of Realtors, the number of single-family closings rose 13.5 percent in metro Denver during February 2012 compared to February 2011. Over the same period, closings rose 17.6 percent statewide, and 14.3 percent in the Pikes Peak region. Statewide in February, there were 3,746 closings. 2,036 of them were in the metro Denver region and 511 occurred in the Pikes Peak region.
The number of closings in all three measures has increased, year over year, each month for the past eight months (July 2011-Feb 2012).
This recent growth trend has also begun to show up in the 12-month moving averages used to track trends in home sales. The highly-cyclical nature of home sales trends makes it difficult to track multi-year trends in home sales. The addition of the homebuyer tax credits from 2008 to 2010 further complicated the picture. So, I have smoothed out the sales totals using a 12-month moving average for each month.
In the first graph, we see the moving average in home sales compared to year-over-year changes in the average for the metro Denver area. The trend in home sales closing had been downward since mid-2005 and accelerated in early 2009. From March 2008 until September 2011, every month showed a negative year-over-year change in home sales. In February, the year-over-year change was positive for the fifth time in 47 months, with an increase of 4.1 percent. There now appears to be a growth trend in single-family closings.

The second graph shows the same measurements for Colorado statewide. The year-over-year change in the statewide average for home sales turned positive in February for the fifth time in 15 months. Statewide, transactions moved into positive territory in response to the homebuyer tax credits that were were offered in 2009 and 2010, but moved into negative territory again after the expiration of the credits. The statewide moving average increased 5.7 percent in February, year over year, and was the largest increase recorded since 2006.
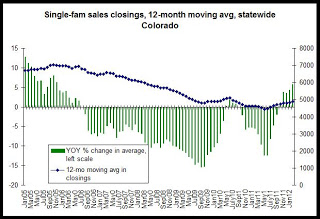
The third graph shows the same measures for the Pikes Peak region. The homebuyer tax credit produced much larger changes in the regional trends in the Pikes Peak region than in metro Denver or statewide. The year over year change in February was positive, making it the fourth time in fourteen months that the year-over-year change in average sales has been positive. Excluding the run-up in home sales produced by the tax credit in 2009 and 2010, the average in home sales had been largely flat since mid-2009 in the Pikes Peak region, but has shown some slight signs of increase in recent months.
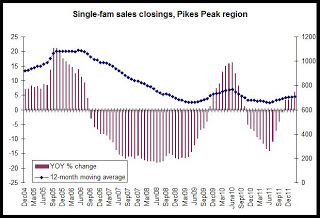
Conclusions: Sales activity continues to show signs of growth, and in some cases is at multi-year highs. Interestingly, new sales activity has not necessarily translated into robust growth in home prices. Home price data shows prices to still be essentially flat in many areas, or even decreasing, according to FHFA and others. See the home price archive for more.
The number of closings in all three measures has increased, year over year, each month for the past eight months (July 2011-Feb 2012).
This recent growth trend has also begun to show up in the 12-month moving averages used to track trends in home sales. The highly-cyclical nature of home sales trends makes it difficult to track multi-year trends in home sales. The addition of the homebuyer tax credits from 2008 to 2010 further complicated the picture. So, I have smoothed out the sales totals using a 12-month moving average for each month.
In the first graph, we see the moving average in home sales compared to year-over-year changes in the average for the metro Denver area. The trend in home sales closing had been downward since mid-2005 and accelerated in early 2009. From March 2008 until September 2011, every month showed a negative year-over-year change in home sales. In February, the year-over-year change was positive for the fifth time in 47 months, with an increase of 4.1 percent. There now appears to be a growth trend in single-family closings.
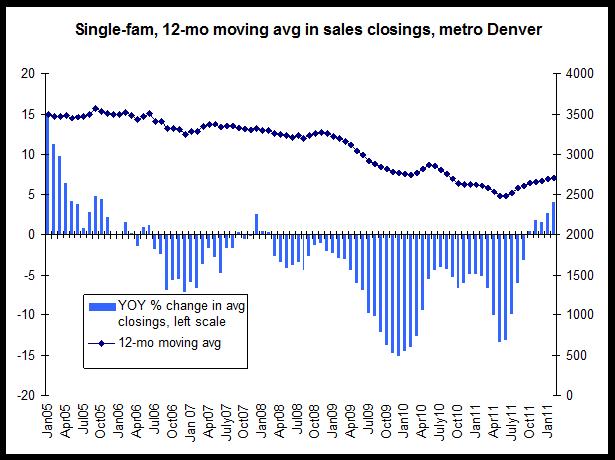
The second graph shows the same measurements for Colorado statewide. The year-over-year change in the statewide average for home sales turned positive in February for the fifth time in 15 months. Statewide, transactions moved into positive territory in response to the homebuyer tax credits that were were offered in 2009 and 2010, but moved into negative territory again after the expiration of the credits. The statewide moving average increased 5.7 percent in February, year over year, and was the largest increase recorded since 2006.

The third graph shows the same measures for the Pikes Peak region. The homebuyer tax credit produced much larger changes in the regional trends in the Pikes Peak region than in metro Denver or statewide. The year over year change in February was positive, making it the fourth time in fourteen months that the year-over-year change in average sales has been positive. Excluding the run-up in home sales produced by the tax credit in 2009 and 2010, the average in home sales had been largely flat since mid-2009 in the Pikes Peak region, but has shown some slight signs of increase in recent months.
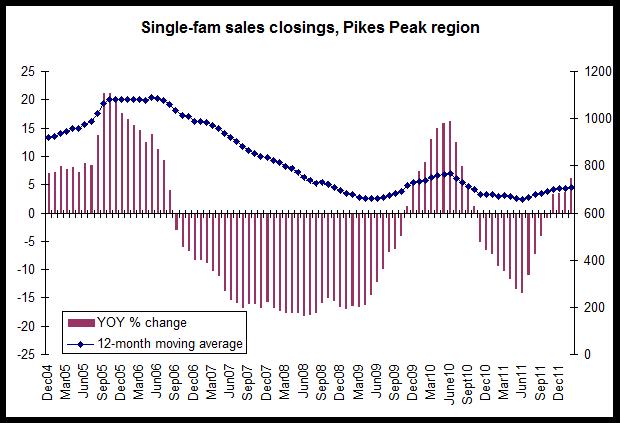
Conclusions: Sales activity continues to show signs of growth, and in some cases is at multi-year highs. Interestingly, new sales activity has not necessarily translated into robust growth in home prices. Home price data shows prices to still be essentially flat in many areas, or even decreasing, according to FHFA and others. See the home price archive for more.
Multifamily starts in U.S. West up 25 percent in March
Housing starts in the West Census region of the US, which includes Colorado, were up 12.2 percent from a year earlier during March, counting both single-family and multi-family units. According to new housing construction and housing starts data released today by the US Census Bureau, there were approximately 11,000 housing units started in the West during March 2012. Of the new units started, 8,000 were single-family structures and 3,000 were structures containing more than one housing unit.
Nationally, housing starts rose 9.2 percent during the same period, with total housing starts rising to a total of 54,500.
Total housing starts remain well below peak levels both nationally and in the West. March 2012 housing starts in the West were 79 percent below the peak reached during May 2004. Nationally, March was 72 percent below peak levels. The national peak in housing starts was reached during May 2005.
Multifamily starts have rebounded more than single-family starts. In the West, single-family starts are 83 percent below peak levels while multifamily starts are only 70 percent below peak levels.
The West census region includes states on the west coast and within the Rocky Mountain region.
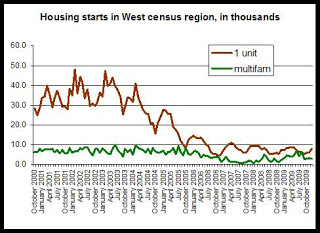
The first graph shows the difference between single-family starts and starts for structures in the West with more than one housing unit. Both remain near ten-year lows, but single-family starts in the West rose 8.1 percent from March 2011 to March 2012. Starts for structures with more than one unit increased by 25 percent during the same period, rising from 2,400 units during March 2011, to 3,000 units during March of this year. Given recent data showing strength in the demand for rental-housing, the housing starts data may suggest that developers of rental housing continue to move forward with construction of new multifamily structures.
The second graph shows month-by-month comparisons in housing starts for each year in the West. March's housing starts total was a 18.2 percent increase from February. Nationally, the increase during the same period was 13.7 percent. Numbers are not seasonally adjusted.
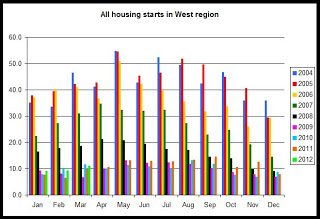
More sustained growth was visible in starts for structures with more than one housing unit. Multifamily starts were at a four-year high during March. March was the third month in a row in which multifamily housing starts grew, year over year.
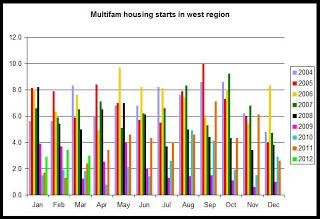
This data suggests that multifamily starts have established a clear growth trend over the past several months, but overall starts activity remains well below levels seen during most of the past decade.
Nationally, housing starts rose 9.2 percent during the same period, with total housing starts rising to a total of 54,500.
Total housing starts remain well below peak levels both nationally and in the West. March 2012 housing starts in the West were 79 percent below the peak reached during May 2004. Nationally, March was 72 percent below peak levels. The national peak in housing starts was reached during May 2005.
Multifamily starts have rebounded more than single-family starts. In the West, single-family starts are 83 percent below peak levels while multifamily starts are only 70 percent below peak levels.
The West census region includes states on the west coast and within the Rocky Mountain region.
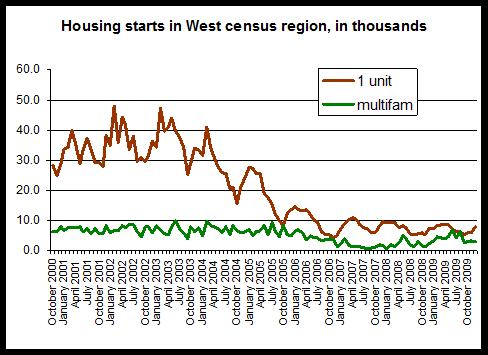
The first graph shows the difference between single-family starts and starts for structures in the West with more than one housing unit. Both remain near ten-year lows, but single-family starts in the West rose 8.1 percent from March 2011 to March 2012. Starts for structures with more than one unit increased by 25 percent during the same period, rising from 2,400 units during March 2011, to 3,000 units during March of this year. Given recent data showing strength in the demand for rental-housing, the housing starts data may suggest that developers of rental housing continue to move forward with construction of new multifamily structures.
The second graph shows month-by-month comparisons in housing starts for each year in the West. March's housing starts total was a 18.2 percent increase from February. Nationally, the increase during the same period was 13.7 percent. Numbers are not seasonally adjusted.
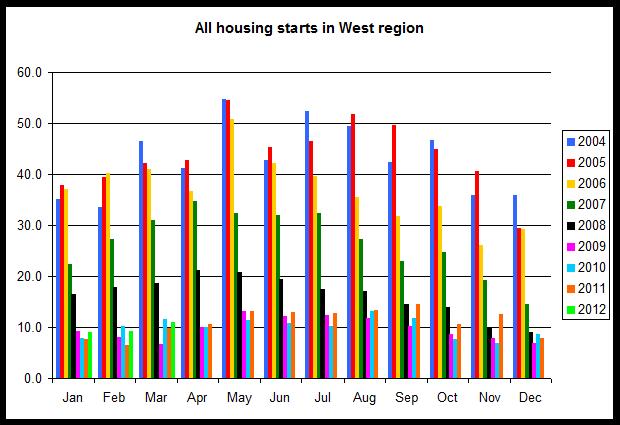
More sustained growth was visible in starts for structures with more than one housing unit. Multifamily starts were at a four-year high during March. March was the third month in a row in which multifamily housing starts grew, year over year.
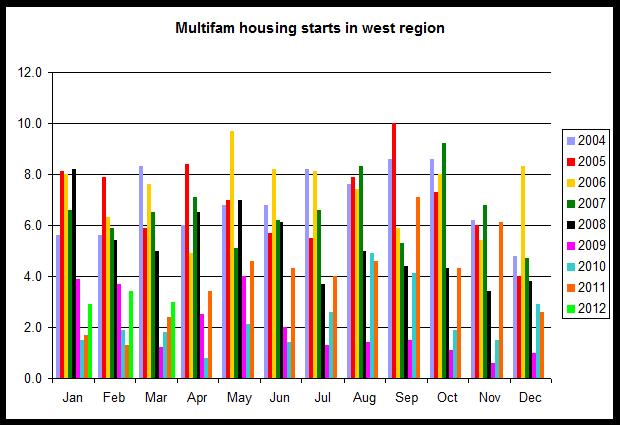
This data suggests that multifamily starts have established a clear growth trend over the past several months, but overall starts activity remains well below levels seen during most of the past decade.
Monday, April 16, 2012
Denver asking prices for homes up 15 percent, inventory down
The single-family and condo inventory in the Denver area declined 33.8 from mid-April 2011 to the same period this year. According to new data released today by Housingtracker.net, the total inventory declined from 22,133 to 14,647 year over year, but was up 3 percent month over month, reflecting seasonal changes.
The median asking price in the Denver area, from April 2011 to April 2012, was up 15 percent, and it was up 2 percent, month over month. The median asking price increased from $255,586 to $294,197 year over year.
At the the national metro aggregate level, the single-family and condo inventory declined 20.6 percent, year over year, while the median asking price rose 3.4 percent from $222,526 to $230,205. Month over month at the national level, the inventory rose 0.3 percent while the asking price rose 1.9 percent.
Note: The median asking price tends to be significantly higher than the median selling price. For median selling prices, see here.
Most metro counties report increases in single-family permits during 2012
Of the 1,233 new single-family permits issued during the first two months of 2012, 243 of them, or 20 percent, were issued in El Paso County alone. According to new single-family February permit data by county, released by the Census Bureau, the counties with the largest numbers of single-family permits issued during the first two months of 2012 were El Paso, Douglas, Weld and Denver.
See here for recent posts about building permits.
New single-family permits during January 2012
El Paso 243
Douglas 221
Denver 132
Weld 122
Also:
Adams 79
Arapahoe 98
Boulder 43
Broomfield 14
Chaffee 18
Elbert 3
Jefferson 78
Larimer 107
Mesa 44
Park 6
Pueblo 18
Routt 5
Teller 2
(Note: All permits discussed in this article are single-family permits.)
However, when permit totals are adjusted to the number of existing housing units in each county, the counties with the larges amounts of permit activity were Douglas, Weld and Chaffee counties.
The first map shows the relative amount of single-family permit activity adjusted for the existing size of the housing stock in each county. The counties are then broken out in quartiles reflecting the amount of single-family activity compared to other counties. The top quartile has the largest amount of new permitting compared to the number of existing units. The bottom quartile has the smallest amount.
Top Q: Brown
2nd Q: Green
3rd Q: Orange
Bottom Q: Yellow
No data: White

During the first two months of 2012, the metro counties with relatively few new single-family permits relative to the size of the existing stock are Pueblo, Jefferson, Boulder, and Teller counties.
In a larger context, single-family permits remain well below totals experienced prior to 2007. From 2006 to 2008, single-family permits in the state decreased 60 percent from 31,000 to 12,000. Permit activity appears to have bottomed out in 2009. When discussing permit activity from 2008 to the present time, even in areas that report substantial increases, we're looking at permit totals that are near 20-year lows.
See here for a discussion on historical permit data by county.
It is also helpful to see which counties have shown the largest increases and decreases in permit activity. In the map below, we see that comparing January-February 2011 to January-February 2012, several metro counties reported year-over-year increases of 50 percent or more. Pueblo, where single-family permits dropped 10 percent, was the only metro county that reported a decrease.
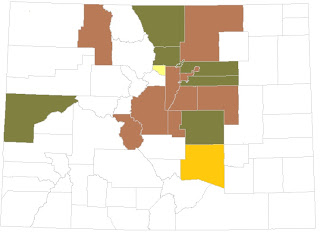
Brown: Increase of 50 percent or more
Green: Increase of 1 to 49.9 percent
Orange: Decrease of 1 to 49.9 percent
Yellow: Decrease of 50 percent or more
White: No data or no change
Largest increases among metro counties:
Denver 103 percent
Teller 100 percent
Douglas 169 percent
See here for recent posts about building permits.
New single-family permits during January 2012
El Paso 243
Douglas 221
Denver 132
Weld 122
Also:
Adams 79
Arapahoe 98
Boulder 43
Broomfield 14
Chaffee 18
Elbert 3
Jefferson 78
Larimer 107
Mesa 44
Park 6
Pueblo 18
Routt 5
Teller 2
(Note: All permits discussed in this article are single-family permits.)
However, when permit totals are adjusted to the number of existing housing units in each county, the counties with the larges amounts of permit activity were Douglas, Weld and Chaffee counties.
The first map shows the relative amount of single-family permit activity adjusted for the existing size of the housing stock in each county. The counties are then broken out in quartiles reflecting the amount of single-family activity compared to other counties. The top quartile has the largest amount of new permitting compared to the number of existing units. The bottom quartile has the smallest amount.
Top Q: Brown
2nd Q: Green
3rd Q: Orange
Bottom Q: Yellow
No data: White
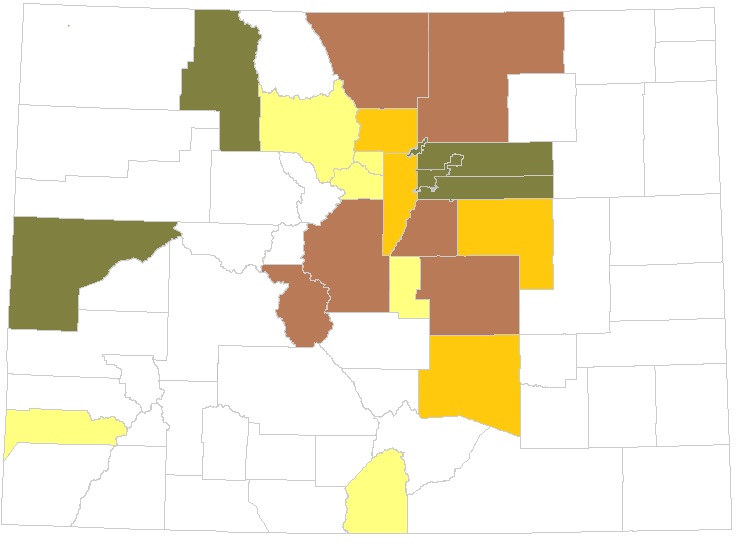
During the first two months of 2012, the metro counties with relatively few new single-family permits relative to the size of the existing stock are Pueblo, Jefferson, Boulder, and Teller counties.
In a larger context, single-family permits remain well below totals experienced prior to 2007. From 2006 to 2008, single-family permits in the state decreased 60 percent from 31,000 to 12,000. Permit activity appears to have bottomed out in 2009. When discussing permit activity from 2008 to the present time, even in areas that report substantial increases, we're looking at permit totals that are near 20-year lows.
See here for a discussion on historical permit data by county.
It is also helpful to see which counties have shown the largest increases and decreases in permit activity. In the map below, we see that comparing January-February 2011 to January-February 2012, several metro counties reported year-over-year increases of 50 percent or more. Pueblo, where single-family permits dropped 10 percent, was the only metro county that reported a decrease.

Brown: Increase of 50 percent or more
Green: Increase of 1 to 49.9 percent
Orange: Decrease of 1 to 49.9 percent
Yellow: Decrease of 50 percent or more
White: No data or no change
Largest increases among metro counties:
Denver 103 percent
Teller 100 percent
Douglas 169 percent
Denver and Douglas counties dominate new multifamily permit totals
During the first two months of 2012, 98 percent of new multifamily permits issued were found in only four counties: Arapahoe, Denver, Douglas and Jefferson. Denver county had the most multifamily activity by far, with 225 multifamily permits issued during the first two months of 2012. Douglas county reported the second-largest number of permits with 60.
Denver County, which has issued 63 percent of all multifamily permits reported so far this year, also reported more multifamily permits than single-family permits from January through February, with 132 single-family permits. Denver was the only county to report more multi-family than single-family permits.
According to new multifamily permit data for Colorado counties, 393 multifamily permits were issued from Janaury 2012 through February 2012. Only the following counties reported any multifamily permit activity during the first two months of this year:
Arapahoe 49
Denver 225
Douglas 60
Jefferson 53
Larimer 6
For more historical info on multifamily permits, see here.
Multifamily permits increased 104 percent in the reporting counties from the first two months of 2011 to the same period this year. During the first two months of last year, 192 multifamily permits were issued in the reporting counties, and 176 of those, or 92 percent, were issued in Denver County alone.
With so little demand for new condominiums right now, it is safe to assume that the lopsided majority of new multifamily permits being issued are for rental housing. We see most of this activity in areas where vacancy rates have been tight or look to be tight for the near to mid-term.
The downtown Denver area has been one of the most in-demand areas for rental housing in recent quarters, and recent demand for new construction in the neighborhood has made Denver a large part of new multifamily construction.
The Census Bureau has not yet released its 2011 year-end report which include more data from most of the state's 64 counties. We will publish an analysis when that data becomes available.
However, we do have partial data for metropolitan counties and select non-metro counties through December 2011. See here.
March consumer price increases in U.S. West driven by gasoline, apparel
The Bureau of Labor Statistics released Friday the March CPI for US urban areas and regions. In the West region, from March 2011 to March 2012, the CPI increased 2.4 percent. This is the second-largest year-over-year increase since 2008, although it is a relatively small increase.
In the first graph, we that the year-over-year change in March for the CPI was down a little from March 2011's change of 2.6 percent, and was well down from 2008's peak change of 3.6 percent.

Housing costs, which are a major portion of the CPI, continue to help keep increases in the CPI down. Housing was up year over year by 1.9 percent, as was "owners' equivalent rent." Rents for tenants, however were up by 2.6 percent.
On the other hand, gasoline was up, year over year, by 9.9 percent and apparel was up by 4 percent. Food was up by 2.8 percent.
Although annual increases in rent (according to State of Colorado data) have exceeded 5 percent in many areas of the state, the housing component of CPI also reflects declining and stagnant home prices, which indirectly mitigate the increases in rent levels within the index.
Recent price increases will impact household calculations and attitudes on spending as many households conclude that discretionary spending will need to be scaled back in the face of increasing food and transportation costs. According to the most recent personal income data, personal income growth has not been keeping up with CPI growth.
The second graph shows year-over-year changes in CPI for all months since 2002. Annual CPI growth hovered around 3 percent for much of 2011, but has been declining during the past six months.
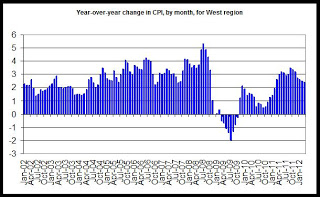
The CPI increase form February 2012 to March 2012 was 0.9 percent, which was the largest month-to-month increase since March 2011.
Nationally, the CPI increased slightly more than in the West region:
Over the past ten years (comparing March 2003 to March 2012), the CPI has risen 22 percent. In other words, a dollar today buys less than 4/5ths of what it did in 2003.
In the first graph, we that the year-over-year change in March for the CPI was down a little from March 2011's change of 2.6 percent, and was well down from 2008's peak change of 3.6 percent.
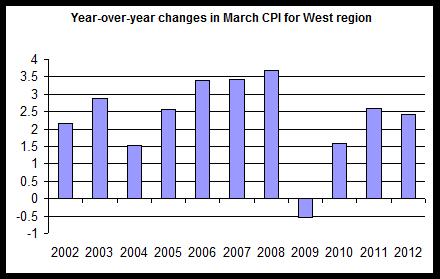
Housing costs, which are a major portion of the CPI, continue to help keep increases in the CPI down. Housing was up year over year by 1.9 percent, as was "owners' equivalent rent." Rents for tenants, however were up by 2.6 percent.
On the other hand, gasoline was up, year over year, by 9.9 percent and apparel was up by 4 percent. Food was up by 2.8 percent.
Although annual increases in rent (according to State of Colorado data) have exceeded 5 percent in many areas of the state, the housing component of CPI also reflects declining and stagnant home prices, which indirectly mitigate the increases in rent levels within the index.
Recent price increases will impact household calculations and attitudes on spending as many households conclude that discretionary spending will need to be scaled back in the face of increasing food and transportation costs. According to the most recent personal income data, personal income growth has not been keeping up with CPI growth.
The second graph shows year-over-year changes in CPI for all months since 2002. Annual CPI growth hovered around 3 percent for much of 2011, but has been declining during the past six months.
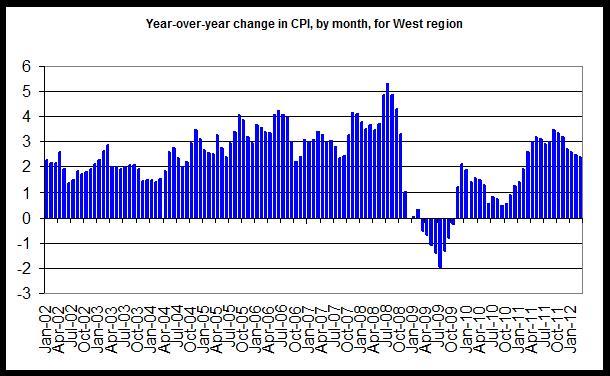
The CPI increase form February 2012 to March 2012 was 0.9 percent, which was the largest month-to-month increase since March 2011.
Nationally, the CPI increased slightly more than in the West region:
The index for all items less food and energy rose 0.2 percent in
March after increasing 0.1 percent in February. Most of the major
components increased in March, with the indexes for shelter and used
cars and trucks accounting for about half the total increase for all
items less food and energy. The indexes for medical care, apparel,
recreation, new vehicles, and airline fares increased as well, while
the indexes for tobacco and household furnishings and operations were
among the few to decline in March.
Over the past ten years (comparing March 2003 to March 2012), the CPI has risen 22 percent. In other words, a dollar today buys less than 4/5ths of what it did in 2003.
Housing News Digest, April 16
Struggle continues for commercial real estate market
Commercial real estate, hit hard in recent years by the local and national economic slumps, continued to struggle during the first quarter in the Pikes Peak region, according to a report by Turner Commercial Research of Colorado Springs.
Vacancy rates remained relatively high and rents fell in some segments of the market — more evidence that as the economy goes, so goes the commercial market.
Ruling against Archstone in case over apartment amenity fees
In a closely-watched case, a federal judge has ruled that one-time, nonrefundable amenity fees charged by Colorado apartment giant Archstone violate state law in Massachusetts.
Asbestos Find Leads to University of Colorado’s $1.5 Million Demolition Plans
The University of Colorado will demolish a building on campus next year after a health audit exposed that it contained large amounts of asbestos, which poses a long-term health threat to students and staff.
The College Inn building was used as an overflow housing dorm at the university, and local reports cite that it was constructed in 1964, a time when asbestos was widely used in construction materials.
Colorado Center for the Blind buys apartments on bus line to help students
Students at the Colorado Center for the Blind in Littleton have a new base for independent living while training at the center.
The center recently purchased an apartment complex on Lowell Boulevard near East Bowles Avenue for student residents. It's on a bus line that allows them to travel back and forth from the center on their own.
Bedbugs put bite on Springs landlords, renters
The diagnosis Jeannette Greer received during her visit to the Penrose Hospital emergency room in March was cellulitis, a skin infection that can have any number of causes.
But Greer says she knows the source of her infection: bedbugs. She started seeing them within hours of moving into her unit at Enfield Apartments in December, and despite numerous attempts by the property manager to eradicate the critters, they come back like a recurring nightmare, she says.
Friday, April 13, 2012
Developer's Toolkit Workshop - April 30 & May 1, 2012
Developer's Toolkit Workshop
***The deadline to register is Monday, April 16.
Join the DOLA/Colorado Division of Housing for an exciting two-day
workshop designed to enlighten participants about the art and science of
affordable housing development. Through role-playing, participants will
attempt to solve the housing challenge facing a typical Colorado
community. Hands-on exercises will provide a working knowledge of the
critical steps necessary to develop an affordable rental housing
community.
DOLA/CDOH will be presenting the Developer's Toolkit on April 30 & May 1, at the
Mile High United Way, Founder's Room, 2505 Eighteenth Street, Denver.
Registrations are due on April 16th. This class often fills up quickly. So if you are planning to attend, register soon! *
Registration form is on page 2 of the brochure.
Contact Denise Selders (303-866-4650) or [email protected] with any questions.
Housing News Digest, April 13
RealtyTrac ranks Colorado No. 8
In a report released today, the Irvine, Calif.-based company showed that one out of every 191 households in Colorado were in some stage of foreclosure, from the first filing to the REO (real estate owned) transaction when the bank takes possession of the house. The U.S. average for foreclosures was one out of 230 households. Nevada remained No. 1 for the 62nd consecutive month, with one out of every 95 housing units in foreclosure. Nevada kept the top spot despite its foreclosure activity falling by 62 percent from the first quarter of 2011 and dropping 26 percent from the fourth quarter.
Home sales sizzle in March
Forget about March Madness. The real action last month did not take place on college basketball courts, but came from home buyers snapping up houses in the Denver area.
The number of previously owned homes placed under contract in March jumped by 49.2 percent compared with March 2011, while they rose 28.4 percent from February. Closings were up 39.3 percent from March and 8.3 percent from a year earlier, according to reports released on Thursday. Single-family home prices rose by 5 percent from February, with an average price of $284,035 in March, were up 5 percent and 4 percent on a month-to-month and year-over-year basis, respectively.
Land Investment Is Trending Positively
Over the course of the past few years, both buyers and sellers of farm and ranch land in Colorado have wondered what the future held for land values. Recently, we’ve heard from most market sectors that activity has increased significantly. That trend has been clearly influenced by discerning buyers rebalancing their investment portfolios away from the equity markets and toward hard assets such as land.
Watchdog blasts housing program for 'hardest hit'
WASHINGTON (CNNMoney) -- A federal-state program aimed at helping homeowners in states hardest hit by the mortgage crisis is falling far short of its goals, a federal watchdog said in a report released Thursday.
In the report, the Special Inspector General for the Troubled Asset Relief Program (TARP) said that just 3% of $7.6 billion available in the Hardest Hit Housing Markets program -- available for 18 states and the District of Columbia -- had been tapped as of Dec. 31.
Fitch:Commercial Real Estate CDO Delinquencies Up In March
Delinquencies on commercial real estate collateralized debt obligations inched up in March, reflecting a continued decline in total collateral, Fitch Ratings said.
The rate rose to 13.6%, from 13.4% in February. Yet Fitch noted the dollar balance of delinquent assets in March was virtually the same as the prior month. The increased rate, the firm said, is instead the result of a drop in the total collateral balance as a result of realized losses and repayments.
Wednesday, April 11, 2012
Building America Summer 2012 Technical Update Meeting
Building America Summer 2012 Technical Update Meeting
Register now for the third annual Building America Summer 2012 Technical Update Meeting, scheduled for July 24-26, 2012, in Denver, Colorado. Space is limited, so please register as soon as possible!
This meeting, hosted by the U.S. Department of Energy's Building America program, will showcase the latest in cutting-edge, energy-efficient residential building technologies and practices. On July 24th, join our Building America Standing Technical Committee (STC) meetings to weigh in on current and future research priorities. On July 25th and 26th, the meeting will follow a dynamic new format, bringing together researchers from Building America teams and national laboratories in a panel discussion. These sessions will focus on addressing issues that must be resolved to deliver solutions that reduce whole-house energy use in new and existing homes by 30%-50%.
This meeting is targeted to researchers, architects, contractors, manufacturers, builders, utilities, legislators, lenders, realtors, auditors, raters, installation technicians, HOA representatives, and anyone else interested in improving energy efficiency in both new and existing residential buildings. Together, we can make a difference in residential energy efficiency!
If you have questions, please contact [email protected].
Cost
The conference is free of charge and lunch will be provided; however, participants must register in advance.
Location
Renaissance Denver Hotel
3801 Quebec Street
Denver, CO 80207
Phone: 303-399-7500
Zillow: Feb. home values decline in all metros but Ft. Collins
The Zillow Home Value Index for the United States decreased 4.5 percent from February 20121 to February 2012, falling to $145,400. In Colorado, the home value index fell 1.3 percent over the same period to $199,300.
In Colorado's metro areas, all areas except the Fort Collins metro area showed year-over-declines from February 2012 to February 2012. Grand Junction and Pueblo showed the largest drops while Boulder and Denver metro showed the smallest drops.
Greeley data was not included in the report.
Change from February 2011 to February 2012:
Boulder -1.1
Colo Springs -1.3
Denver metro -1.1
Ft. Collins +2.1
Grand Junct -9.9
Pueblo -5.8
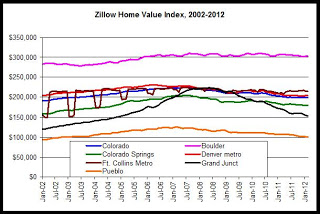
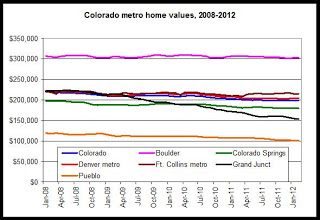
As can be seen in the graphs, in recent years, home prices have shown the most stability in Boulder, Fort Collins and in Denver metro. These three areas also have the highest median estimated value, according to Zillow.
Estimated home value for each metro area for February 2012:
Boulder $303,300
Colo Springs $179,400
Denver metro $204,200
Ft. Collins $214,900
Grand Junct $153,900
Pueblo $101,400
The Grand Junction area has showed the most bubble-like behavior in its run-up in prices in 2007 and 2008 before a significant decline over the past 2 years.
Zillow home valuations, known as the median "Zestimate valuation" should be taken with a grain of salt, but in this case they do appear to be in line with other home price indices and trends. The metro trends presented here match up well with the metro trends provided by FHFA's quarterly reports on home prices in Colorado.
The strongest Colorado job markets, found in Boulder, metro Denver and the Ft. Collins area correspond with the highest home value estimates. The continued small declines in prices reflects other indices, although the Case-Shiller and CoreLogic indices did show some small increases for prices during January and February, respectively.
In Colorado's metro areas, all areas except the Fort Collins metro area showed year-over-declines from February 2012 to February 2012. Grand Junction and Pueblo showed the largest drops while Boulder and Denver metro showed the smallest drops.
Greeley data was not included in the report.
Change from February 2011 to February 2012:
Boulder -1.1
Colo Springs -1.3
Denver metro -1.1
Ft. Collins +2.1
Grand Junct -9.9
Pueblo -5.8
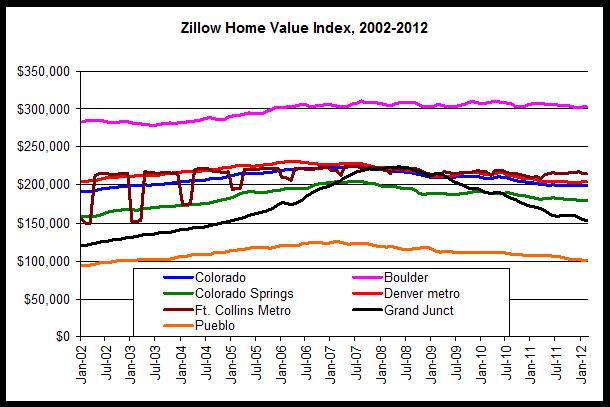
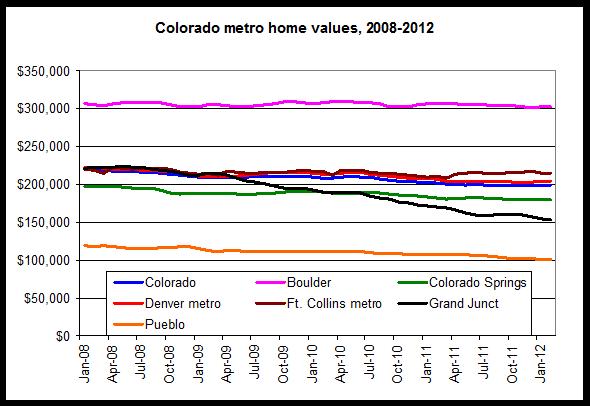
As can be seen in the graphs, in recent years, home prices have shown the most stability in Boulder, Fort Collins and in Denver metro. These three areas also have the highest median estimated value, according to Zillow.
Estimated home value for each metro area for February 2012:
Boulder $303,300
Colo Springs $179,400
Denver metro $204,200
Ft. Collins $214,900
Grand Junct $153,900
Pueblo $101,400
The Grand Junction area has showed the most bubble-like behavior in its run-up in prices in 2007 and 2008 before a significant decline over the past 2 years.
Zillow home valuations, known as the median "Zestimate valuation" should be taken with a grain of salt, but in this case they do appear to be in line with other home price indices and trends. The metro trends presented here match up well with the metro trends provided by FHFA's quarterly reports on home prices in Colorado.
The strongest Colorado job markets, found in Boulder, metro Denver and the Ft. Collins area correspond with the highest home value estimates. The continued small declines in prices reflects other indices, although the Case-Shiller and CoreLogic indices did show some small increases for prices during January and February, respectively.
Subscribe to:
Posts (Atom)