Monday, October 31, 2011

Single-family units popular in Weld, El Paso, and Douglas counties

Of the 5,359 new single-family permits issued during the first nine months of 2011, 1,190 of them, or 22 percent, were issued in El Paso County alone. According to new single-family September permit data by county, released last week by the Census Bureau, the counties with the largest numbers of single-family permits issued during the first nine months of 2011 were El Paso, Douglas, Denver, Larimer and Arapahoe.

See here for recent entries about building permits.

New single-family permits from Jan-Sept
El Paso 1190
Douglas 717
Larimer 563
Denver 529
Arapahoe 482

Also:
Adams 420
Broomfield 82
Chaffee 59
Clear Creek 7
Grand 25
Jefferson 416
Mesa 64
Park 57
Teller 23
Weld 479

(Note: All permits discussed in this article are single-family permits.)

However, when permit totals are adjusted to the number of existing housing units in each county, the counties with the larges amounts of permit activity were Chaffee, Park, Douglas, El Paso and Weld.

The first map shows the relative amount of single-family permit activity adjusted for the existing size of the housing stock in each county. The counties are then broken out in quartiles reflecting the amount of single-family activity compared to other counties. The top quartile has the largest amount of new permitting compared to the number of existing units. The bottom quartile has the smallest amount.

Top Q: Brown
2nd Q: Green
3rd Q: Orange
Bottom Q: Yellow
No data: White


In absolute terms, and as expected, the counties with the largest populations have the most permit activity. But when adjusted to the number of existing housing units (as shown in the map), the hot spots for single-family permits right now are Douglas, Park and Chaffee, Weld and El Paso counties. Larimer, Grand, Mesa and Broomfield counties land in the second quartile.

During the first nine months of 2011, the areas with relatively few new single-family permits relative to the size of the existing stock are Pueblo, Jefferson, Denver, Arapahoe, Elbert and Boulder counties.

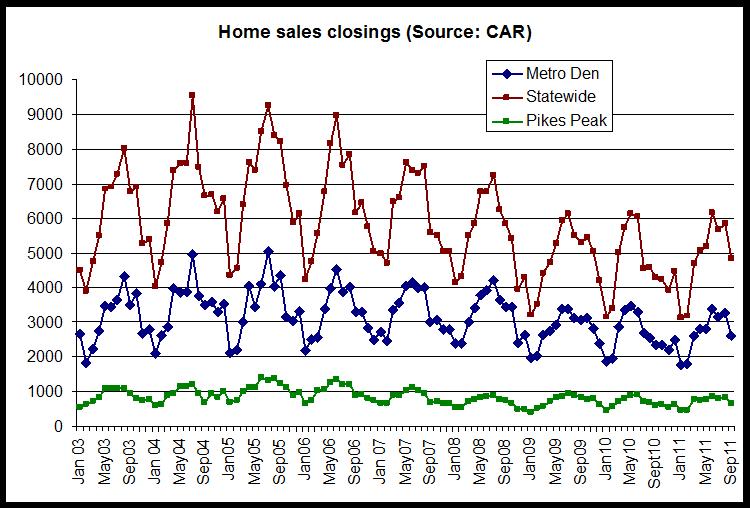
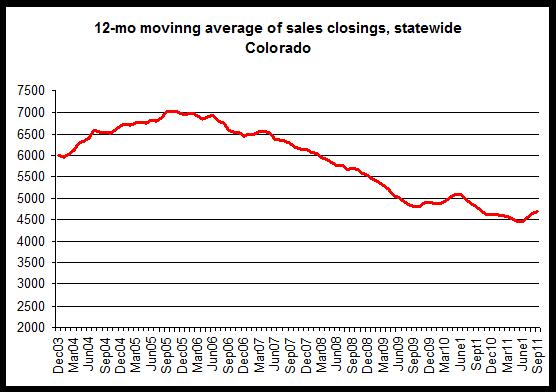
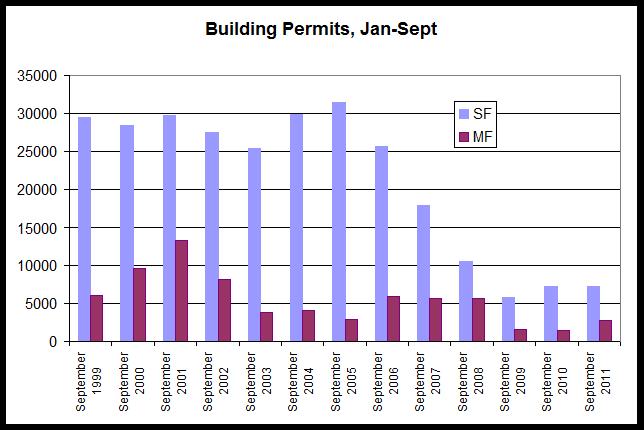
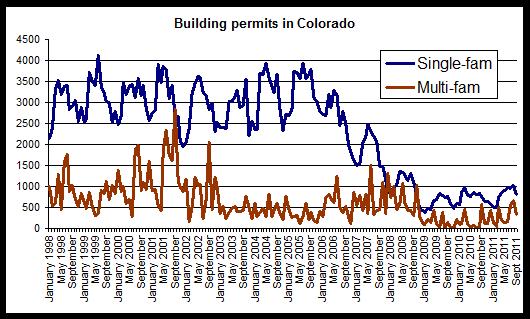
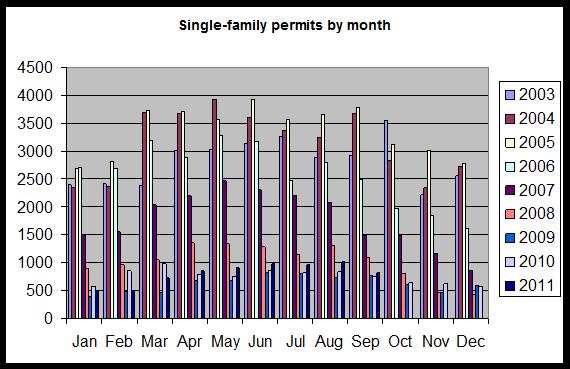
In the larger context, single-family permits remain well below totals experienced prior to 2007. From 2006 to 2008, single-family permits in the state decreased 60 percent from 31,000 to 12,000. Permit activity appears to have bottomed out in 2009. When disussing permit activity from 2008 to the present time, we're looking at permit totals that are near 20-year lows.

See here for a discussion on historical permit data by county.

It is also helpful to see which counties have shown the largest increases and decreases in permit activity. In the map below, we see that comparing the first nine months of this year to the same period last year, Larimer and Teller counties were among the counties with the largest increases in single-family permit activity. Boulder, Jefferson, Denver and Douglas counties also showed increases. On the other hand, permits decreased in Mesa, Weld, Adams, Arapahoe, El Paso and Pueblo counties.


Brown: Increase of 25 percent or more
Green: Increase of 1 to 24.9 percent
Orange: Decrease of 1 to 24.9 percent
Yellow: Decrease of 25 percent or more
White: No data or no change

Largest increases among metro counties:
Larimer 56 percent
Teller 43 percent
Douglas 12 percent
Denver 4 percent
Jefferson 3.5 percent

With relatively large numbers of new permit activity in 2011, and with a year-over-year increase in each county, both Larimer County and Douglas County show solid demand for new permitting at this time. In spite of year-over-year declines in totals, El Paso County continues to report a significant share of the state's overall permitting activity while Weld county reports a surprisingly large number of new single-family permits in the wake of very high foreclosure totals. Much of the new permit activity in Weld county is coming from expanding communities in southern Weld County.

September sales: home sales transactions in Colorado, metro Denver and Colo. Springs

There were 2,611 existing home sales in metro Denver during September. This is up 10.7 percent from September 2010's total of 2,357. Statewide, there were 4,845 sales in September after rising 13 percent from September 2010's total of 4,286. In the Colorado Springs area, sales rose 11.4 percent from September 2010's total of 603 sales to this year's September total of 672.

Typically, I report the number of home sales closings for each month. Naturally, there is a seasonal cycle for home sales that can be seen in the first graph below. Sales typically bottom out in January or February, while they typically peak in July or August.


This seasonality makes it somewhat difficult to immediately see patterns over several years. In the first graph, we can see a gradual drift downward over the past 4 years. However, over the past three years, the presence of the home buyer tax credit has further complicated the picture by changing the usual distribution of sales across the year of 2010. As can be seen in the graph, the usual pattern of sales transactions has been altered during 2010 due to a number of buyers rushing to put homes under contract before the April expiration of the credit.

This has made it difficult to make year-over-year comparisons for each month.

In order to make it easier to compare activity year-over-year, and to make it easier to identify multi-year trends, I have calculated 12-month moving averages for each month in the three graphs below. This helps erase some of the seasonality, and also allows us to make more reliable comparisons with 2010 in spite of the tax credit distortions.


Statewide, the 12-month moving average for home sales in September was 4,701 closings. This is down 2.1 percent from September 2010, when the average was 4,802 closings. It is also the 13th month in a row in which the year-over-year comparison has been negative. The September average was down 33 percent from October 2005 when the average peaked at 7,033 closings.


A similar trends was evident in metro Denver where the September average was 2,604 closings, which is a decline of 3.2 percent from September 2010's average of 2,692. The metro Denver average peaked at 3,563 during September 2005. The year-over-year change has been negative in metro Denver for the past 13 months. The September 2011 average is down 27 percent from September 2005 when the metro Denver average peaked at 3,563.


In the Colorado Springs/Pikes Peak area, the September 2011 average was 682 closings, which is down 4.1 percent from September 2010's average of 712. The year-over-year change in the 12-month average has been negative for the past 11 months. The September 2011 average is down 37 percent from May 2006 when the Colorado Springs average peaked at 1,089 closings.

In all three areas we find that the average has increased over the past three months. However, the average continues to be down year over year, and this suggests that there is still a fair amount of reticence on the part of buyers in the market for existing homes. It is also clear that total home sales continue to be well down from the peak levels seen during 2005 and 2006.

Note: These transaction totals are for single-family structures only.

Summary for week of Oct 24

This past week, we say further data reinforcing the view that multifamily activity is building while single-family activity remains near ten-year lows.

Also, all of the regional Housing Snapshots are now available, including:
Colo Springs
Pueblo
Northern Front Range
Grand Junction.

See the archive for all of them. The next statewide Snapshot will be available on the third-quarter data starts rolling in over the next few weeks.

Multifamily Permits:
September permits: multifamily permits up 88 percent in 2011. September itself was not unusually strong, but the YTD numbers continue to build.

New Home Sales: New home sales were up in the West during September but remained well below monthly totals seen from 2002-2007.

Housing News Digest, October 31

CNL making plans for three Colorado mountain properties
Florida real estate investment trust CNL has three mountain properties in Colorado, with plans evolving at each.

CNL's plans for 1,553 acres along the Colorado River​ near Granby are uncertain beyond one thing: it's not going to look like what was once proposed.

The real estate investment trust foreclosed on the land's previous developer, Shorefox LLC in 2006 after the developer was unable to make payments on a $40 million loan, ending lofty plans for a gated golfing and fishing community along four miles of rehabilitated Colorado River headwaters.

Home prices heading for triple-dip
NEW YORK (CNNMoney) -- The besieged housing market has even further to fall before home prices really hit rock bottom.

CMBS special servicers challenged by rising troubled loans

With some 13% of commercial mortgage-backed securities in special servicing, the largest players in the market say they are bracing for bigger loans and more volume in their pipelines.

In addition, at least one panelist predicted more delinquent CMBS would move to REO status.

According to Fiserv (FISV), a financial analytics company, home values are expected to fall another 3.6% by next June, pushing them to a new low of 35% below the peak reached in early 2006 and marking a triple dip in prices.

How far home buyers' $300,000 goes

Each week, TODAY real estate expert Barbara Corcoran looks around the U.S. to see what homebuyers can get for their money.

This week’s search is for truly unique properties you can get the keys to for $300,000 or less.

Friday, October 28, 2011

The Colorado State Brownfields Conference

November 14-15 at the Arvada Center.

Click here for full information.

The Colorado State Brownfields Conference
provides a forum to educate communities, local governments,
and businesses about opportunities for economic revitalization.

Emerging economic conditions and associated changes
in the real estate development climate create opportunities
to foster community reinvestment, regional partnerships,
and creative partnering.
This conference will explore the issues around policy, planning
and implementation of economic redevelopment projects.


Continuing Education Credits:
Real Estate (15 hrs); CLE (15 hrs); APA/AICP (pending)

Conference Highlights...

Real Estate Due Diligence & Liability Protection
Public Policies Impacting Redevelopment
Colorado's Blueprint for Economic Development
Renewable Energy Technology & Finance
ASARCO Redevelopment, Globeville, CO
Mining Reclamation/Good Samaritan Legislation
Funding Sources for Efficient Remediation
Lamar Station Transit Oriented Development
Sustainable Reuse of Brownfields Properties
Redesign, Reinvest & Redevelop Longmont
We're From The Government. We're Here To Help
Legal Update on Laws Related to Brownfields
Mountains of Success: Repurposing Mining-related Sites

September permits: multifamily permits up 88 percent in 2011

During the first nine months of 2011 in Colorado, building permits issued for multifamily construction are up 88 percent, year over year, while permits issued for single-family construction are up 0.8 percent for the same period.

This year, through September, there have been 2,721 multifamily permits issued in Colorado, and 7,268 single-family permits issued. For the same period during 2010, there were 1444 multi-family permits issued, and 7,207 single-family permits.


For the month of September alone, single-family permits are up, year-over-year, by 8.4 percent, and multi-family permits are down by 39.9 percent. There were 821 single-family permits and 337 multi-family permits issued during September 2011. There were 757 single-family permits and 561 multi-family permits issued during September 2010.

The second graph shows that overall, both multi-family and single-family permits in August are at levels below what was typical over the past decade, but that both are increasing. In the case of single-family permits, seasonal factors are contributing to the uptick in permits issued.


During September, the number of new multi-family permits issued was down from August 2011, and was the third-lowest September total for multi-family permits in ten years. 2011 overall has shown some significant growth in multi-family activity, but September activity was not particularly robust.


Growth in single-family permit activity suggests there is some hope among single-family homebuilders, but that demand is restrained. September's permit total for single-family units was at a 3-year high, although it remains well below typical September totals reported over the past decade.


Conclusions: This data further reinforces the notion that interest in new multifamily construction continues to increase at a much faster rate than interest in single-family construction.

Regional Housing/Economy summary for the Pueblo area


The New Pueblo Area Housing Snapshot is now available.

This completes all the regional Housing Snapshots based on data available during the Third quarter.

The others are:

Colorado Springs Area
Northern Front Range
Grand Junction Area.

There is also the statewide Housing Snapshot.

See the Housing Snapshot archives for all of them.

At the moment, I haven't planned a metro Denver Housing Snapshot because so much of what is posted on Divisionofhousing.com is data specific to metro Denver. The regional Snapshots are an effort to provide a little extra analysis for regions of the state that generally don't get as much attention as metro Denver.

Housing News Digest, October 28

Foreclosure rates decline in Northern Colorado
Foreclosure rates in August for the Fort Collins-Loveland and Greeley markets decreased over the same month a year earlier, according to a report by California-based CoreLogic.

The report said the foreclosure rate for Fort Collins-Loveland was 1.05 percent, down from 1.19 percent in August 2010.

The CoreLogic report noted that the Fort Collins-Loveland mortgage delinquency rate in August was 2.58 percent compared to 3.13 percent a year earlier.

Denver-area brokers, lenders offer ways to improve short sales
Lenders and servicers say they’re frustrated with incomplete loan packets and buyers not being pre-approved.

Both offer explanations, updates and suggestions for improving the process.

“It’s confusing as hell out there right now,” said Ron Woodcock, a short-sale expert with Re/Max Southeast Inc. of Denver. “To get a short sale approved, it ...

Are rich foreigners the answer to America's housing crash?
That half a million dollars, according to Schumer, one of New York's two Democratic Senators, could be part of the answer to the country's housing crash. Schumer and Mike Lee, a Republican Senator from Utah, are trying to drum up support for legislation that will entice foreigners to invest €359,000, C$508,000, 78m yen or 3.1m yuan in US residential real estate. And the sweetener: a visa to live here as long as you own the property. Is it starting to look attractive? It might be to those who don't subscribe to the thesis that America's best days are behind it.

Zillow: Buyers over optimistic on home value appreciation
More than 42% of prospective homebuyers polled by Zillow believe home values will appreciate by 7% annually in the years ahead.

"It's troubling that we're still in the midst of one of the worst housing recessions in history, and yet prospective buyers continue to have such high expectations for home value appreciation," said Stan Humphries, chief economist at Zillow.

New national personal income data released today

The U.S. Bureau of Economic Analysis (BEA) has issued the following news release today:

Personal income increased $17.3 billion, or 0.1 percent, and disposable personal income (DPI) increased $12.9 billion, or 0.1 percent, in September, according to the Bureau of Economic Analysis.

The full text of the release on BEA's Web site can be found at
www.bea.gov/newsreleases/national/pi/pinewsrelease.htm

Thursday, October 27, 2011

Housing News Digest, October 27

Springs listed among best housing markets for 2012

Read more: http://www.gazette.com/articles/springs-127343-list-markets.html#ixzz1c09hmEdo

The Colorado Springs housing market, like many other communities around the country, has taken its lumps in recent years: falling home prices, rising numbers of foreclosures and a construction slowdown.

But the city’s housing market will stage a turnaround in 2012 and become one of the nation’s best, according to a national forecast by Builder Magazine.

The Springs ranks No. 7 on Builder’s Top 20 list of healthiest markets the magazine is projecting for next year. Builder publishes its Top 20 list twice a year — once for the current year and another that looks ahead — in conjunction with parent company Hanley Wood, a real estate media and information services firm. Their projections use Moody’s Economy.com data, which focus on jobs, price appreciation, population growth and other factors that drive housing.

Meritage Homes Reports 28% Increase in Third Quarter 2011 Sales Orders
Home closing revenue was lower in 2011 due to a 6% decline in average closing prices year-over-year, mainly attributable to a $15 million decline in closing revenue from California caused by reduced prices and fewer closings. That decline was only partially offset by higher closings in Texas, Colorado and Florida, where average prices are typically lower than California's.

Bank Watch: Billion-Dollar Community Banks of Colorado Fails
As of June 30, Community Banks of Colorado had $1.38 billion in total assets and $1.33 billion in total deposits.

About half of the bank's lending activities were directed at commercial real estate. It had $508 million in CRE loans outstanding. Its combined delinquent and restructured CRE loans and foreclosed properties totaled $147.4 million, about half of which was tied to construction and development loans.

Glendale Introduces Master Developer for the Glendale Riverwalk Project


GLENDALE, Colo., Oct. 26, 2011 -- /PRNewswire/ -- The City of Glendale announced INTEGRAL Real Estate Development, LLC as the Master Developer of the Glendale Riverwalk Project on Thursday, October 20th, at a reception held at Infinity Park in Glendale.

FHFA lowers GSEs bailout estimate
The Federal Housing Finance Agency said Fannie Mae and Freddie Mac may need to draw as much as another $142 billion in bailout funds from the Treasury Department by the end of 2014. That is down from prior estimates of $154 billion.

So far, the GSEs have drawn $169 billion from the Treasury under the terms of senior preferred stock purchase agreements. Subtracting the amount of dividends paid back to the Treasury so far, the GSEs still owe $142 billion.

Advance GDP 3rd Q estimate for US: 2.5%

The U.S. Bureau of Economic Analysis (BEA) has issued the following news release today:

Real gross domestic product -- the output of goods and services produced by labor and property located in the United States -- increased at an annual rate of 2.5 percent in the third quarter of 2011 (that is, from the second quarter to the third quarter) according to the "advance" estimate released by the Bureau of Economic Analysis. In the second quarter, real GDP increased 1.3 percent.

The full text of the release on BEA's Web site can be found at
www.bea.gov/newsreleases/national/gdp/gdpnewsrelease.htm

Latest COLA: 3.6%

The Social Security Administration has released the 2011 COLA amount: 3.6%

2005 4.1
2006 3.3
2007 2.3
2008 5.8
2009 0.0
2010 0.0
2011 3.6

See here.

Wednesday, October 26, 2011

New home sales in West up 20 percent in September

In September of this year, new single-family home sales rose slightly in the US, and rose in the West region, which includes Colorado. However, according to new data released by the Census Bureau today, new home sales in September were at the second-lowest September total recorded in at least ten years.

The report, which monitors sales activity for newly constructed houses, reported that in the West, new home sales were up year over year, increasing 20 percent to 6,000 in September 2011 from 5,000 new homes sold in September 2010. September of last year showed the lowest total for new home sales during the past ten years. Nationwide, sales rose 4.1 percent, increasing from 24,000 to 25,000 during the same period.

In the West, no month has shown fewer than 4,000 new home sales for the region during the past decade.

For the West region:


The second graph shows that new home sales continue to fall and have generally followed a downward trend since the middle of the decade.

New home sales peaked during the spring and summer of 2005 and have trended downward since. The number of new houses sold in the United States is down 80 percent since the peak of March 2005, and new home sales in the West have fallen 84 percent since sales peaked in the region during March 2004.


The third graph shows the declines in both US and regional totals in new homes for sale.

The number of new homes for sale has also fallen off considerably. The number of new houses for sale in the West has fallen 74 percent since the total peaked during June 2007, and the same total has fallen 71 percent in the US since the number of new homes for sale peaked in the US during August 2006.


The number of new single-family homes for sale in the West is near the lowest level it's been in more than ten years. This reflects very low demand in the face of an ongoing and large number of new foreclosures and low-priced properties in many areas of the West, including Colorado. Although foreclosures have fallen in Colorado in recent years, foreclosure rates remain at historic highs.

As a final note, we can also look to the new home inventory. In this case, we calculate inventory by subtracting the number of new home sales in a given month from the number of new homes for sale at the end of the previous month. In the final graph, we see that the inventory is now at a ten-year low for September with 28,000 homes. This is good news for owners of existing homes seeking to sell homes since it suggests that fewer new homes are sitting and waiting to be sold, thus diminishing some of the inventory-driven downward pressure on prices.

Housing News Digest, October 26

Homeownership too risky for many living on the edge in Durango
But local affordable-housing advocates increasingly are seeing clients who are homeless despite working several jobs or were once middle class until a job loss or medical problem threw them behind.

“If you lose your home in Durango, you are not in paradise,” said Sarada Leavenworth, division director for Volunteers of America, which operates the Durango Community Shelter.

The continuing recession combined with Durango’s low wages and limited job opportunities has prompted the city’s affordable-housing organizations to re-evaluate how they prioritize and regard homeownership. Currently, the Regional Housing Alliance of La Plata County advises prospective clients earning less than $30,000 annually that they would be better off renting.

Rocky Mountain Communities' First Annual Awards Breakfast

The 1st Annual Awards Breakfast, our first, honors an individual who deserves recognition for their service to the housing community while raising funds to support the work of Rocky Mountain Communities (RMC). Rocky Mountain Communities is pleased to recognize Dr. Gordon Von Stroh as the recipient of the Service to Community Award. Dr. Von Stroh has generously given his skill, wisdom and passion to Rocky Mountain Communities, Daniels College of Business, University of Denver, Apartment Association of Metro Denver, Department of Local Affairs, Central City Opera, and Cherokee Ranch and Castle Foundation, and many other organizations, associations, and individuals have been positively impacted by his work and commitment to Colorado.

Texas counties consider suing MERS over mortgage assignments, filing fees
Two Texas counties are contemplating a lawsuit against Mortgage Electronic Registration Systems for an alleged failure to pay mortgage assignment recording fees to local clerks' offices.

If Bexar County, which includes San Antonio, and Hidalgo County, which borders Mexico in South Texas, decide to sue, three Texas counties will have brought lawsuits against Reston, Va.-based MERS.

New Home Sales increase in September to 313,000
The Census Bureau reports New Home Sales in September were at a seasonally adjusted annual rate (SAAR) of 313 thousand. This was up from a revised 296 thousand in August (revised up from 295 thousand).

The first graph shows New Home Sales vs. recessions since 1963. The dashed line is the current sales rate.

Sales of new single-family houses in September 2011 were at a seasonally adjusted annual rate of 313,000 ... This is 5.7 percent (±18.4%)* above the revised August rate of 296,000, but is 0.9 percent (±16.3%)* below the September 2010 estimate of 316,000.

FHFA: House prices fall 7.5 percent in mountain region in August

House prices in August in the Mountain region, which includes Colorado, fell 7.5 percent, year-over-year. Nationally, the house price index fell 3.9 percent. The new house price index numbers, released yesterday by the Federal Housing and Finance Agency, also showed that the national index is down 18.5 percent from the peak level reached in June 2007, while the Mountain region's index is down 31.7 percent over the same period.

The FHFA monthly index is calculated using purchase prices of houses purchased with loans that have been sold to or guaranteed by Fannie Mae or Freddie Mac. It is a repeat-sales index similar to the Case-Shiller index, but limited to GSE loans.

The decline in house prices reflects overall trends also found in other home price indices such as the CoreLogic index and the Case-Shiller index. According to FHFA, prices have largely stabilized over the past several months, but remain slightly down from 2009 and 2010 levels.


The second chart shows each month's house price index compared to the same month a year earlier:


We can note that the Mountain region has performed more poorly (from a seller's perspective) than the national index. This runs contrary to some local experience and some statistics. The Case-Shiller data for the Denver metro area, for example shows that local prices did not decline as much as the national composite index following the financial panic in 2008. Also, the FHFA "expanded-data" index shows Colorado performing better than the national index.

Since we're looking at regional, data, however, we have to keep in mind that this data reflects house prices in Arizona and Nevada, and this no doubt will continue to put downward pressure on regional prices for now.

Nevertheless, the overall trend among most home price indices is one of slow downward movement in home prices. This trend includes Colorado statewide as well as the metro Denver area.

September layoffs: mass layoffs down 28 percent in 2011

Mass layoff events fell 28 percent to 75 events during the first nine months of 2011 in Colorado. There were 105 mass layoff events during the same period last year. According to a new report released yesterday by the U.S. Bureau of Labor Statistics, there were 7 mass layoff events during September 2011, which is down 30 percent from the 10 events reported during September of last year.

Monthly mass layoff events grew rapidly after October 2008 in Colorado, and have gradually lessened since early 2010.


Nationally, mass layoff events increased 29 percent from 920 during September 2010 to 1189 during September of this year.

In the year-to-date Colorado total for September, mass layoffs have now fallen two years in a row after peaking at 117 mass layoffs during the eight months of 2009. The second graph shows year-to-date totals for September since 2001:


Mass layoffs were rare from 2004 through most of 2008.

Overall, the most recent mass layoffs data suggests that the employment situation continues to stabilize. New layoffs continue to lessen, and as we've seen in the most recent employment data, September 2011 showed some of the strongest year-over-year growth in employment in 36 months.

New claims for unemployment insurance

New claims for unemployment insurance in Colorado fell year over year by 17 percent to 680 in September 2011. There were 827 new claims during September of last year. New claims for unemployment insurance have also gradually fallen since early 2010. Nationally, new claimants rose 50.9 percent during the same period.

In year-to-date totals for new unemployment claims in Colorado through September, totals are down 22 percent year over year. There were 7,626 new claims during the first nine months of 2011, compared to 9,897 new claims during the same period last year. In the year-to-date total for September, new claims for unemployment insurance have now fallen two years in a row after peaking at 11,8659 claims during the first nine months of 2009. The last graph shows year-to-date totals for September since 2001:


See the employment data archive for more on September's job creation.

The Mass Layoff Statistics (MLS) program collects reports on mass layoff actions that result in workers being separated from their jobs. Monthly mass layoff numbers are from establishments which have at least 50 initial claims for unemployment insurance (UI) filed against them during a 5-week period. Extended mass layoff numbers (issued quarterly) are from a subset of such establishments—where private sector nonfarm employers indicate that 50 or more workers were separated from their jobs for at least 31 days.

Case-Shiller: Home prices fall 14 months in a row

Case-Shiller released its home price index for August yesterday. The home price index for the Denver area rose 0.4 percent from July to August, and fell 1.6 percent,year over year, from August 2010 to August 2011. Prices increased in August due to seasonal factors, although the overall index for the year remains below the index values seen during 2010. As can be seen in the first graph below, home prices are not likely to match even the levels seen at seasonal peaks during 2009 and 2010.


According to S&P;'s press release, there is also some good news:

“In the August data, the good news is continued improvement in the annual rates of change in home prices. In spring and summer’s seasonally strong period for housing demand, we cautioned that monthly increases in prices had to be paired with improvement in annual rates before anyone could declare that the market
might be stabilizing. With 16 of 20 cities and both Composites seeing their annual rates of change improve in August, we see a modest glimmer of hope with these data. As of August 2011, the crisis low for the 10- City Composite was back in April 2009; whereas it was a more recent March 2011 for the 20-City Composite. Both are about 3.9% above their relative lows.


In year-over-year comparisons for August, Minneapolis showed the largest drop, with a decline of 8.5 percent, while the index in Phoenix fell 7.7 percent. Year over year, home price indices fell in 18 of the 20 cities included in the study. Only Washington, DC and Detroit showed increases.

The second chart shows trends in the Case-Shiller index for the Denver area and for the 20-city composite index. It is clear that Denver did not experience the kind of price bubble that occurred in many other metropolitan areas, and consequently, the index has not fallen nearly as far in Denver compared to the larger composite. Prices have been largely flat since mid-2009.


The 20-city composite is down 30.8 percent since it peaked in July 2006, but the Denver index is down only 9.8 percent from its August 2006 peak.

Nevertheless, the Denver index during August was at the lowest August value seen since 2003.

The third chart compares year-over-year changes in the Denver area index and in the 20-city composite. The Denver index did not achieve the rates of growth experienced by the national index, but the Denver index did not experience comparable rates of decline following the onset of the national recession either. Overall, the index has been less volatile in Denver than has been the case for the 20-city composite. However, year-over-year growth in the 20-city composite during August was negative with a decrease of 3.8 percent, and the Denver area index’s fall of 1.6 percent is the 14th month in a row in which the growth rate has been negative. In the 20-city index, the year-over-year change has been negative for the most recent 11 months.


The last chart provides a closer look at year-over-year changes in the Denver index. Note the the change has been below zero since June 2010, and likely reflects the end of the homebuyer tax credit’s end which has led to a fall in demand and a decline in the home price index. The upward trend in the index in response to the tax credit is clear during late 2009 and early 2010.


The chart shows that from July 2010 through August 2011, the home price index has been below the index for the same period a year earlier (July 2009 through January 2010). Given that 2009 was itself a weak year for home sales, this data does not suggest a speedy rebound for home prices.

Tuesday, October 25, 2011

New Northern Colorado Housing Snapshot


In addition to the Grand Junction and the Colorado Springs Housing Snapshots, we now have for you the Housing Snapshot for the Northern Front Range covering Weld and Larimer counties.

See the Housing Snapshot Archive.

November: Homeless and Runaway Youth Awareness Month

Colorado Homeless and Runaway Youth Awareness Month is a part of National Runaway Prevention Month and Homeless Youth Awareness Month. The National Runaway Switchboard and other national organizations as well as Colorado Statewide Advisory Committee on Homeless Youth promote this public awareness campaign each November in order to increase the awareness of the issues facing runaway and homeless youth, and to educate the public about solutions and the role they can play in prevehttp://www.blogger.com/img/blank.gifnt-ing youth from http://www.blogger.com/img/blank.gifrunning away.

See here for the complete brochure.

Assist a local homeless youth service organization near you. These organi-zations need your help to continue providing shelter, housing, outreach, and supportive services to homeless and runaway youth.

- Sponsor a fundraiser
- Collect donations
- Volunteer
- Mentor

Get a community action kit with more details and resources on how to help a homeless youth below.

www.1800runaway.org/rpm/media.html

Housing News Digest, October 25

Mortgage program likely to have little impact in Colorado
A bolstered program allowing more homeowners who are "under water" on their mortgages to qualify for refinancing is a step in the right direction but may have limited impact in Colorado, area brokers and financial experts said.

President Barack Obama on Monday announced the broadening of the Home Affordable Refinance Program. Before, the program was limited to homeowners who owed no more than 25 percent above the chttp://www.blogger.com/img/blank.gifurrent value of their homes. That limitation was eliminated and the process streamlined to make it less cumbersome and costly.

Business travelers opt for homier digs on the road
There are many luxurious amenities a business traveler enjoys while sleeping on the road: fluffy beds, room service, decked-out fitness centers and concierges.

These amenities make traveling more comfortable. But when it comes down to it, take it from Dorothy: There's no place like home.

Some business travelers say they prefer staying in furnished vacation rentals, corporate housing and inns versus hotels, particularly for lengthier stays.

Volunteer architects design worker housing projects
VAIL, Colorado— It is midnight when Rob Rydel looks around the room and wonders if he and the other volunteer architects can keep working for another hour.

They can, and do. As long as the band is together, they're gonna play.

A few dozen architects locked themselves in rooms and volunteered tens of thousands of dollars worth of time and talent to help design three public housing projects. It's called a Charrette and it's as much fun as architects can have with pens in their hands.

Drilling in Fast-Growing Areas Ushers in New Era of Tension
DENVER — The pattern is clear in the oil and gas business: drilling fields are going into new places. North Dakota, better known for growing wheat, is now booming with rigs. Fort Worth has upward of 2,000 gas wells right in the city itself, with most of that growth within just the last five years. Pittsburgh, facing the prospect of urban drilling, forbade it last year by a vote of the City Council.

'Underwater' homeowners on the rise
DENVER - Nearly one out of every five, or 21 percent of Colorado mortgages are currently 'under water,' or worth less than the amount owed.

These homeowners are the prime targets of President Obama's new mortgage financing plan. Along with potentially preventing foreclosures, the program aims at saving homeowners hundreds of dollars every month on payments.

Monday, October 24, 2011

New: Colorado Springs Housing Snapshot


Looking for a quick summary of the Colorado Springs housing markets? Here you go.

The latest regional Housing Snapshot is for the Colorado Springs area.

And here is the Housing Snapshot for Grand Junction.

Housing Snapshot archive.

Housing News Digest, October 24

Donations needed for 'Hope for Homeless Veterans' drive

DENVER - Help us bring Hope for Homeless Veterans by donating items for veterans on Thursday, Oct. 27 from 5:30 a.m. to 1 p.m. at 9NEWS. Anchor Gregg Moss will host this collection on our front driveway on 500 Speer Blvd.

Community Banks of Colorado fails; Bank Midwest to take over branches, deposits
The Federal Deposit Insurance Corp. has been appointed receiver for Community Banks of Colorado, and Bank Midwest NA of Kansas City will take over its deposits and branches, the FDIC announced late Friday.

Bank Midwest is a unit of Boston-based NBH Holdings Corp., formed by a group of institutional investors in 2009 specifically to buy troubled community banks.

US announces help for underwater homeowners

A leading housing regulator on Monday announced changes to a government refinancing program that could help up to one million homeowners of the estimated 11 million whose homes are worth less than their mortgage.

The Federal Housing Finance Agency, which oversees mortgage finance sources Fannie Mae and Freddie Mac, said it was easing the terms of the two-year-old Home Affordable Refinance Program, which helps borrowers who have been making mortgage payments on time but have not been able to refinance as home values have dropped.

Starting today, $100 down payments for HUD homes

It only takes a $100 downpayment for an owner-occupant to buy a HUD foreclosure in the Denver area.

Previously, it required a 3.5 percent downpayment. The $100 downpayment policy kicked off last Friday.

The new rule should boost the sale of homes owned by the U.S. Department of Housing and Urban Development, local experts said.

BofA Merrill Lynch analysts expect another US debt downgrade
The congressional super committee charged with cutting another $1.5 trillion from the federal deficit is likely to fail, which could prompt another ratings agency to downgrade the U.S. credit rating by year-end.

S&P; already downgraded the nation's triple-A credit rating over the summer after political wrangling over the debt ceiling sparked fears that the situation among lawmakers would create constant strife, delaying the ability for the nation to deal with its economic crisis.

Friday, October 21, 2011

Summary for week of October 17

Home prices still show few signs of rebounding, although the price declines show only slow and steady drops. Consumer prices headed up at the fasted pace since the boom times and the multifamily markets continue to look more and more dynamic as new housing starts surged in September across the West.

Employment

September was one of the best months for job growth in 42 months. The state added 34,000 jobs in September, compared to September of last year. The decline in the unemployment rate places Colorado 24th among all the states. The job market was best in the fort Collins area, and worst in the Grand Junction area.

Home Prices

Condo prices in the state show less resilience than do single-family home prices, although single-family prices continue to show slow and steady declines. As sales activity declined, however, regional remodeling activity increased. Regional existing home prices fell also, according to NAR, but sales activity was up, year over year.

Housing Starts

Multifamily housing starts surged in the region while single-family starts showed only mild increases.

Consumer Prices

Consumer price increases hit a 3-year high in the West during September.

Two other home price indices for Denver: RPX and FNC

We follow various home price indices as well as the Metrolist data, as can be seen here.

There are other additional home price indices as well. Two more were released today, with both reinforcing the general trends we've already identified. Namely, home prices continue to fall slowly in the range of 3 to 5 percent, while home sales transactions in 2011 will be similar to 2010 totals.

Both indices contain information specific to the Denver metro real estate market, and both show continued declines in home prices.

According to the RPX index, found online here:

The year-over-year change in the composite price index (which includes 25 metro areas), continued to be negative and was down 4.7 percent during August 2011 compared to August 2010.

In the Denver area, the change during the same period was negative 3.2 percent, which placed it seventh among the 25 metro areas included in the index. The only metro areas that showed increases were Washington, DC, Detroit and Boston.

The 25-city composite index was also down from July 2011 to August 2011, with a drop of 0.8 percent. In the Denver area, the price index dropped 0.4 percent during the same period.

According to the report, this signals that seasonal price declines have already begun, and notes that prices are likely to decline through the end of the year.

The RPX report also provides information on home sales, and also noted that sales totals have begun to move toward winter lows.

As we noted with our discussion of Metrolist data, found here, there is likely to be a similar number of sales transactions this year compared to last year. This is in spite of last year's bump in buying due to the tax credit. As noted in the RPX report:

"If home sales decline according to their typical seasonal pattern, the year-over-year gain will disappear by year end."


The year-over-year change in transactions was +13 percent in the 25 metro area composite index. In the Denver area, the change was +16.2 percent during the same period. This places Denver as 10th among the 25 metro areas in percentage change. In Boston, for example, the change in transaction totals was 48 percent, year-over-year.

As metro markets headed toward winter lows in transaction counts, the composite index fell 16 percent from July to August. In the Denver area, transaction counts dropped 8.9 percent during the same period.

The FNC home price index was also released and showed a year-over-year change of 2.2 percent in home prices. This places it 24th among the 30 metro areas contained in the report. In other words, home prices fell more in the Denver area than in most of the other metro areas recorded by FNC.

FNC showed the comparative position of the Denver area as being somewhat worse than some other reports such as Case-Shiller. Case-Shiller often shows the Denver areas as having the 4th or 5th highest increase in home prices among 20 metro areas.

According to the FNC report, the decline in prices occurred in spite of a year-over-year increase in home sales transactions. We found this to be the case in the Metrolist data as well.

According to the FNC report:

Oxford, Miss. (October 20, 2011) - FNC’s latest Residential Price Index, released Thursday, indicates U.S. home prices declined in August despite strong existing home sales during the month. This decline reverses a modest fourth-month long seasonal uptrend. Amid weak economic fundamentals, home prices -- as well as a number of key leading housing indicators including new housing starts and building permits -- signal a likely scenario of continued housing weakness in the months ahead.


For a complete listing of recent home price articles, see here.

Housing News Digest, October 21

Real estate agents learning fine art of 'cash for keys'
For real estate agents across the country, getting people to move out of their homes without a costly and time-consuming eviction is increasingly part of the job description.

Sales of so-called “distressed” properties, meaning those in or near foreclosure, make up about 30 percent of home resales in today’s extremely depressed housing market.

Fighting back against online real estate sites
The Internet has become an integral part of everything we do, and for the past few years that has included the purchase and sale of real estate.

Well, the real estate industry nowadays isn't taking it anymore.

Websites such as Zillow.com and Trulia.com are fine, real estate brokers and agents say, but only to a point.

Sweet spot for home sales below $300,000
It probably won’t surprise anyone in the real estate industry, but most of the sales activity in the Denver area is for homes priced below $300,000.

A report released today by independent broker Gary Bauer confirmed that price-point trend.

His 11-county report found that homes priced at $299,999 or less accounted for 71 percent of all closed transactions in the first three quarters of this year.

Mortgage delinquency rate declines, foreclosure inventory rises: LPS
Mortgage delinquencies declined slightly to 8.09% in September from the previous month, according to the Lender Processing Services' (LPS: 15.25 -0.13%) first look at the monthly statistics in its loan-level database of nearly 40 million mortgages.

The rate was down 0.5% from August and 12.7% lower than year-ago figures, according to the Jacksonville, Fla.-based provider of technology, data and analytics to the mortgage and real estate industries.

Senate votes to extend jumbo conforming loan limits
The Isakson-Menendez amendment would extend the limits through 2013.

Congress elevated the conforming loan limits in 2008 to allow the Federal Housing Administration, Fannie Mae, and Freddie Mac to insure and guarantee more mortgages when the credit markets froze.

Colorado 24th in nation for unemployment during September

The Bureau of Labor Statistics today released employment information on all states.

According to the BLS press release:

Regional and state unemployment rates were generally little changed in September. Twenty-five states recorded unemployment rate decreases, 14 states posted rate increases, and 11 states and the District of Columbia had no rate change, the U.S. Bureau of Labor Statistics reported today. Thirty-eight states registered unemployment rate decreases from a year earlier, 10 states and the District of Columbia had increases, and 2 states experienced no change. The national jobless rate was unchanged at 9.1 percent, but was 0.5 percentage point lower than a year earlier.


Colorado was maong the 25 states that reported decreases in the unemployment rate. 23 states reported unemployment rates that were higher than Colorado's, including California, Nevada, Florida and Michigan.

Colorado's unemployment rate has moved below the national rate for the sixth month in a row following a three month period(January-March 2011) during which Colorado's unemployment rate was higher than the nation's. Prior to January 2011, the unemployment rate in Colorado had been below the national rate for several years.

The graph shows a comparison between the two rates since 2006:


The unemployment rate in Colorado fell from August to September, dropping from 8.5 percent to 8.3 percent, according to the seasonally-adjusted numbers. The national rate also held steady at 9.1 percent.

The BLS map below shows state-by-state comparisons.


Within the Rocky Mountain region, Colorado has the third highest unemployment rate:
Arizona, 9.1%
Colorado, 8.3%
Idaho, 9.0%
Montana, 7.7%
New Mexico, 6.6%
Utah, 7.4%
Wyoming, 5.8%

With Colorado's unemployment rate below the national rate, Colorado may continue to be seen as a desirable location for job seekers. This may in turn impact overall household formation in Colorado and the demand for housing.

Colorado remains in the middle of the pack when it comes to statewide unemployment rates. At the regional level, however, Colorado contains some metro areas that have unemployment rate well below the national rate, such as the Boulder area and the Fort Collins area.

September 2011 employment in Colorado: regional comparisons

Total employment in the state in September was up for the third month in a row in the year-over-year comparisons. In September, total employment in Colorado was down 129,000 from the July 2008 peak. Employment trends in various regions of the state differ, however, so this article looks at which regions of the state have the highest unemployment rates, and which regions have recovered the most in their labor markets.

Regional employment trends can also provide us with some insights into local housing demand since, all things being equal, those areas with the most robust labor demand will also have the strongest demand for housing. This would be reflected in apartment vacancy rates and in median home price and home sales transactions, among other indicators.

The first graph compares unemployment rates in Colorado's metro areas.

The regional unemployment rates (not seasonally adjusted) for August 2011 are:
Colorado Springs, 8.6%
Denver-Aurora, 7.8%
Fort Collins-Loveland, 6.0%
Grand Junction, 8.5%
Greeley, 8.6%
Pueblo, 9.4%
Statewide, 7.6%


Since mid-2009, The Fort Collins-Loveland area has consistently shown one of the lowest unemployment rates while Grand Junction and Pueblo have generally shown the highest rates.

Year over year, the unemployment rate decreased in all metro areas. In Pueblo, where the highest metro unemployment rate was found, the rate decreased from 10.2 percent to 9.4 percent, year over year. In the Fort Collins-Loveland area, where the rates were lowest, the unemployment rate fell from 6.6 percent to 6.0 percent during the same period.

The unemployment rate is a reflection of both the total number of employed persons and the total size of the labor force, so the unemployment rate can decrease even in times of falling total employment if the size of the labor force decreases as well.

To provide some additional context, we can look to see how far below total employment levels are below the most recent peak in employment in each region. The peak time differs in each region. For example, the labor market peaked in mid-2007 in the Colorado Springs area, but it did not peak until late 2008 in the Grand Junction area.

The following numbers reflect how far below the most recent peak are the September 2011 employment totals:

Colorado Springs MSA, 6.9%
Denver-Aurora MSA, 5.1%
Fort Collins-Loveland MSA, 1.7%
Grand Junction MSA, 12.5%
Greeley MSA 5.0%
Pueblo MSA, 1.2%

All things being equal, the areas further below the peak have recovered the least from initial job losses.

By far, Grand Junction remains the furthest below peak levels.

Pueblo is now only 1.2 percent below peak levels, although Pueblo already had a relatively weak job market during the peak period, which would explain why Pueblo continues to be among the areas with the highest unemployment rates. The Fort Collins-Loveland area, on the other hand, now 1.7 percent below its peak, and is also the metro area with the lowest unemployment rate.

(Note: If we include the Boulder-Longmont MSA, we find that the Boulder area has consistently been among the areas with the lowest unemployment rate. In September 2011, the rate in the Boulder-Longmont area was 5.9%.)

Impact on Housing

The metro areas with the most job growth should generally also be the areas with the most demand for housing. We do see this reflected to a certain extent in the apartment vacancy data and in job growth.

We expect the demand for housing to continue to be strongest in the Fort Collins-Loveland area and in metro Denver.

Employment growth in Colorado hits 42-month high

Colorado gained 34,298 jobs in September 2011 compared to September of last year, and the non-seasonally-adjusted unemployment rate fell year-over-year from 8.4 percent to 7.6 percent. According to the most recent employment data, released today by the Colorado Department of Labor and Employment, total employment in September, not seasonally adjusted, rose to 2.502 million jobs. There were also 15,000 more people in the work force during September, compared to September 2010.


From September 2010 to September 2011, total employment rose 1.38 percent, while the labor force rose 0.55 percent. The total labor force in September included 2.71 million workers.

As can be seen in the second graph, total employment and total workforce size have increased month-over-month. Year over year, both total employment and the labor force rose together for the first time since August 2008. However, both remain well below the July 2008 peak.


The employment total is now 129,000 jobs below the peak levels experienced during July 2008 when there were 2.63 million employed workers. Compared to the labor force peak in July 2008, the labor force is now down by more than 57,500 workers.

In the third graph is shown the year-over-year comparisons, by percent, for total employment. September 2011 was the third month in a row showing a positive year-over-year change in total employment. This followed 33 months in a row of negative job growth in year-over-year comparisons. At 1.3 percent, the year-over-year percent change in total employment hit a 42-month high in September 2011. Between August 2008 and July 2011, no month posted a positive change in total employment when compared to the same month a year earlier.


The graph also shows the year-over-change in the labor force. Total labor force size rose from September 2010 to September 2011, and was the first time that the labor force has grown, year over year, since June 2009 . The labor force size had shrunk, year over year, for 26 months in a row from July 2009 to August 2011.

These numbers come from the Household Survey employment data, so the size of the workforce is dependent on the number of people stating that they are actively looking for work if not employed. Discouraged workers who have stopped looking for work are excluded.

The increase in employment, according to the Household Survey, is apparently being driven, at least somewhat, by an increase in self-employment. According to the Bureau of Labor Statistics, the Establishment Survey of employment, which is based on surveys of major employers, showed a decline of 3,900 payroll jobs in September. The Household Survey, on the other hand, showed a gain in jobs. So, it seems that at least some of the payroll positions lost are being replaced by jobs that are not tracked by the establishment survey. The Denver Business Journal reports on it here.

Thursday, October 20, 2011

Tomorrow: latest employment data for Colorado and metro areas

Check back to the blog tomorrow for the latest analysis of employment data in Colorado and its metro areas. The data for September will be released by the Colorado Department of Labor and Employment tomorrow morning.

Metro Denver condo and townhome prices down 19.7 percent since 2006

Most of the home price indices, such as those from Case-Shiller and FHFA, focus on single-family homes. The MLS data that I've typically posted here at divisionofhousing.com has also generally focused on single-family homes.

CoreLogic's home price index does include some information on attached housing as can be seen here. And, we'll now more regularly post MLS information on condos and townhomes as it becomes available.

Here I've presented the Realtor Association's MLS data for Colorado through August 2011.

In the first graph, we see that median prices for condos and townhomes have decreased consistently since the second half of 2006. Prices in the metro Denver and Pikes Peak regions are both down 19 percent from peak levels while prices statewide are down 47 percent. The larger decline in condos and townhomes is likely the result of sizable drops in condo and townhome prices in mountain communities over the last three years.


Prices in single-family homes, on the other hand, have not dropped so consistently in the markets examined here. In the case of single-family homes, and in the case of metro Denver especially, prices didn't show a downward trend until mid-2007. Prices then began to recover in early 2009. See here for more.

In the second graph, we see that the number of condo and townhome sales transactions are well below levels seen before 2008. Here, as with home prices, we see a deterioration in the market that began before the single-family markets began to show similar drop-offs.


It looks like overall, the total number of closings statewide will be about equal in 2011 compared to what it was during 2010. Closings are up slightly from 2009. Statewide there were 8819 closings from Janaury to August of this year, and 8826 closings during the same period last year. There were 8370 closings during 2009. (The distribution of sales among the different months is quite different from 2010 to 2011 due to the end of the homebuyer tax credits in April 2010.)

Metro Denver has fared slightly worse in closings, and 2011 is likely to end with fewer condo and townhome closings than during 2010. There were 5456 closings in metro Denver form January through August of this year. There were 5821 closings during the same period of last year, and 5747 during the same period of 2009.

Comparisons

The third graph shows the metro Denver median price in single-family homes vs the median price in condo/townhome prices. Obviously, the condo/townhome price is lower, and condo/townhome prices have tended to be about 60 percent of the single-family price.

Also, we can note that the median price in single-family homes has been largely flat since mid-2009 while it has continued to fall among condos and townhomes. As noted above, condo/townhome prices are down 19 percent from peak levels, although single-family prices in metro Denver are down only 10 percent.


There are also far fewer condo/townhome sales transactions than there are single-family transactions in most metro areas. In metro Denver, for example, single-family transactions are about 75%-80% of all transactions while condo/townhome transactions are generally about 20%-25% of all transactions.

Home sales up 14.3 percent, prices fall 4.5 percent in US West region

Home prices in the West region of the U.S., which includes Colorado, fell 4.5 percent from September 2010 to September 2011. According to new existing home sales data, released today by the National Association of Realtors, the median home price fell more in the West than in any other region. The median home price in the Midweset, for example, fell 1.4 percent from September 2010 to September 2011.

The first graph shows median home prices for all regions plus the U.S. The median home price in the West during the past six months has ranged from $191,000 to $208,000. The median price was $207,400 during September 2011, and during September of 2010, the median price for the region was $217,100.


Nationally, home prices fell 3.5 percent, year over year.

Home sales transactions (closings) rose 14.3 percent in the West region, which was close to the national change in closings of 14.6 percent, year over year. Home sales rose 20 percent in the Midwest from September 2010 to September 2011.

The second graph shows closings by region. In general, closings increased each month from January 2011 to June 2011. July's total fell unexpectedly, but rebounded in August, and then declined again in September. Sales are now expected to decline each month until next January due to seasonal factors. While all regions except the northeast showed a month-over-month decrease from August to September, all regions showed increases in the year-over-year comparisons for September.

Overall, September's sales activity was higher than was the case during September of last year. This was expected. During the summer of 2010, sales activity fell significantly following the end of the home buyer tax credits. Many homeowners rushed to close their home sales by June 2010 in order to take advantage of the tax credit. Consequently, the second half of 2010 showed diminished home sales activity.


The NAR data tends to be the most optimistic among the various reports on home prices and home sales activity. Most recent home price indices, such as those provided by CoreLogic and Case-Shiller, indicate continued declines in price.

Conclusions: As can be seen in the first graph, home prices during recent months are down from where they were a year earlier, and the median price in the West is still below the annualized median prices for 2008, 2009 and 2010. The region shows stability in prices and a lack of significant upward pressure in prices right now.

Closings continue to be hampered by a lack of available financing and, according to the NAR release, by a significant number of cancellations on home purchases. According to the NAR press release:

Lawrence Yun, NAR chief economist, said the market has been stable although at low levels, and there is plenty of room for improvement. “Existing-home sales have bounced around this year, staying relatively close to the current level in most months,” he said. “The irony is affordability conditions have improved to historic highs and more creditworthy borrowers are trying to purchase homes, but the share of contract failures is double the level of September 2010. Even so, the volume of successful buyers is higher than a year ago and is remaining fairly stable - this speaks to an unfulfilled demand.”.

Industry employment trends in Colorado since 2007

New employment information for September will be available on Friday. Before those numbers, come out, however, we can take a quick look at employment trends in various industries. These numbers are based on employment totals through august 2011.

Employment growth by industry is important because it can give us some idea of whether or not job growth is occurring in traditionally high-wage industries or low-wage industries.

In the first graph, one of the first things we notice is that jobs in the construction industry are down considerable over both the last three years and the last five years. Over the past five years, construction jobs in Colorado have declined by almost 36 percent, and they've dropped by more than 15 percent over the past three years. This change reflects a drop of about 41,000 jobs since 2007.


Mining and logging, on the other hand has shown a significant increase, but this industry is much smaller, and the 22 percent increase in jobs since 2009 reflects an increase of only 5,000 jobs. The construction industry now employs about 113,000 workers while mining and logging employs about 28,000 workers.

Two of the largest industries in the state, and two industries in which growth has been positive in recent years, are health care, and leisure and hospitality. Growth has been positive in both industries in both 3-year and 5-year time spans. Leisure and hospitality has added about 25,000 jobs since 2007 while health care has added about 35,000 jobs during the same period.

The second graph shows general trends in total employment in five industries since Janaury 2007. Construction and manufacturing are down while health care and leisure and hospitality are up. Retail trade has been largely flat.


The fact that so much growth has occurred in leisure and hospitality suggests that there is a growing need for housing for workers who earn wages on the low end. Health care jobs, on the other hand tend to be more mixed, although this industry can also include a large number of low wage workers such as orderlies.

The loss of so many jobs in construction, which has traditionally been an industry that provides relatively high wages to workers with limited educational levels, will likely have an overall negative impact on aggregate wages.

Housing News Digest, October 20

NoCo residential listings down; median prices firming up in some areas
Residential real estate listings are down in all three Northern Colorado areas monitored by the multiple listing service Information and Real Estate Service. The good news is that median prices are up in some parts of the region.

In the Fort Collins area, single-family detached listings decreased to 1,243 in September from 1,310 in August and from 1,390 in September 2010.

Median sales prices decreased for detached units in Fort Collins, from $268,700 to $242,460 year-over-year in September.

Bybee resigns from Metrolist
Some top brokers, privately, said that Bybee’s resignation opens an opportunity to create a regional, statewide or even participating in a national MLS system.

“Metrolist has a myriad of problems,” said one broker, who talked on the condition that he not be identified. “Everything they’ve been doing has been putting a Band-Aid on legacy programs. Now, they have an opportunity to move forward in a way to better serve Realtors and to better serve consumers. We have too many MLSs. What really need is a statewide MLS - or even a nationwide MLS - and this provides an opportunity to move in that direction.”

Long-time Realtor Jeff Bernard shared some of those sentiments, although he emphasized he is fond of Bybee on a personal level.

Solera sells for record $37 million
A New Jersey based company today paid $37 million for Solera, the 11-story, 120-unit luxury high-rise in downtown developed by Denver-based Zocalo Community Development.

The price of $308,333 per unit the Connell Co. of Berkeley Heights, N.J. paid for the energy efficient building at 1956 Lawrence St. is a record in Colorado. It also is a record on a price-per-square-foot basis. The building, developed by Zocalo and Principal Real Estate Investors, includes 5,200 square feet of retail space.

Solera also is downtown Denver’s first Gold-certified LEED, or Leadership in Energy and Environmental Design, apartment tower. The building opened a year ago.

Renters Outspend Owners on Housing
Renters now spend five percent more of their household budgets on housing costs than do homeowners, and the difference is growing as rents rise.

Since 2005, homeowners' expenditures for housing have risen from 31.9 percent of their household budget to 33.2 percent, but renters' costs have risen even more from 35.6 percent to 38.4 percent, according to the October CoreLogic U.S. Housing and Mortgage Trends.

Since 1985, homeowners have increased their housing expenditure allocation by 12 percent, while renters increased by 22 percent.

Existing home sales fall 3% in September
Existing home sales fell 3% in September, but remain above year ago levels, the National Association of Realtors said Thursday.

During the month of September, existing home sales reached a seasonally adjusted annual sales rate of 4.91 million units, down from 5.06 million in August, NAR said.

That is still up 11.3% from 4.41 million units in September of last year.

Wednesday, October 19, 2011

$105,009 awarded in Mesa County

The Department of Local Affairs has announced that $105,009.00 in HOME Investment Partnerships Program (HOME) funds has been awarded to Mesa County for the following project:

Housing Resources of Western Colorado has been awarded a $105,009 grant to fund project delivery costs including salaries, benefits, and overhead for their on-going Single Family Owner Occupied Rehabilitation program (SFOO). HRWC will use the existing revolving loan fund to make 14 rehabilitation loans in the 2011/2012 program year. The rehabilitation loans will be provided to households qualifying at or below 80% of AMI.

$363,024 awarded in San Juan County

The Department of Local Affairs has announced that $363,024.00 in Community Development Block Grant (CDBG) funds has been awarded to San Juan County for the following project:

San Juan County, on behalf of Housing Solutions for the Southwest (HSSW), has been awarded a grant of $363,024, to support their on-going Single Family Owner Occupied Rehabilitation (SFOO) Program for the upcoming 2011/2012 year of operation. This program will provide 14 new rehabilitation loans, and emergency repairs for two units. Of the total award, $198,700 will be used to make new loans, and $164,324 will fund project delivery and general administrative expenses proportional to the Rehab program.

$105,226 awarded in Delta County

The Department of Local Affairs has announced that $105,226.00 in Community Development Block Grant(CDBG) funds has been awarded to Delta County for the following project:

Delta County, on behalf of the Delta Housing Authority, has been awarded a grant of $105,226 to support their ongoing housing rehabilitation program for the upcoming year 2011/2012. This program will provide and administer fifteen new housing rehabilitation loans. DHA uses the revolving loan fund that was established to serve State Planning Region 10 to fund the rehabilitation loans. Intergovernmental agreements are in place to serve Montrose, San Miguel and Ouray Counties, as the program expands from Delta County. This grant will fund program delivery costs and general administrative costs proportionate to the rehabilitation program.

CitiMortgage: Homeowner assistance event this Friday

A note sent to us from Citi:

CitiMortgage invites you to meet in person to review your homeowner assistance options at the Citi® Road to Recovery event. Meet one-on-one to discuss possible mortgage solutions available for your specific situation.
Friday, October 21, 2011
12:00 PM - 7:00 PM
Sheraton Denver Tech Center Hotel
7007 South Clinton Street
Greenwood Village, CO 80112

For us to best assist you at the event, you will need to bring certain documents to help us determine what programs may be available. Please be sure to download the attached forms by clicking here. Fill them out and bring them with you to the event. If you are unable to print the attached forms, or have questions regarding them, additional copies and assistance will be available at the event.

For more, see here.