Foreclosure free ride: 3 years, no payments
NEW YORK (CNNMoney) -- Delinquent borrowers facing foreclosure are learning that they can stay in their homes for years, as long as they're willing to put up a fight.
Among the tactics: Challenging the bank's actions, waiting to file paperwork right up until the deadline, requesting the lender dig up original paperwork or, in some extreme cases, declaring bankruptcy.
2011 was a good year for real estate market
Recent headlines about the national housing market certainly seem to be in conflict with one trumpeting "Good Signs for the Real Estate Market" and another "Home Prices Down in Most Cities." Or how about "New Home Construction Bounces Back - Soars 9.3 percent in November" versus "Home Sales Remain Weak."
And to add to the confusion, the National Association of Realtors just revised its annual home sales report knocking down annual sales 14.3 percent from 2007 through 2010.
PulteGroup offloads Colorado land assets
Homebuilder PulteGroup Inc. (PHM: 6.3701 +0.95%) sold Colorado land slated for 1,500 residences to private real estate investment firm Wheelock Street Capital LLC.
The move is part of an ongoing initiative to push for greater returns on its invested capital.
Colorado Crossing at standstill, but revival possible
Colorado Crossing, which became one of Colorado Springs’ biggest real estate busts in recent memory, remains a ghost town on the city’s north side after development of the 150-acre mixed-use project came to a halt three years ago.
However, various steps have been taken over the last several months in U.S. Bankruptcy Court in Denver and in 4th Judicial District Court in Colorado Springs to position Colorado Crossing for a revival — although the project’s resurrection remains at least a year away at the earliest and it’s uncertain what direction it would take if work resumes.
HOW TO PLAY IT: Signs of life in the housing market
Recent reports paint a mixed picture. In a sign of renewed demand, sales of existing homes hit a one-and-a-half year high in November. Still, home prices have fallen for 13 consecutive months and any recovery would come from a very low level.
In the past there have been false signs that the worst of the housing bust had passed, but if housing is finally improving, it could be a boon for investors. Here are targeted real estate plays for the new year.
Friday, December 30, 2011
Wednesday, December 28, 2011
Housing News Digest, December 28
La Plata County among areas seeing increase in older population
Liz Volz moved to Durango six years ago to take care of her mother and hasn’t left since. The 63-year-old is active and dabbles in nutritional consulting, bicycling and Buddhism. She lives in Cedar View Apartments, which provides subsidized housing to people 62 or older, and often gets help from La Plata County’s senior outreach nurse to fill out paperwork and find health-related resources.
Tom Royer checks in visitors to a Christmas luncheon at the Pine River Senior Center. As the population ages, many local officials say governmental budgets will have to be adjusted to meet their needs. And the adjustments that will need to be made might be bigger in Colorado because the state historically tended to have a younger population.
Briargate developer Lew Christensen dies at 75
Longtime Colorado Springs real estate developer and businessman Lew Christensen had many close friends after living in the city for 41 years. But he also had a relationship with the community that extended beyond the people he knew.
Through leadership roles with several business and civic groups, Christensen touched the lives of thousands in the Pikes Peak region as he sought to make it a better place to live and work, his friends say
Major Lenders Offering Perks on Short Sales
The nation’s leading mortgage lenders are extending extras for short sale transactions employed as an alternative to foreclosure - both in the form of monetary incentives for borrowers and streamlined procedures for real estate agents.
Trepp expects banks to face stronger headwinds in 2012
U.S. banks weathered huge storms in the past few years, but bigger risks lie ahead as benefits from releases on loan-loss reserves give way to a market environment where banks are forced to fight for new revenue and maintain profitability, Trepp said in its 2012 banking outlook report.
"Banks will earn less, putting 2012 a bit behind 2003 in terms of overall industry profitability," said the commercial real estate data analytics firm, which "does not expect 2012 to be a repeat of 2008, but there will be more disappointments than pleasant surprises in the new year."
Tuesday, December 27, 2011
$128,188 awarded in Jefferson County
The Department of Local Affairs has announced that $128,188.00 in Housing Development Grant (HDG)funds has been awarded to Jefferson County for the following project:
The Jefferson Center for Mental Health (JCMH) was awarded a grant of $128,188 to rehabilitate Towers Apartments, which they purchased in October 2010. It has 12 units - 2 studios and 10 one bedroom apartments. These apartments will be available to people who receive services at JCMH and who have demonstrated their readiness for independent living. JCMH property management will provide building supervision, and JCMH case managers will support their consumers to ensure their success in this environment. Rehab work will include replacing the old boiler, updating bathrooms & the laundry room, replacing unit entry doors, landscaping (to correct drainage & fix the sprinkler system), and repairing common area stairs & flooring.
The Jefferson Center for Mental Health (JCMH) was awarded a grant of $128,188 to rehabilitate Towers Apartments, which they purchased in October 2010. It has 12 units - 2 studios and 10 one bedroom apartments. These apartments will be available to people who receive services at JCMH and who have demonstrated their readiness for independent living. JCMH property management will provide building supervision, and JCMH case managers will support their consumers to ensure their success in this environment. Rehab work will include replacing the old boiler, updating bathrooms & the laundry room, replacing unit entry doors, landscaping (to correct drainage & fix the sprinkler system), and repairing common area stairs & flooring.
Case Shiller: Denver home price index in October at 10-year low
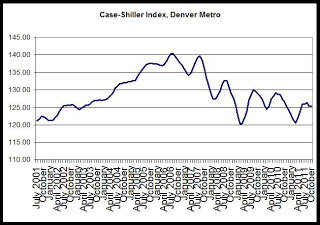
Case-Shiller released its home price index for October today. The home price index for the Denver area fell 0.2 percent from September to October, and fell 0.9 percent,year over year, from October 2010 to October 2011. Prices fell in October due at least partially to seasonal factors, although the overall index for the year remains below the index values seen during 2010. As can be seen in the first graph below, home prices during 2011 did not match even the levels seen at seasonal peaks during 2009 and 2010.
According to S&P;'s press release, home prices are still facing headwinds:
In year-over-year comparisons for October, Atlanta showed the largest drop, with a decline of 11.7 percent, while the index in Minneapolis fell 8.4 percent. Year over year, home price indices fell in 18 of the 20 cities included in the study. Only Washington, DC and Detroit showed increases.
The second chart shows trends in the Case-Shiller index for the Denver area and for the 20-city composite index. It is clear that Denver did not experience the kind of price bubble that occurred in many other metropolitan areas, and consequently, the index has not fallen nearly as far in Denver compared to the larger composite. Prices have been largely flat since mid-2009.
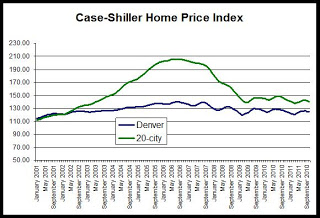
The 20-city composite is down 32 percent since it peaked in July 2006, but the Denver index is down only 10 percent from its August 2006 peak.
Nevertheless, the Denver index during October was at the lowest October value seen since 2002.
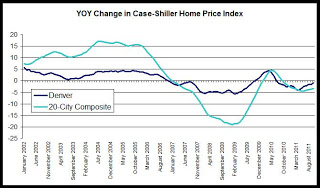
The third chart compares year-over-year changes in the Denver area index and in the 20-city composite. The Denver index did not achieve the rates of growth experienced by the national index, but the Denver index did not experience comparable rates of decline following the onset of the national recession either. Overall, the index has been less volatile in Denver than has been the case for the 20-city composite. However, year-over-year growth in the 20-city composite during October was negative with a decrease of 3.4 percent, and the Denver area index’s fall of 0.9 percent is the 16th month in a row in which the growth rate has been negative. In the 20-city index, the year-over-year change has been negative for the most recent 13 months.
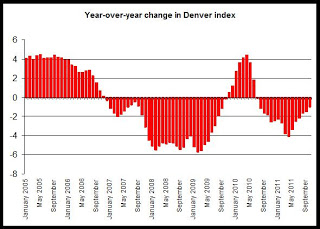
The last chart provides a closer look at year-over-year changes in the Denver index. Note the the change has been below zero since June 2010, and likely reflects the end of the homebuyer tax credit’s end which has led to a fall in demand and a decline in the home price index. The upward trend in the index in response to the tax credit is clear during late 2009 and early 2010. Since the end of the credit, however, home prices have consistently drifted downward.

According to S&P;'s press release, home prices are still facing headwinds:
And even though some of the annual rates are improving, 18 cities and both Composites are still negative. Nationally, home prices are still below where they were a year ago. The 10-City Composite is down 3.0% and the 20-City is down 3.4% compared to October 2010.
In the October data, the only good news is some improvement in the annual rates of change in home prices, with 14 of 20 cities and both Composites seeing their annual rates of change improve. The crisis low for the 10-City Composite was back in April 2009; whereas it was a more recent March 2011 for the 20-City Composite. The 10-City Composite is about 2.4% above its relative low, and the 20-City Composite is about 1.9%.
In year-over-year comparisons for October, Atlanta showed the largest drop, with a decline of 11.7 percent, while the index in Minneapolis fell 8.4 percent. Year over year, home price indices fell in 18 of the 20 cities included in the study. Only Washington, DC and Detroit showed increases.
The second chart shows trends in the Case-Shiller index for the Denver area and for the 20-city composite index. It is clear that Denver did not experience the kind of price bubble that occurred in many other metropolitan areas, and consequently, the index has not fallen nearly as far in Denver compared to the larger composite. Prices have been largely flat since mid-2009.

The 20-city composite is down 32 percent since it peaked in July 2006, but the Denver index is down only 10 percent from its August 2006 peak.
Nevertheless, the Denver index during October was at the lowest October value seen since 2002.
The third chart compares year-over-year changes in the Denver area index and in the 20-city composite. The Denver index did not achieve the rates of growth experienced by the national index, but the Denver index did not experience comparable rates of decline following the onset of the national recession either. Overall, the index has been less volatile in Denver than has been the case for the 20-city composite. However, year-over-year growth in the 20-city composite during October was negative with a decrease of 3.4 percent, and the Denver area index’s fall of 0.9 percent is the 16th month in a row in which the growth rate has been negative. In the 20-city index, the year-over-year change has been negative for the most recent 13 months.

The last chart provides a closer look at year-over-year changes in the Denver index. Note the the change has been below zero since June 2010, and likely reflects the end of the homebuyer tax credit’s end which has led to a fall in demand and a decline in the home price index. The upward trend in the index in response to the tax credit is clear during late 2009 and early 2010. Since the end of the credit, however, home prices have consistently drifted downward.

New home sales return to ten-year low in West during November
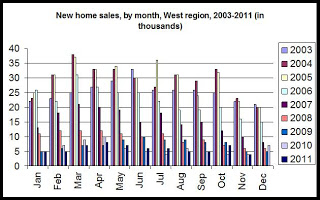
In November of this year, new single-family home sales rose in the US, and were unchanged in the West region, which includes Colorado. However, according to new data released by the Census Bureau on Friday, new home sales in November were back at the lowest November total recorded in at least ten years.
The report, which monitors sales activity for newly constructed houses, reported that in the West, new home sales were flat year over year, with 4,000 sales in November 2011. There were 4,9000 sales during November 2010. Nationwide, sales rose 10 percent, increasing from 20,000 to 22,000 during the same period.
In the West, no month has shown fewer than 4,000 new home sales for the region during the past decade.
For the West region:
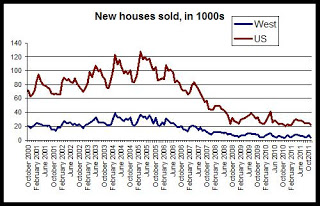
The second graph shows that new home sales continue to fall and have generally followed a downward trend since the middle of the decade.
New home sales peaked during the spring and summer of 2005 and have trended downward since. The number of new houses sold in the United States is down 82 percent since the peak of March 2005, and new home sales in the West have fallen 89 percent since sales peaked in the region during March 2004.
The third graph shows the declines in both US and regional totals in new homes for sale.
The number of new homes for sale has also fallen off considerably. The number of new houses for sale in the West has fallen 74 percent since the total peaked during June 2007, and the same total has fallen 72 percent in the US since the number of new homes for sale peaked in the US during August 2006.
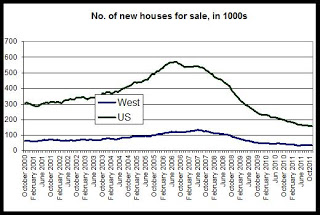
At 34,000, the number of new single-family homes for sale in the West is near the lowest level it's been in more than ten years. No month has shown fewer than 33,000 new homes for sale during the past decade. This reflects very low demand in the face of an ongoing and large number of new foreclosures and low-priced properties in many areas of the West, including Colorado. Although foreclosures have fallen in Colorado in recent years, foreclosure rates remain near historic highs. The national total of new homes for sale is at a ten-year low of 158,000.
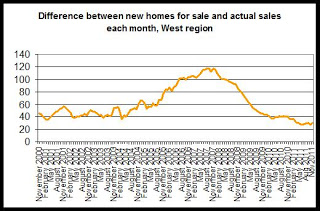
As a final note, we can also look to the new home inventory. In this case, we calculate inventory by subtracting the number of new home sales in a given month from the number of new homes for sale at the end of the previous month. In the final graph, we see that the inventory has essentially been flat since March 2011, hovering near 30,000 homes. This is good news for owners of existing homes seeking to sell homes since it suggests that fewer new homes are sitting and waiting to be sold, thus diminishing some of the inventory-driven downward pressure on prices.
The report, which monitors sales activity for newly constructed houses, reported that in the West, new home sales were flat year over year, with 4,000 sales in November 2011. There were 4,9000 sales during November 2010. Nationwide, sales rose 10 percent, increasing from 20,000 to 22,000 during the same period.
In the West, no month has shown fewer than 4,000 new home sales for the region during the past decade.
For the West region:

The second graph shows that new home sales continue to fall and have generally followed a downward trend since the middle of the decade.
New home sales peaked during the spring and summer of 2005 and have trended downward since. The number of new houses sold in the United States is down 82 percent since the peak of March 2005, and new home sales in the West have fallen 89 percent since sales peaked in the region during March 2004.

The third graph shows the declines in both US and regional totals in new homes for sale.
The number of new homes for sale has also fallen off considerably. The number of new houses for sale in the West has fallen 74 percent since the total peaked during June 2007, and the same total has fallen 72 percent in the US since the number of new homes for sale peaked in the US during August 2006.

At 34,000, the number of new single-family homes for sale in the West is near the lowest level it's been in more than ten years. No month has shown fewer than 33,000 new homes for sale during the past decade. This reflects very low demand in the face of an ongoing and large number of new foreclosures and low-priced properties in many areas of the West, including Colorado. Although foreclosures have fallen in Colorado in recent years, foreclosure rates remain near historic highs. The national total of new homes for sale is at a ten-year low of 158,000.
As a final note, we can also look to the new home inventory. In this case, we calculate inventory by subtracting the number of new home sales in a given month from the number of new homes for sale at the end of the previous month. In the final graph, we see that the inventory has essentially been flat since March 2011, hovering near 30,000 homes. This is good news for owners of existing homes seeking to sell homes since it suggests that fewer new homes are sitting and waiting to be sold, thus diminishing some of the inventory-driven downward pressure on prices.

Labels:
existing home sales,
new home sales,
west region
Housing News Digest, December 27
Real-estate developer Walter Koelbel Sr. dies
Colorado real-estate developer and philanthropist Walter A. Koelbel Sr. died Dec. 25. He was 85.
He had been ill with Alzheimer's disease for some time and died in hospice, his son, Walter "Buz" Koelbel Jr. said Monday.
Koelbel is credited with shaping commercial and residental real estate development in Colorado, beginning at the southern edges of Denver with Pinehurst Country Club, considered the first "master planned" residential-golf community in the Rocky Mountain West. In 1990, he bucked a national trend that favored walled-in residential developments with The Preserve at Greenwood Village, which included public trails leading to a 60-acre nature preserve at its center.
Personal income rises above 2008 peak
Colorado personal income rose 4.8 percent year-over-year.
The state's income growth surpassed that in the Rocky Mountain Region and in the country, where personal income levels rose 3.13 and 3.11 percent over their respective 2008 peaks.
Personal income figures do not account for inflation. However, the rate of inflation over the last 10 years was 23 percent, according to the Colorado Division of Housing blog, which means actual personal income growth is about half of the nominal income growth.
The Division of Housing reports that some of the personal income growth can be attributed to personal current transfer receipts, which does not include wages but does include payments from social security, unemployment insurance, Medicare and Medicaid.
US housing prices slipped in October
WASHINGTON — US home prices fell in October for the second straight month despite record-low home loan borrowing rates, a key index of the industry showed Tuesday.
Prices across 20 leading metropolitan areas fell on average by 0.6 percent from September, and were 3.4 percent lower than a year earlier, according to the S&P;/Case-Shiller 20-City Composite index.
Cracked Foundation Threatens U.S. Housing Recovery
The same is true of the housing market. Unfortunately, its foundation, the housing-finance system, still has big cracks in it. Until those are fixed, any hoped-for recovery may prove difficult to sustain.
Recent data, such as new-home starts and existing-home sales, have offered some glimmers of hope.
That isn't to say housing won't show signs of improvement. Recent data, such as new-home starts and existing-home sales, have offered some glimmers of hope. Tuesday's release of the S&P;/Case-Shiller index for October is likely to show further slippage of prices. But the rate of decline in the index, which tracks home prices in 20 metropolitan areas, is expected to continue slowing, to less than 3% year over year. That trend, some economists expect, presages prices finding a floor in 2012.
Analysis: U.S. rental demand lifts housing sector
(Reuters) - Brian Keith is busier than ever as the architecture firm he works for rushes to wrap up work on a 300-unit apartment complex in Dallas.
The project is one of dozens the firm, JHP Architecture, has on its hands -- a surge of business driven by a rise in demand in the United States for rental properties.
The increased demand has forced JHP to expand, and it expects to keep hiring at least through the first quarter.
Thursday, December 22, 2011
$25,000 CHDO grant awarded to Newsed in Denver County
The Department of Local Affairs has announced that $25,000.00 in HOME CHDO Operating (HMCO) funds has been awarded to Denver County for the following project:
Newsed Community Development Corporation, Inc. has been awarded a CHDO Operating grant of $25,000 to assist with staff salaries for the pre-development work of an acquisition/ rehabilitation of a 16-unit property located
at 10th and Santa Fe.
Newsed Community Development Corporation, Inc. has been awarded a CHDO Operating grant of $25,000 to assist with staff salaries for the pre-development work of an acquisition/ rehabilitation of a 16-unit property located
at 10th and Santa Fe.
$50,000 CHDO grant awarded to Renaissance Housing Dev. Corp.
The Department of Local Affairs has announced that $50,000.00 in HOME CHDO Operating (HMCO) funds has been awarded to Denver County for the following project:
Renaissance Housing Development Corporation has been awarded a CHDO Operating grant of $50,000 to assist with staff salaries for the pre-development work of the supportive housing that is to be built above the Stout Street Health Center located at 21st and Broadway in Denver. The due diligence to be performed shall include permitting, lining up sources of financing and partnerships, and re-applying for tax credits. The proposed project is anticipated to produce 78 units of affordable and supportive housing, including units to be set-aside for homeless persons.
Renaissance Housing Development Corporation has been awarded a CHDO Operating grant of $50,000 to assist with staff salaries for the pre-development work of the supportive housing that is to be built above the Stout Street Health Center located at 21st and Broadway in Denver. The due diligence to be performed shall include permitting, lining up sources of financing and partnerships, and re-applying for tax credits. The proposed project is anticipated to produce 78 units of affordable and supportive housing, including units to be set-aside for homeless persons.
$50,000 CHDO grant awarded to The Villages in Larimer County
The Department of Local Affairs has announced that $50,000.00 in HOME CHDO Operating (HMCO)funds has been awarded to Larimer County for the following project:
The Villages, Ltd. has been awarded a HOME CHDO operating grant in the amount of $50,000 to assist with staff salaries for the pre-development work for a permanent supportive housing development with 40 units in north Fort Collins. The Villages, Ltd. has met the CHDO certification requirements and submitted a business plan. They have entered into a memorandum of understanding (MOU) with the Division of Housing that states they intend to use additional HOME funds to develop units of affordable housing within 24 months of the date of this agreement.
The Villages, Ltd. has been awarded a HOME CHDO operating grant in the amount of $50,000 to assist with staff salaries for the pre-development work for a permanent supportive housing development with 40 units in north Fort Collins. The Villages, Ltd. has met the CHDO certification requirements and submitted a business plan. They have entered into a memorandum of understanding (MOU) with the Division of Housing that states they intend to use additional HOME funds to develop units of affordable housing within 24 months of the date of this agreement.
$32,000 CHDO grant awarded to Northeast Denver Housing Center
The Department of Local Affairs has announced that $32,198.00 in HOME CHDO Operating (HMCO) funds has been awarded to Denver County for the following project:
Northeast Denver Housing Center, Inc. has been awarded a CHDO Operating grant of $32,198 to assist with staff salaries for the pre-development work of identifying two potential affordable housing development opportunities in Denver and Lakewood. The selected projects shall be an acquisition/ rehabilitation or the preservation of
affordable units in need of rehabilitation.
$20,000 CHDO grant awarded to Del Norte
The Department of Local Affairs has announced that $20,000.00 in HOME CHDO Operating (HMCO) funds has been awarded to Denver County for the following project:
Del Norte Neighborhood Development Corporation has been awarded a CHDO Operating grant of $20,000 to assist with staff salaries for the pre-development work of the Avondale Apartments, 60 units of workforce housing that is to be built at 14th and Irving in Denver. The due diligence to be performed shall include permitting, lining up
sources of financing and partnerships, re-applying for tax credits, and coordinating the acquisition
$25,000 CHDO grant awarded to Hope Communities in Denver County
The Department of Local Affairs has announced that $25,000.00 in HOME CHDO Operating (HMCO) funds has been awarded to Denver County for the following project:
Hope Communities, Inc. has been awarded a CHDO Operating grant of $25,000 to assist with staff salaries for the pre-development work for three options of transit oriented development (TOD) infill rental new construction in the Five Points area.
Hope Communities, Inc. has been awarded a CHDO Operating grant of $25,000 to assist with staff salaries for the pre-development work for three options of transit oriented development (TOD) infill rental new construction in the Five Points area.
FHFA: Home prices in mountain region fall 5.4 percent in October
House prices in October in the Mountain region, which includes Colorado, fell 5.4 percent, year-over-year. Nationally, the house price index fell 2.7 percent. The new house price index numbers, released yesterday by the Federal Housing and Finance Agency, also showed that the national index is down 18.9 percent from the peak level reached in June 2007, while the Mountain region's index is down 31.4 percent over the same period.
The FHFA monthly index is calculated using purchase prices of houses purchased with loans that have been sold to or guaranteed by Fannie Mae or Freddie Mac. It is a repeat-sales index similar to the Case-Shiller index, but limited to GSE loans.
The decline in house prices reflects overall trends also found in other home price indices such as the CoreLogic index and the Case-Shiller index. According to FHFA, prices have largely stabilized over the past several months, but remain slightly down from 2009 and 2010 levels.
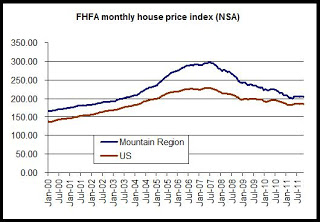
The second chart shows each month's house price index compared to the same month a year earlier:
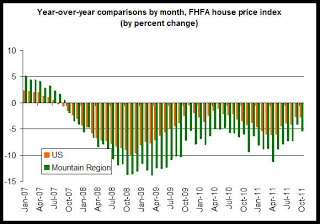
We can note that the Mountain region has performed more poorly (from a seller's perspective) than the national index. This runs contrary to some local experience and some statistics. The Case-Shiller data for the Denver metro area, for example, shows that local prices did not decline as much as the national composite index following the financial panic in 2008. Also, the FHFA "expanded-data" index shows Colorado performing better than the national index.
Since we're looking at regional, data, however, we have to keep in mind that this data reflects house prices in Arizona and Nevada, and this no doubt will continue to put downward pressure on regional prices for now.
Nevertheless, the overall trend among most home price indices is one of slow downward movement in home prices. This trend includes Colorado statewide as well as the metro Denver area.
The FHFA monthly index is calculated using purchase prices of houses purchased with loans that have been sold to or guaranteed by Fannie Mae or Freddie Mac. It is a repeat-sales index similar to the Case-Shiller index, but limited to GSE loans.
The decline in house prices reflects overall trends also found in other home price indices such as the CoreLogic index and the Case-Shiller index. According to FHFA, prices have largely stabilized over the past several months, but remain slightly down from 2009 and 2010 levels.

The second chart shows each month's house price index compared to the same month a year earlier:

We can note that the Mountain region has performed more poorly (from a seller's perspective) than the national index. This runs contrary to some local experience and some statistics. The Case-Shiller data for the Denver metro area, for example, shows that local prices did not decline as much as the national composite index following the financial panic in 2008. Also, the FHFA "expanded-data" index shows Colorado performing better than the national index.
Since we're looking at regional, data, however, we have to keep in mind that this data reflects house prices in Arizona and Nevada, and this no doubt will continue to put downward pressure on regional prices for now.
Nevertheless, the overall trend among most home price indices is one of slow downward movement in home prices. This trend includes Colorado statewide as well as the metro Denver area.
First-time unemployment claims in Colorado down 23 percent through November
Mass layoff events fell 27 percent to 101 events during the first eleven months of 2011 in Colorado. There were 139 mass layoff events during the same period last year. According to a new report released today by the U.S. Bureau of Labor Statistics, there were 16 mass layoff events during November 2011, which is down 5.8 percent from the 17 events reported during November of last year.
Monthly mass layoff events grew rapidly after October 2008 in Colorado, and have gradually lessened since early 2010.
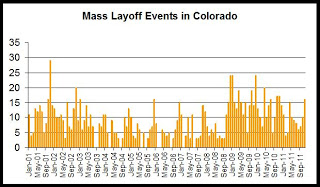
Nationally, mass layoff events decreased 16 percent from 1,676 during November 2010 to 1,393 during November of this year.
In the year-to-date Colorado total through November, mass layoffs have now fallen two years in a row after peaking at 164 mass layoffs during the first eleven months of 2009. The second graph shows year-to-date totals through November since 2001:
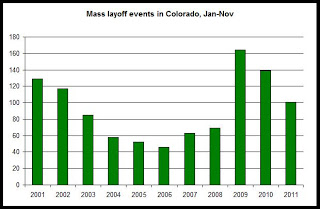
Mass layoffs were rare from 2004 through most of 2008.
Overall, the most recent mass layoffs data suggests that the employment situation continues to stabilize. New layoffs continue to lessen, and as we've seen in the most recent employment data, November employment increased year over year for the fifth month in a row.
New claims for unemployment insurance
New claims for unemployment insurance in Colorado fell year over year by 1.5 percent to 1,358 in November 2011. There were 1,379 new claims during November of last year. New claims for unemployment insurance have also gradually fallen since early 2010. Nationally, new claims fell 19 percent from November 2010 to November 2011.
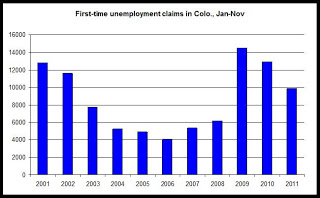
In year-to-date totals for new unemployment claims in Colorado through November, totals are down 23 percent year over year. There were 9,857 new claims during the first eleven months of 2011, compared to 12,951 new claims during the same period last year. In the year-to-date total through November, new claims for unemployment insurance have now fallen two years in a row after peaking at 14,483 claims during the first eleven months of 2009. The last graph shows year-to-date totals for November since 2001:
See the employment data archive for more on November's job creation.
The Mass Layoff Statistics (MLS) program collects reports on mass layoff actions that result in workers being separated from their jobs. Monthly mass layoff numbers are from establishments which have at least 50 initial claims for unemployment insurance (UI) filed against them during a 5-week period. Extended mass layoff numbers (issued quarterly) are from a subset of such establishments—where private sector nonfarm employers indicate that 50 or more workers were separated from their jobs for at least 31 days.
Monthly mass layoff events grew rapidly after October 2008 in Colorado, and have gradually lessened since early 2010.

Nationally, mass layoff events decreased 16 percent from 1,676 during November 2010 to 1,393 during November of this year.
In the year-to-date Colorado total through November, mass layoffs have now fallen two years in a row after peaking at 164 mass layoffs during the first eleven months of 2009. The second graph shows year-to-date totals through November since 2001:

Mass layoffs were rare from 2004 through most of 2008.
Overall, the most recent mass layoffs data suggests that the employment situation continues to stabilize. New layoffs continue to lessen, and as we've seen in the most recent employment data, November employment increased year over year for the fifth month in a row.
New claims for unemployment insurance
New claims for unemployment insurance in Colorado fell year over year by 1.5 percent to 1,358 in November 2011. There were 1,379 new claims during November of last year. New claims for unemployment insurance have also gradually fallen since early 2010. Nationally, new claims fell 19 percent from November 2010 to November 2011.
In year-to-date totals for new unemployment claims in Colorado through November, totals are down 23 percent year over year. There were 9,857 new claims during the first eleven months of 2011, compared to 12,951 new claims during the same period last year. In the year-to-date total through November, new claims for unemployment insurance have now fallen two years in a row after peaking at 14,483 claims during the first eleven months of 2009. The last graph shows year-to-date totals for November since 2001:

See the employment data archive for more on November's job creation.
The Mass Layoff Statistics (MLS) program collects reports on mass layoff actions that result in workers being separated from their jobs. Monthly mass layoff numbers are from establishments which have at least 50 initial claims for unemployment insurance (UI) filed against them during a 5-week period. Extended mass layoff numbers (issued quarterly) are from a subset of such establishments—where private sector nonfarm employers indicate that 50 or more workers were separated from their jobs for at least 31 days.
Labels:
employment,
mass layoffs,
unemployment
Zillow: Denver set to lose 5.5 billion in value during 2011
For what it's worth, here are Zillow's predictions for home valuations during 2011. Nationwide, home values are estimated to fall 681 billion in 2011, or 5.1 percent, year over year. In the Denver MSA, home values are predicted to fall 5.5 billion, or 2.9 percent, year over year.
Not surprisingly, the decline in Denver is expected to be smaller than the decline nationwide.
The largest decline in home values was found in Atlanta, GA where they dropped 14.7 percent, year over year. In Tampa, Chicago and Seattle, values dropped 10.7 percent, 10.4 and 9.4 percent, respectively.
According to today's press release from Zillow:
U.S. Homes Set to Lose Nearly $700 Billion in Value During 2011; Total Loss Smaller Than Prior Four Years
Nine Metros See 2011 Gains in Home Value, According to Zillow Real Estate Market Reports
U.S. homes are expected to lose more than $681 billion(i) in value during 2011, which is 35 percent less than the $1.1 trillion lost in 2010, according to analysis of recent Zillow Real Estate Market Reports.
The bulk of the total value lost during 2011 was in the first half of the year. From January to June, the U.S. housing market lost $454 billion. From July to December, Zillow projects residential home value losses will total a significantly lower $227 billion.
Regionally, only nine out of 128 markets showed gains in home values during 2011, with the New Orleans metropolitan statistical area (MSA) showing the largest gain of $3.5 billion. The Pittsburgh MSA was second on the list, with a gain of $2.7 billion.
"While homeowners suffered through another year of steep losses, the good news is that homes are losing value at a substantially slower pace as the market works its way towards the bottom," said Zillow Chief Economist Stan Humphries. "Compared to last year when we saw sharp declines following the expiration of the homebuyer tax credits, this year we saw some organic improvement in home values, in terms of a slowed depreciation rate which resulted in a smaller total value loss for the year."
Housing News Digest, December 22
US homeowners cast doubt on loan ‘lifeline’
Over Christmas 2007, Jylly Jakes realised she could no longer make her mortgage payments. Eighteen months after losing her job as a corporate bond trader, she was out of options. “I called up my bank servicer [the institution entrusted with collecting mortgage payments] and asked for a six-month forbearance,” she says. The bank said no.
Ms Jakes found work at a boutique bond firm a few months later and offered to pay the missing five payments over 12 months and stay up-to-date on her mortgage. The bank said no again and began repossession proceedings.
Home Sales Drive KB Home's 4Q
KB Home (KBH) reported net income of $13.9 million or 18 cents per share in the fourth quarter of fiscal 2011 as opposed to $17.4 million or 23 cents per share in the year-ago quarter.
However, excluding inventory impairments and land option contract abandonment charges of $2.3 million (non-cash) and an income tax benefit of $2.5 million, adjusted net income came in at $13.7 million or 18 cents per share, much higher than the Zacks Consensus Estimate of a profit of 3 cents per share.
Cap rates key in valuing commercial real estate
Roughly four years ago, commercial real estate investments abruptly flatlined due in part to the collapse of the country’s capital markets.
The Great Recession halted lending on commercial real estate investments throughout the United States.
The FDIC tightened its grip on lending institutions, requiring them to either raise additional capital or dispose of non-performing commercial real estate assets.
In some cases, this meant disposition of actual performing assets, placing both investors and bankers in compromised positions.
U.S. Foreclosures May Delay Housing Rebound
The two-bedroom Denver row house that Kyle and Jennifer Zinth bought in 2005 is a tight fit now that they have an 18-month-old son, Max, and a coonhound named Beauregard. They plan to put it up for sale next month, hoping to at least break even so they can buy a larger home.
“My understanding is it’s a better time to buy than sell,” Kyle Zinth, 34, a paralegal, said in a telephone interview. “If we can get out of this one without financial harm and get a good deal on the next place, then that’s ideal under present market realities.”
Housing Slump Was Deeper
The housing slump was deeper than initially estimated but new data indicate that the worst of the downturn may have passed.
The National Association of Realtors said Wednesday it over-estimated home sales by 14.3% between 2007 and 2010, meaning that 2.9 million fewer homes sold during those years than thought earlier.
Wednesday, December 21, 2011
Bankruptcy filings in Colorado decrease for tenth month in a row
In Colorado during November, total bankruptcy cases filed fell 10.7 percent, year over year, to 2,197 cases. During November 2010, 2,463 cases were filed. November was the tenth month in a row in which bankruptcies declined year over year.
The first graph shows the year-over-year changes in bankruptcy case filings since January 2007:
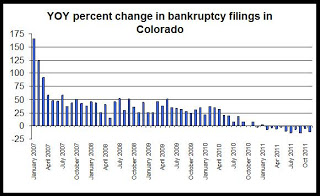
The appearance of sustained declines in the year-over-year comparisons reinforces the likelihood that consumers are beginning to get a handle on debts now that almost four years have passed since the beginning of the national 2007-2009 recession.
In general, however, bankruptcy filings have grown since 2006 following the implementation of the 2005 Bankruptcy Act (discussed here).
The large spike in 2005 preceded the implementation of the new bankruptcy rules. Filings totals have now returned to the levels experienced just prior to the final run-up in cases in 2005, but are down from 2010, when bankruptcy cases appear to have reached a post-2006 peak.
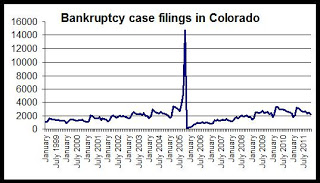
Recent monthly bankruptcy totals are now on a level similar to what was experienced during several months of 2003 and 2004, during a non-recessionary period. Bankruptcies decreased from October to November, falling 11 percent. This drop appears to be due to seasonal factors.
Note: April tends to be a peak month for bankruptcy filings as people use their tax refunds to pay for bankruptcy attorneys and filing costs.
The first graph shows the year-over-year changes in bankruptcy case filings since January 2007:

The appearance of sustained declines in the year-over-year comparisons reinforces the likelihood that consumers are beginning to get a handle on debts now that almost four years have passed since the beginning of the national 2007-2009 recession.
In general, however, bankruptcy filings have grown since 2006 following the implementation of the 2005 Bankruptcy Act (discussed here).
The large spike in 2005 preceded the implementation of the new bankruptcy rules. Filings totals have now returned to the levels experienced just prior to the final run-up in cases in 2005, but are down from 2010, when bankruptcy cases appear to have reached a post-2006 peak.

Recent monthly bankruptcy totals are now on a level similar to what was experienced during several months of 2003 and 2004, during a non-recessionary period. Bankruptcies decreased from October to November, falling 11 percent. This drop appears to be due to seasonal factors.
Note: April tends to be a peak month for bankruptcy filings as people use their tax refunds to pay for bankruptcy attorneys and filing costs.
NAR: Median home price in west falls 8.4 percent
Home prices in the West region of the U.S., which includes Colorado, fell 8.4 percent from November 2010 to November 2011. According to new existing home sales data, released today by the National Association of Realtors, the median home price fell more in the West than in any other region. The median home price in the Northeast, for example, fell 0.1 percent from November 2010 to November 2011.
The first graph shows median home prices for all regions plus the U.S. The median home price in the West during the past six months has ranged from $191,000 to $208,000. The median price was $195,300 during November 2011, and during November of 2010, the median price for the region was $213,100.
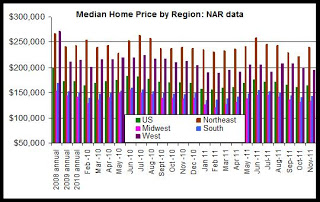
Nationally, home prices fell 3.5 percent, year over year.
Note: The median home price numbers were not affected by the major revision in home sales data. As explained here, home sales numbers were recently revised downward by 14 percent by the National Association of Realtors. Past estimates of home sales had proven to overstate home sales in recent years. The revision attempts to re-benchmark the data to make it more accurate.
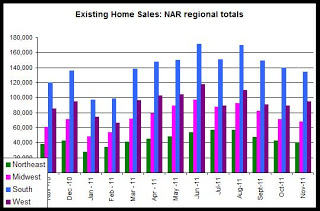
According to the revised data, home sales transactions (closings) rose 11.8 percent in the West region, which was close to the national year-over-year change of 10.9 percent. The West reported the largest increase in home sales of all regions, increasing from 85,000 during November 2010 to 95,000 during November 2011 (not seasonally adjusted).
The second graph shows closings by region. In general, closings increased each month from January 2011 to June 2011. July's total fell unexpectedly, but rebounded in August, and then declined again in September. Sales are now expected to decline each month until next January due to seasonal factors. While all regions except the west showed a month-over-month decrease from October to November, all regions showed increases in the year-over-year comparisons for November.
Overall, November's sales activity was higher than was the case during November of last year. This was expected. During the summer of 2010, sales activity fell significantly following the end of the home buyer tax credits. Many homeowners rushed to close their home sales by June 2010 in order to take advantage of the tax credit. Consequently, the second half of 2010 showed diminished home sales activity.
The recent price declines, broadly speaking, are in agreement with other home price indices such as CoreLogic, Case-Shiller, and the FHFA HPI which also show price declines. See here for more.
Conclusions: As can be seen in the first graph, home prices during recent months are down from where they were a year earlier, and the median price in the West is still below the annualized median prices for 2008, 2009 and 2010. The region shows stability in prices and a lack of significant upward pressure in prices right now.
The first graph shows median home prices for all regions plus the U.S. The median home price in the West during the past six months has ranged from $191,000 to $208,000. The median price was $195,300 during November 2011, and during November of 2010, the median price for the region was $213,100.

Nationally, home prices fell 3.5 percent, year over year.
Note: The median home price numbers were not affected by the major revision in home sales data. As explained here, home sales numbers were recently revised downward by 14 percent by the National Association of Realtors. Past estimates of home sales had proven to overstate home sales in recent years. The revision attempts to re-benchmark the data to make it more accurate.
According to the revised data, home sales transactions (closings) rose 11.8 percent in the West region, which was close to the national year-over-year change of 10.9 percent. The West reported the largest increase in home sales of all regions, increasing from 85,000 during November 2010 to 95,000 during November 2011 (not seasonally adjusted).
The second graph shows closings by region. In general, closings increased each month from January 2011 to June 2011. July's total fell unexpectedly, but rebounded in August, and then declined again in September. Sales are now expected to decline each month until next January due to seasonal factors. While all regions except the west showed a month-over-month decrease from October to November, all regions showed increases in the year-over-year comparisons for November.
Overall, November's sales activity was higher than was the case during November of last year. This was expected. During the summer of 2010, sales activity fell significantly following the end of the home buyer tax credits. Many homeowners rushed to close their home sales by June 2010 in order to take advantage of the tax credit. Consequently, the second half of 2010 showed diminished home sales activity.

The recent price declines, broadly speaking, are in agreement with other home price indices such as CoreLogic, Case-Shiller, and the FHFA HPI which also show price declines. See here for more.
Conclusions: As can be seen in the first graph, home prices during recent months are down from where they were a year earlier, and the median price in the West is still below the annualized median prices for 2008, 2009 and 2010. The region shows stability in prices and a lack of significant upward pressure in prices right now.
Labels:
existing home sales,
home prices,
home sales
Corelogic: 5-month supply of shadow inventory remains
Corelogic released its October 2011 report on shadow inventory. Separate data for Colorado was not provided in the publicly-available report.
According to the report:
According to the report:
As of October 2011, shadow inventory remained at 1.6 million units, or 5-months’ supply and represented half of the 3 million properties currently seriously delinquent, in foreclosure or in REO.
Of the 1.6 million properties currently in the shadow inventory (Figures 1 and 2), 770,000 units are seriously delinquent (2.5-months’ supply), 430,000 are in some stage of foreclosure (1.4-months’ supply) and 370,000 are already in REO (1.2-months’ supply).
Florida, California and Illinois account for more than a third of the shadow inventory. The top six states, which would also include New York, Texas and New Jersey, account for half of the shadow inventory.
DEADLINE EXTENDED: Upcoming workshop: Advanced Finance Academy
The registration deadline has been extended to December 30.
The Colorado Department of Local Affairs/Division of Housing is pleased to announce the presentation of its workshop, the Advanced Finance Academy. It will be held on January 18th and 19th, 2012 in the Community Room at Volunteers of America at 2660 Larimer Street in Denver. We will have expert panelists on hand to answer your questions on financing your projects during this time of changing economic conditions.
This is a 2-day workshop and it is mandatory that you attend Day 1 in order to attend Day 2. The workshop is a "hands-on" use of the computer spreadsheets used by the Division of Housing in its funding application process. You will need to bring a laptop computer with you in order to participate in the class. We will provide you a CD with the spreadsheets preloaded onto it which you will be able to take home with you.
Lunch will be provided on Day 1. Lunch on Day 2 will be on your own. The registration fee is $75.00 and must be paid by check payable to the Colorado Division of Housing. Registrations are due by December 16th and class size is limited to 24 participants.
Parking for the workshop is available on the streets for free and is not time-restricted. Please do not park in the lot behind the building since that is reserved for VOA staff and their clients.
The deadline has been extended to December 30, 2011. Please see the attached brochure/registration form for more detailed information on the workshop and how to register, or call Antoinette Johns (303-866-5657) or Denise Selders (303-866-4650) if you have any questions.
See here for the full brochure.
Housing News Digest, December 21
No Relief for Homeowners Shut Out by U.S.
Marc and Emily De La Torre would love to lower their mortgage bills to offset the costs of raising their 3-month-old baby. Instead, they’re among millions of Americans left out as the government tries again to make refinancing possible for borrowers with little or no equity.
The couple bought their Bonney Lake, Washington, property in July 2009, two months too late to be eligible for the federal Home Affordable Refinance Program, or HARP. Blocked from conventional refinancing after the house fell in value, the De La Torres can’t take advantage of record-low loan rates that have been a boon for other homeowners.
Homeless US families find little to cheer at Christmas
Across the frozen plains of Colorado it is bitingly cold at this time of year. The temperature is often below zero on most days.
In the state's capital, Denver, America's new homeless venture out into the bitter evening air, victims of an economic downturn that started during the last presidential election year in 2008 and will continue into the 2012 election cycle.
Angelo McWilliams is one of those joining the new ranks of the homeless in Denver. A single father of three children, he has just joined the record numbers of Americans who face a bleak Christmas as the impact of the economic downturn filters through to the country's poorest citizens.
Former Agilent property sold to Cumberland & Western
LOVELAND - The City of Loveland has closed on its deal to sell the former Agilent property to Bowling Green, Ky.-based developer Cumberland & Western for $5 million.
The City purchased the 300-acre property from Agilent for $5.5 million over the summer with intent to sell 170 acres of the campus with five buildings for redevelopment. The City of Loveland retains 130 undeveloped acres adjacent to the Big Thompson River and city recreation trail as open space, and also retains 144 shares of water rights
Boulder, Denver economically advantaged
Richard Florida, the “Creative Class” guru who has long been admired by Gov. John Hickenlooper and others, has created an economic rating system that ranks Boulder and Denver in the nation’s top 20 cities as being economically advantaged.
Boulder ranked No. 8 and the Denver-Aurora area was 17th, on the new index, which examined 360 metropolitan statistical areas across the country.
Of the top 20, 15 of them were on either the West or East coasts. In other words, Colorado claimed two of the five spots between the coasts.
Real Estate conference coming to Denver
Denver will host NAREE’s 46th Annual Real Estate Journalism Conference from June 20-23 at the Brown Palace Hotel & Spa in downtown.
The Brown Palace and adjoining Comfort Inn will be the site of a real estate convention next June.
The four-day conference, titled A Mile High Recovery? is NAREE’s ”Ultimate News Conference” and is designed to draw writers, editors, authors and the nation’s leading real estate analysts and experts to focus on new trends in residential and commercial real estate and home and urban design.
Home sales during housing bust worse than thought
NEW YORK (CNNMoney) -- Existing home sales during the housing bust were actually 14.3% worse than previously reported, a revision to Realtors' group numbers shows.
On Wednesday, the National Association of Realtors (NAR) revised home sale counts back to 2007 due to flaws in their original data analysis.
Tuesday, December 20, 2011
Regional employment: metro-areas improve in Colorado
Total employment in Colorado in November was up for the fifth month in a row in the year-over-year comparisons. In November, total employment in Colorado was down 117,000 from the July 2008 peak. Employment trends in various regions of the state differ, however, so this article looks at which regions of the state have the highest unemployment rates, and which regions have recovered the most in their labor markets.
Regional employment trends can also provide us with some insights into local housing demand since, all things being equal, those areas with the most robust labor demand will also have the strongest demand for housing. This would be reflected in apartment vacancy rates and in median home price and home sales transactions, among other indicators.
The first graph compares unemployment rates in Colorado's metro areas.
The regional unemployment rates (not seasonally adjusted) for November 2011 are:
Colorado Springs, 8.7%
Denver-Aurora, 7.9%
Fort Collins-Loveland, 6.2%
Grand Junction, 8.5%
Greeley, 8.7%
Pueblo, 9.6%
Statewide, 7.8%
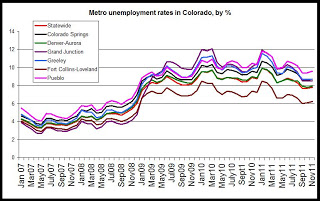
Since mid-2009, The Fort Collins-Loveland area has consistently shown one of the lowest unemployment rates while Grand Junction and Pueblo have generally shown the highest rates.
Year over year, the unemployment rate decreased in all metro areas. In Pueblo, where the highest metro unemployment rate was found, the rate decreased from 10.5 percent to 9.6 percent, year over year. In the Fort Collins-Loveland area, where the rates were lowest, the unemployment rate fell from 7.3 percent to 6.2 percent during the same period.
The unemployment rate is a reflection of both the total number of employed persons and the total size of the labor force (as reflected in the Household Survey), so the unemployment rate can decrease even in times of falling total employment if the size of the labor force decreases as well.
To provide some additional context, we can look to see how far below total employment levels are below the most recent peak in employment in each region. The peak time differs in each region. For example, the labor market peaked in mid-2007 in the Colorado Springs area, but it did not peak until late 2008 in the Grand Junction area.
The following numbers reflect how far below the most recent peak are the October 2011 employment totals:
Colorado Springs MSA, 6.5%
Denver-Aurora MSA, 4.4%
Fort Collins-Loveland MSA, 2.6%
Grand Junction MSA, 11.8%
Greeley MSA 5.4%
Pueblo MSA, 2.8%
Statewide, 4.4%
All things being equal, the areas further below the peak have recovered the least from initial job losses.
By far, Grand Junction remains the furthest below peak levels.
The Pueblo area and the Fort Collins-Loveland area, are nearest to peak levels, although Pueblo still reports a relatively high unemployment rate. The fort Collins-Loveland area, on the other hand, reports the lowest unemployment rate of the metro areas.
(Note: If we include the Boulder-Longmont MSA, we find that the Boulder area has consistently been among the areas with the lowest unemployment rate. In November 2011, the rate in the Boulder-Longmont area was 5.9%.)
Impact on Housing
The metro areas with the most job growth should generally also be the areas with the most demand for housing. We do see this reflected to a certain extent in the apartment vacancy data and in job growth.
We expect the demand for housing to continue to be strongest in the Fort Collins-Loveland area and in metro Denver.
Regional employment trends can also provide us with some insights into local housing demand since, all things being equal, those areas with the most robust labor demand will also have the strongest demand for housing. This would be reflected in apartment vacancy rates and in median home price and home sales transactions, among other indicators.
The first graph compares unemployment rates in Colorado's metro areas.
The regional unemployment rates (not seasonally adjusted) for November 2011 are:
Colorado Springs, 8.7%
Denver-Aurora, 7.9%
Fort Collins-Loveland, 6.2%
Grand Junction, 8.5%
Greeley, 8.7%
Pueblo, 9.6%
Statewide, 7.8%

Since mid-2009, The Fort Collins-Loveland area has consistently shown one of the lowest unemployment rates while Grand Junction and Pueblo have generally shown the highest rates.
Year over year, the unemployment rate decreased in all metro areas. In Pueblo, where the highest metro unemployment rate was found, the rate decreased from 10.5 percent to 9.6 percent, year over year. In the Fort Collins-Loveland area, where the rates were lowest, the unemployment rate fell from 7.3 percent to 6.2 percent during the same period.
The unemployment rate is a reflection of both the total number of employed persons and the total size of the labor force (as reflected in the Household Survey), so the unemployment rate can decrease even in times of falling total employment if the size of the labor force decreases as well.
To provide some additional context, we can look to see how far below total employment levels are below the most recent peak in employment in each region. The peak time differs in each region. For example, the labor market peaked in mid-2007 in the Colorado Springs area, but it did not peak until late 2008 in the Grand Junction area.
The following numbers reflect how far below the most recent peak are the October 2011 employment totals:
Colorado Springs MSA, 6.5%
Denver-Aurora MSA, 4.4%
Fort Collins-Loveland MSA, 2.6%
Grand Junction MSA, 11.8%
Greeley MSA 5.4%
Pueblo MSA, 2.8%
Statewide, 4.4%
All things being equal, the areas further below the peak have recovered the least from initial job losses.
By far, Grand Junction remains the furthest below peak levels.
The Pueblo area and the Fort Collins-Loveland area, are nearest to peak levels, although Pueblo still reports a relatively high unemployment rate. The fort Collins-Loveland area, on the other hand, reports the lowest unemployment rate of the metro areas.
(Note: If we include the Boulder-Longmont MSA, we find that the Boulder area has consistently been among the areas with the lowest unemployment rate. In November 2011, the rate in the Boulder-Longmont area was 5.9%.)
Impact on Housing
The metro areas with the most job growth should generally also be the areas with the most demand for housing. We do see this reflected to a certain extent in the apartment vacancy data and in job growth.
We expect the demand for housing to continue to be strongest in the Fort Collins-Loveland area and in metro Denver.
Colorado adds jobs in November, marking five months of job gains
Colorado gained 79,574 jobs in November 2011 compared to November of last year, and the non-seasonally-adjusted unemployment rate fell year-over-year from 8.9 percent to 7.8 percent. According to the most recent employment data, collected through the Household Survey and released today by the Colorado Department of Labor and Employment, total employment in November, not seasonally adjusted, rose to 2.514 million jobs. There were also 54,000 more people in the work force during November, compared to November 2010.
The unemployment rate remained largely flat from October to November in spite of job gains due to a relatively large number of workers joining the labor force.

From November 2010 to November 2011, total employment rose 3.2 percent, while the labor force rose 2.0 percent. The total labor force in November included 2.72 million workers.
As can be seen in the second graph, total employment and total workforce size have decreased slightly, month-over-month. Year over year, both total employment and the labor force rose together. However, both remain well below the July 2008 peak.
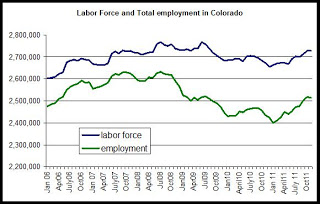
The employment total is now 117,900 jobs below the peak levels experienced during July 2008 when there were 2.63 million employed workers. Compared to the labor force peak in July 2008, the labor force is now down by more than 40,500 workers.
In the third graph is shown the year-over-year comparisons, by percent, for total employment. November 2011 was the fifth month in a row showing a positive year-over-year change in total employment. This followed 33 months in a row of negative job growth in year-over-year comparisons. At 3.2 percent, the year-over-year percent change in total employment was the largest gain since January 2007 and was at a 59-month high in November 2011. Between August 2008 and July 2011, no month posted a positive change in total employment when compared to the same month a year earlier.
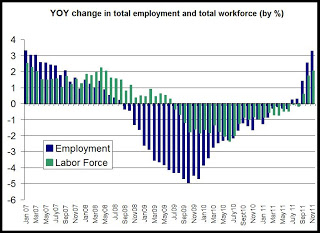
The graph also shows the year-over-change in the labor force. Total labor force size rose from November 2010 to November 2011, and was only the third time that the labor force has grown, year over year, since June 2009 . The labor force size had shrunk, year over year, for 26 months in a row from July 2009 to August 2011.
These numbers come from the Household Survey employment data, so the size of the workforce is dependent on the number of people stating that they are actively looking for work if not employed. Discouraged workers who have stopped looking for work are excluded.
Establishment Survey
The establishment survey, on the other hand, which surveys employers, showed much smaller job gains, year over year. According to the establishment survey data, found here, Colorado's total employment (not seasonally adjusted) increased by 25,000 from November 2010 to November 2011. Total employment also decreased by 2,000 from October 2011 to November 2011.
The unemployment rate remained largely flat from October to November in spite of job gains due to a relatively large number of workers joining the labor force.

From November 2010 to November 2011, total employment rose 3.2 percent, while the labor force rose 2.0 percent. The total labor force in November included 2.72 million workers.
As can be seen in the second graph, total employment and total workforce size have decreased slightly, month-over-month. Year over year, both total employment and the labor force rose together. However, both remain well below the July 2008 peak.

The employment total is now 117,900 jobs below the peak levels experienced during July 2008 when there were 2.63 million employed workers. Compared to the labor force peak in July 2008, the labor force is now down by more than 40,500 workers.
In the third graph is shown the year-over-year comparisons, by percent, for total employment. November 2011 was the fifth month in a row showing a positive year-over-year change in total employment. This followed 33 months in a row of negative job growth in year-over-year comparisons. At 3.2 percent, the year-over-year percent change in total employment was the largest gain since January 2007 and was at a 59-month high in November 2011. Between August 2008 and July 2011, no month posted a positive change in total employment when compared to the same month a year earlier.

The graph also shows the year-over-change in the labor force. Total labor force size rose from November 2010 to November 2011, and was only the third time that the labor force has grown, year over year, since June 2009 . The labor force size had shrunk, year over year, for 26 months in a row from July 2009 to August 2011.
These numbers come from the Household Survey employment data, so the size of the workforce is dependent on the number of people stating that they are actively looking for work if not employed. Discouraged workers who have stopped looking for work are excluded.
Establishment Survey
The establishment survey, on the other hand, which surveys employers, showed much smaller job gains, year over year. According to the establishment survey data, found here, Colorado's total employment (not seasonally adjusted) increased by 25,000 from November 2010 to November 2011. Total employment also decreased by 2,000 from October 2011 to November 2011.
November housing starts: multifamily starts surge in western US
Multifamily housing starts in the West Census region of the US, which includes Colorado, rose 286 percent from November 2010, showing the highest November total in multifamily starts in four years. Single-family housing starts were up 18.5 percent from November 2010 to November 2011, while the combined total for both single-family and multifamily units were up 76 percent during the same period.
According to new housing construction and housing starts data released today by the US Census Bureau, there were approximately 12,200 housing units started in the West during November 2011. Of the new units started, 6,400 were single-family structures and 5,800 were structures containing more than one housing unit.
Nationally, housing starts overall increased 27 percent, year over year, with total housing starts rising to a total of 51,800.
Total housing starts remain well below peak levels both nationally and in the West. November 2011 housing starts in the West were 77 percent below the peak reached during May 2004. Nationally, November 2011 was 73 percent below peak levels. The national peak in housing starts was reached during May 2005.
Multifamily starts have rebounded more than single-family starts. In the West, single-family starts are 86 percent below peak levels while multifamily starts are only 42 percent below peak levels.
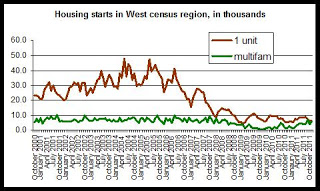
The West census region includes California, so given the size of the West census region, the fact that total housing starts are at 12,200 indicates that new home construction continues to be very light throughout the region. Housing starts totals ranging from 35,000 to 45,000 were common from 2004 to 2006. However, most of this decline was driven by drops in single-family activity, and not by large drops in multifamily activity.
The first graph shows the difference between single-family starts and starts for structures with more than one housing unit in the West region. Single-family starts rose 18 percent from November 2010 to November 2011. Starts for structures with more than one unit rose by 286 percent during the same period, rising from 1,500 units during November 2010, to 5,800 units during November of this year.
The second graph shows month-by-month comparisons in housing starts for each year in the West. November's housing-starts total increased from October to November, which is not reflective of the historical trend in which starts generally decline form October to November.
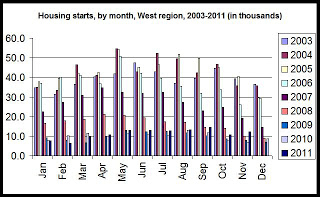
More sustained growth was visible in starts for structures with more than one housing unit. As can be seen in the third graph, November's total was significantly higher than November 2010, and is at a four-year high.
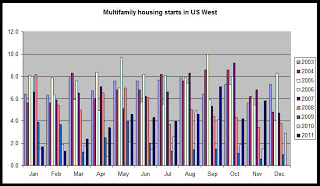
Starts for buildings with more than one unit were relatively numerous in November, showing a continued trend of growing activity in multifamily construction. Single-family starts showed signs of life as well, but were far more restrained than was the case in multifamily starts.
We can also note that the surge in multifamily starts is reinforced by recent increases in new multifamily permit data as well.
According to new housing construction and housing starts data released today by the US Census Bureau, there were approximately 12,200 housing units started in the West during November 2011. Of the new units started, 6,400 were single-family structures and 5,800 were structures containing more than one housing unit.
Nationally, housing starts overall increased 27 percent, year over year, with total housing starts rising to a total of 51,800.
Total housing starts remain well below peak levels both nationally and in the West. November 2011 housing starts in the West were 77 percent below the peak reached during May 2004. Nationally, November 2011 was 73 percent below peak levels. The national peak in housing starts was reached during May 2005.
Multifamily starts have rebounded more than single-family starts. In the West, single-family starts are 86 percent below peak levels while multifamily starts are only 42 percent below peak levels.

The West census region includes California, so given the size of the West census region, the fact that total housing starts are at 12,200 indicates that new home construction continues to be very light throughout the region. Housing starts totals ranging from 35,000 to 45,000 were common from 2004 to 2006. However, most of this decline was driven by drops in single-family activity, and not by large drops in multifamily activity.
The first graph shows the difference between single-family starts and starts for structures with more than one housing unit in the West region. Single-family starts rose 18 percent from November 2010 to November 2011. Starts for structures with more than one unit rose by 286 percent during the same period, rising from 1,500 units during November 2010, to 5,800 units during November of this year.
The second graph shows month-by-month comparisons in housing starts for each year in the West. November's housing-starts total increased from October to November, which is not reflective of the historical trend in which starts generally decline form October to November.

More sustained growth was visible in starts for structures with more than one housing unit. As can be seen in the third graph, November's total was significantly higher than November 2010, and is at a four-year high.

Starts for buildings with more than one unit were relatively numerous in November, showing a continued trend of growing activity in multifamily construction. Single-family starts showed signs of life as well, but were far more restrained than was the case in multifamily starts.
We can also note that the surge in multifamily starts is reinforced by recent increases in new multifamily permit data as well.
October single-family permits: El Paso County active, most county totals fall :
Of the 6,069 new single-family permits issued during the first ten months of 2011, 1,338 of them, or 22 percent, were issued in El Paso County alone. According to new single-family October permit data by county, released by the Census Bureau, the counties with the largest numbers of single-family permits issued during the first ten months of 2011 were El Paso, Douglas, Denver, Larimer and Arapahoe.
See here for recent entries about building permits.
New single-family permits from Jan-Oct
El Paso 1338
Douglas 780
Larimer 611
Denver 590
Arapahoe 506
Also:
Adams 458
Broomfield 82
Chaffee 63
Clear Creek 9
Grand 12
Gunnison 23
Jefferson 388
Mesa 237
Park 66
Teller 31
Weld 546
(Note: All permits discussed in this article are single-family permits.)
However, when permit totals are adjusted to the number of existing housing units in each county, the counties with the larges amounts of permit activity were Chaffee, Park, Douglas, El Paso and Weld.
The first map shows the relative amount of single-family permit activity adjusted for the existing size of the housing stock in each county. The counties are then broken out in quartiles reflecting the amount of single-family activity compared to other counties. The top quartile has the largest amount of new permitting compared to the number of existing units. The bottom quartile has the smallest amount.
Top Q: Brown
2nd Q: Green
3rd Q: Orange
Bottom Q: Yellow
No data or no permits: White
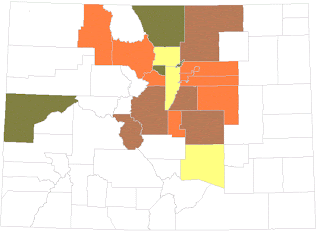
In absolute terms, and as expected, the counties with the largest populations have the most permit activity. But when adjusted to the number of existing housing units (as shown in the map), the hot spots for single-family permits right now are Douglas, Park, Chaffee, Weld and El Paso counties. Larimer, Gilpin, Mesa and Broomfield counties are in the second quartile.
During the first ten months of 2011, the areas with relatively few new single-family permits relative to the size of the existing stock are Pueblo, Jefferson, Denver, Arapahoe, and Boulder counties.
In the larger context, single-family permits remain well below totals experienced prior to 2007. From 2006 to 2008, single-family permits in the state decreased 60 percent from 31,000 to 12,000. Permit activity appears to have bottomed out in 2009. When discussing permit activity from 2008 to the present time, we're looking at permit totals that are near 20-year lows.
See here for a discussion on historical permit data by county.
It is also helpful to see which counties have shown the largest increases and decreases in permit activity. In the map below, we see that comparing the first ten months of this year to the same period last year, Larimer and Teller counties were among the counties with the largest increases in single-family permit activity. Boulder, Jefferson, Denver and Douglas counties also showed increases. On the other hand, permits decreased in Mesa, Weld, Adams, Arapahoe, El Paso and Pueblo counties.
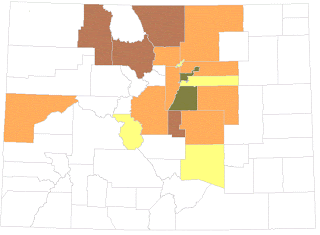
Brown: Increase of 25 percent or more
Green: Increase of 1 to 24.9 percent
Orange: Decrease of 1 to 24.9 percent
Yellow: Decrease of 25 percent or more
White: No data or no change
Largest increases among metro counties:
Larimer 69 percent
Teller 93 percent
Douglas 10 percent
Denver 8 percent
All other metro counties reported year-over-year drops.
With relatively large numbers of new permit activity in 2011, and with a year-over-year increase in each county, both Larimer County and Douglas County show solid demand for new permitting at this time. In spite of year-over-year declines in totals, El Paso County continues to report a significant share of the state's overall permitting activity while Weld county reports a surprisingly large number of new single-family permits in the wake of very high foreclosure totals. Much of the new permit activity in Weld county is coming from expanding communities in southern Weld County.
See here for recent entries about building permits.
New single-family permits from Jan-Oct
El Paso 1338
Douglas 780
Larimer 611
Denver 590
Arapahoe 506
Also:
Adams 458
Broomfield 82
Chaffee 63
Clear Creek 9
Grand 12
Gunnison 23
Jefferson 388
Mesa 237
Park 66
Teller 31
Weld 546
(Note: All permits discussed in this article are single-family permits.)
However, when permit totals are adjusted to the number of existing housing units in each county, the counties with the larges amounts of permit activity were Chaffee, Park, Douglas, El Paso and Weld.
The first map shows the relative amount of single-family permit activity adjusted for the existing size of the housing stock in each county. The counties are then broken out in quartiles reflecting the amount of single-family activity compared to other counties. The top quartile has the largest amount of new permitting compared to the number of existing units. The bottom quartile has the smallest amount.
Top Q: Brown
2nd Q: Green
3rd Q: Orange
Bottom Q: Yellow
No data or no permits: White

In absolute terms, and as expected, the counties with the largest populations have the most permit activity. But when adjusted to the number of existing housing units (as shown in the map), the hot spots for single-family permits right now are Douglas, Park, Chaffee, Weld and El Paso counties. Larimer, Gilpin, Mesa and Broomfield counties are in the second quartile.
During the first ten months of 2011, the areas with relatively few new single-family permits relative to the size of the existing stock are Pueblo, Jefferson, Denver, Arapahoe, and Boulder counties.
In the larger context, single-family permits remain well below totals experienced prior to 2007. From 2006 to 2008, single-family permits in the state decreased 60 percent from 31,000 to 12,000. Permit activity appears to have bottomed out in 2009. When discussing permit activity from 2008 to the present time, we're looking at permit totals that are near 20-year lows.
See here for a discussion on historical permit data by county.
It is also helpful to see which counties have shown the largest increases and decreases in permit activity. In the map below, we see that comparing the first ten months of this year to the same period last year, Larimer and Teller counties were among the counties with the largest increases in single-family permit activity. Boulder, Jefferson, Denver and Douglas counties also showed increases. On the other hand, permits decreased in Mesa, Weld, Adams, Arapahoe, El Paso and Pueblo counties.

Brown: Increase of 25 percent or more
Green: Increase of 1 to 24.9 percent
Orange: Decrease of 1 to 24.9 percent
Yellow: Decrease of 25 percent or more
White: No data or no change
Largest increases among metro counties:
Larimer 69 percent
Teller 93 percent
Douglas 10 percent
Denver 8 percent
All other metro counties reported year-over-year drops.
With relatively large numbers of new permit activity in 2011, and with a year-over-year increase in each county, both Larimer County and Douglas County show solid demand for new permitting at this time. In spite of year-over-year declines in totals, El Paso County continues to report a significant share of the state's overall permitting activity while Weld county reports a surprisingly large number of new single-family permits in the wake of very high foreclosure totals. Much of the new permit activity in Weld county is coming from expanding communities in southern Weld County.
Monday, December 19, 2011
Personal income in Colorado now 3 percent above 2008's peak levels
New personal income data for Colorado was released today by the BLS.
Colorado has now surpassed the personal income peak achieved before the 2008 financial crisis. At $225.0 billion, personal income in Colorado is above the peak levels reached during the third quarter of 2008, when personal income reached $218.1 billion. Personal income is now up by 3.18 percent from previous peak levels.
In year-over-year comparisons, personal income in Colorado is up 4.8 percent from the third quarter of 2010 to the same period this year. This is the lowest year-over-year rate of increase since the second quarter of 2010, when personal income grew 3.2 percent, year over year.
Personal income in Colorado is now slightly further above peak levels than the US as a whole and the Rocky Mountain region. As of the 3rd quarter of 2011, The Rocky Mountain region is 3.13 percent above peak levels and the US is 3.11 percent above its own peak which occurred during the second quarter of 2008.
Over ten years from the 3rd quarter of 2002 to the 3rd quarter of 2011, US personal income increased 42.7 percent, and in Colorado it also increased 42.7 percent. In the Rocky Mountain region, the increase for the same period was 49.3 percent.
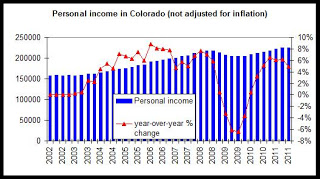
(personal income is shown in 1,000,000s)
Personal income figures are not adjusted for inflation. Over the past decade, the consumer price index in the United States West region increased 23 percent. So, income growth has outpaced inflation, but real income growth is about half of nominal income growth.
Since the peak levels reached during the third quarter of 2008, personal income in Colorado is up 3.1 percent, but the CPI in the U.S. West has increased 3.6 percent during the same period.
Much of the increase that has occurred may be attributed to a 29 percent increase in personal current transfer receipts since the 2008 peak.
The effect of personal current transfer receipts
An important component of personal income is "personal current transfer receipts." These are forms of income not died to wages and employment income and include payments such as social security payments, unemployment insurance, Medicare and Medicaid.
When personal current transfer receipts are removed from personal income, income growth is not as robust.
The second chart shows personal income minus personal current transfer receipts.
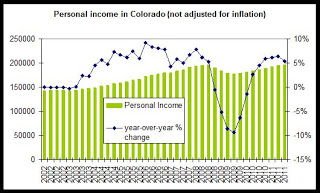
Without the inclusion of transfer receipts, personal income in Colorado is only up 0.1 percent from peak levels. In other words, by this measure, Colorado has seen almost no personal income growth since the peak unless these transfer receipts are included.
Naturally, when adjusted for inflation, personal income (minus transfer receipts) has declined since 2008. Since the peak period, the CPI has increased 3.6 percent. Comparing the 0.1 percent increase in income since the peak with the 3.6 percent increase in the CPI, we see that income growth has not kept up with price inflation and that real incomes have not yet returned to peak levels.
By this measure we find that Colorado fares slightly better than the nation, however. With personal current transfer receipts excluded, personal income nationwide has declined by 0.6 percent, and in the Rocky Mountain Region, personal income has increased only 0.02 percent since the peak period.
Conclusions
Overall, Colorado's real estate markets and labor markets have not suffered as much as many markets, but in a variety of ways, including personal income, Colorado only began to match peak levels in personal income during the third quarter of this year. Compared to all other states, Colorado placed in the top quartile during the third quarter, however. See the map here.
Generally speaking, personal income has been largely flat in Colorado since 2008 reflecting a sluggish job market and wage growth. Income growth from wages and employment has been sluggish as is shown when transfer receipts are excluded from calculations. See here for more on employment in Colorado.
Note: Personal income is the income received by all persons from all sources. Personal income is the sum of net earnings by place of residence, property income, and personal current transfer receipts. Total personal income will rise as population rises, even if household incomes are declining. Property income is rental income of persons, personal dividend income, and personal interest income. Net earnings is earnings by place of work (the sum of wage and salary disbursements, supplements to wages and salaries, and proprietors' income) less contributions for government social insurance, plus an adjustment to convert earnings by place of work to a place-of-residence basis. Personal income is measured before the deduction of personal income taxes and other personal taxes and is reported in current dollars (no adjustment is made for inflation).
Colorado has now surpassed the personal income peak achieved before the 2008 financial crisis. At $225.0 billion, personal income in Colorado is above the peak levels reached during the third quarter of 2008, when personal income reached $218.1 billion. Personal income is now up by 3.18 percent from previous peak levels.
In year-over-year comparisons, personal income in Colorado is up 4.8 percent from the third quarter of 2010 to the same period this year. This is the lowest year-over-year rate of increase since the second quarter of 2010, when personal income grew 3.2 percent, year over year.
Personal income in Colorado is now slightly further above peak levels than the US as a whole and the Rocky Mountain region. As of the 3rd quarter of 2011, The Rocky Mountain region is 3.13 percent above peak levels and the US is 3.11 percent above its own peak which occurred during the second quarter of 2008.
Over ten years from the 3rd quarter of 2002 to the 3rd quarter of 2011, US personal income increased 42.7 percent, and in Colorado it also increased 42.7 percent. In the Rocky Mountain region, the increase for the same period was 49.3 percent.

(personal income is shown in 1,000,000s)
Personal income figures are not adjusted for inflation. Over the past decade, the consumer price index in the United States West region increased 23 percent. So, income growth has outpaced inflation, but real income growth is about half of nominal income growth.
Since the peak levels reached during the third quarter of 2008, personal income in Colorado is up 3.1 percent, but the CPI in the U.S. West has increased 3.6 percent during the same period.
Much of the increase that has occurred may be attributed to a 29 percent increase in personal current transfer receipts since the 2008 peak.
The effect of personal current transfer receipts
An important component of personal income is "personal current transfer receipts." These are forms of income not died to wages and employment income and include payments such as social security payments, unemployment insurance, Medicare and Medicaid.
When personal current transfer receipts are removed from personal income, income growth is not as robust.
The second chart shows personal income minus personal current transfer receipts.

Without the inclusion of transfer receipts, personal income in Colorado is only up 0.1 percent from peak levels. In other words, by this measure, Colorado has seen almost no personal income growth since the peak unless these transfer receipts are included.
Naturally, when adjusted for inflation, personal income (minus transfer receipts) has declined since 2008. Since the peak period, the CPI has increased 3.6 percent. Comparing the 0.1 percent increase in income since the peak with the 3.6 percent increase in the CPI, we see that income growth has not kept up with price inflation and that real incomes have not yet returned to peak levels.
By this measure we find that Colorado fares slightly better than the nation, however. With personal current transfer receipts excluded, personal income nationwide has declined by 0.6 percent, and in the Rocky Mountain Region, personal income has increased only 0.02 percent since the peak period.
Conclusions
Overall, Colorado's real estate markets and labor markets have not suffered as much as many markets, but in a variety of ways, including personal income, Colorado only began to match peak levels in personal income during the third quarter of this year. Compared to all other states, Colorado placed in the top quartile during the third quarter, however. See the map here.
Generally speaking, personal income has been largely flat in Colorado since 2008 reflecting a sluggish job market and wage growth. Income growth from wages and employment has been sluggish as is shown when transfer receipts are excluded from calculations. See here for more on employment in Colorado.
Note: Personal income is the income received by all persons from all sources. Personal income is the sum of net earnings by place of residence, property income, and personal current transfer receipts. Total personal income will rise as population rises, even if household incomes are declining. Property income is rental income of persons, personal dividend income, and personal interest income. Net earnings is earnings by place of work (the sum of wage and salary disbursements, supplements to wages and salaries, and proprietors' income) less contributions for government social insurance, plus an adjustment to convert earnings by place of work to a place-of-residence basis. Personal income is measured before the deduction of personal income taxes and other personal taxes and is reported in current dollars (no adjustment is made for inflation).
Remodeling activity increases 50 percent in West
Residential remodeling activity increased 52.5 percent in the Western U.S. from October 2010 to October 2011. According to the October 2011 Residential Buildfax Remodeling Index, released this week by BUILDERadius, The Western U.S. showed the largest rate of increase, by far, in its index for October 2011, outpacing all other regions and the U.S. as a whole.
According to Buildfax's October 2011 release:
In October, all regions except the northeast posted year-over-year gains. The West was up 53.6 points (52.5%) year-over-year while the Midwest was up 21.4 points (20.2%) year-over-year. The South was up 9.5 points (10.6%) year-over-year, and the South was down 3.5 points (4.5%) year-over-year.
In the graph, we see that the year-over-year percent change in the western region has outpaced all other regions and the U.S. as a whole for the past five months. Growth rates have been solid in recent months, and October's year-over-year percent change for both the West and the US were the largest in more than nine months.
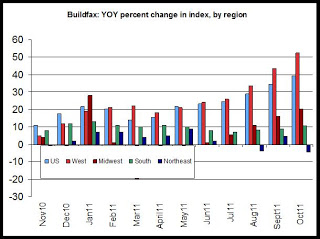
Overall, the report suggests substantial increases in the amount of residential remodeling activity in the economy. Often, remodeling activity reflects an availability of household capital for some construction and home-improvement activities while there may be an absence of the large amounts of household capital necessary for relocation and new home purchases.
The Buildfax press release states that the rise in remodeling activity in most of the nation reflects a national trend in which homeowners have been spending on remodeling as an alternative to home home purchases in a market in which it is difficult to sell one's home.
As we've seen in recent data for new home sales and housing starts, new home construction remains at historic lows. Many homeowners turn to remodeling projects, as is reflected in recent Buildfax reports.
The exception is the Northeast region, which has shown only slight growth and some declines in recent months.
As a supplement, I've included the second graph which shows the year-over-year change in the numeric value of the index by region.
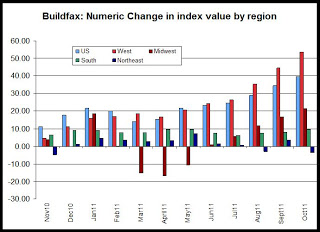
About the BuildFax Remodeling Index
The BuildFax Remodeling Index is based on construction permits filed with local building departments across the country. The index tracks the number of properties permitted. The national and regional indexes all have an initial value of 100 set in April of 2004, are based on a three-month moving average, and are not seasonally adjusted.
According to Buildfax's October 2011 release:
In October, all regions except the northeast posted year-over-year gains. The West was up 53.6 points (52.5%) year-over-year while the Midwest was up 21.4 points (20.2%) year-over-year. The South was up 9.5 points (10.6%) year-over-year, and the South was down 3.5 points (4.5%) year-over-year.
In the graph, we see that the year-over-year percent change in the western region has outpaced all other regions and the U.S. as a whole for the past five months. Growth rates have been solid in recent months, and October's year-over-year percent change for both the West and the US were the largest in more than nine months.

Overall, the report suggests substantial increases in the amount of residential remodeling activity in the economy. Often, remodeling activity reflects an availability of household capital for some construction and home-improvement activities while there may be an absence of the large amounts of household capital necessary for relocation and new home purchases.
The Buildfax press release states that the rise in remodeling activity in most of the nation reflects a national trend in which homeowners have been spending on remodeling as an alternative to home home purchases in a market in which it is difficult to sell one's home.
As we've seen in recent data for new home sales and housing starts, new home construction remains at historic lows. Many homeowners turn to remodeling projects, as is reflected in recent Buildfax reports.
The exception is the Northeast region, which has shown only slight growth and some declines in recent months.
As a supplement, I've included the second graph which shows the year-over-year change in the numeric value of the index by region.

About the BuildFax Remodeling Index
The BuildFax Remodeling Index is based on construction permits filed with local building departments across the country. The index tracks the number of properties permitted. The national and regional indexes all have an initial value of 100 set in April of 2004, are based on a three-month moving average, and are not seasonally adjusted.
Housing News Digest, December 19
US Homebuilders See Surge in Potential Buyers
Not since the spring of 2008 have the nation’s homebuilders felt this good about the potential for new business. An industry association survey measuring builder sentiment rose for the third straight month in December, with significant gains in the component measuring traffic of perspective buyers.
Relaxed housing rules before county commissioners
GLENWOOD SPRINGS, Colorado — Garfield County commissioners are scheduled to have a public hearing this afternoon on their proposal to relax the county's affordable housing rules as an incentive to kick start the lagging housing construction market.
The county's planning commission, in a split vote last week, recommended approval of the code amendment.
The proposal would change the trigger point for residential subdivisions to be required to build deed-restricted affordable housing units from five units to 15.
Fewer mortgage defaults forecast
Colorado ranked No. 11 nationally in foreclosure actions in November, foreclosure listing firm RealtyTrac Inc. said this week. The state often has been in the top 10 for foreclosures.
Elsewhere, credit reporting agency Transunion forecasts Colorado, along with Arizona and Wisconsin, will see the biggest drop in mortgage delinquencies in 2012.
Nationally, fewer U.S. homes entered the foreclosure process or were taken back by banks in November, reflecting a seasonal pullback in foreclosure activity by lenders and mortgage servicers.
Local home building sunk to another recession low in November.
The slide extends a slump that began more than five years ago and ensures that 2011 will go down as Pueblo County's second worst year for home construction, after 1983.
"It's been longer and deeper than anybody anticipated a couple of years ago. It's a tough one. There's no question," said longtime developer Bob Leach of Horizon Communities.
Modification blunders bedevil U.S. housing recovery
Shirley Burnell, a community activist from Oakland, California, has been trying to get her subprime loan restructured since 2007.
She never missed a payment, but the adjustable rate mortgage she got in 2004 shot up to a monthly payment she could no longer afford.
First she provided documents without getting any response, then she was denied in April by her servicer, Bank of America (BAC.N), for not providing documents it never actually asked for.
Friday, December 16, 2011
Consumer price increase in west rises to four-year high
The Bureau of Labor Statistics released today the November CPI for US urban areas and regions. In the West region, from November 2010 to November 2011, the CPI increased 3.2 percent. This is a significant increase over the year-over-year increases for November during 2008, 2009 or 2010, during which the change in CPI never exceeded 1.5 percent.
In the first graph, we can see that the CPI growth in November 2011 is now tied with November 2005 for the third-highest increase observed for November during the past ten years. Only 2004 and 2007 showed larger increases, and price increases in those years were partially countered by strong growth in employment and incomes, but at the present time, income growth has been flat in recent years, as discussed here.
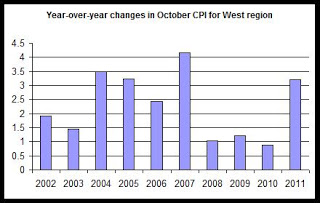
The price increases are being largely driven by transportation costs, such as gasoline, which increased by 7.2 percent, year over year. Food costs and apparel also increased significantly, rising 4.1 percent and 4.7 percent, respectively.
Housing prices were restrained at a year-over-year increase of 1.8 percent. Although increases in rent have exceeded 5 percent in many areas of the state, the housing component of CPI also reflects declining home prices, which mitigate the increases in rent levels within the index.
Recent price increases will impact household calculations and attitudes on spending as many households conclude that discretionary spending will need to be scaled back in the face of increasing food and transportation costs.
This in turn will have effects on home purchase activity as well. Note: In addition to the issue of disposable income is the issue of interest rates. Should the Federal Reserve conclude that inflation does need to be addressed, the resulting increase in interest rates would also push down home purchase activity. (Recent declines in the mortgage rate have not spurred large amounts or refinance or purchase activity, as noted here.)
The second graph shows year-over-year changes in CPI for all months since 2002. If current trends continue, CPI growth will return to pre-recession levels in coming months.
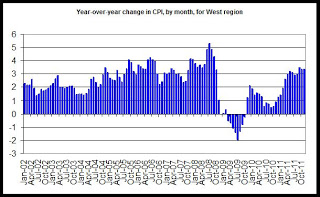
Nationally, the CPI was unchanged for the second month in a row:
In the first graph, we can see that the CPI growth in November 2011 is now tied with November 2005 for the third-highest increase observed for November during the past ten years. Only 2004 and 2007 showed larger increases, and price increases in those years were partially countered by strong growth in employment and incomes, but at the present time, income growth has been flat in recent years, as discussed here.

The price increases are being largely driven by transportation costs, such as gasoline, which increased by 7.2 percent, year over year. Food costs and apparel also increased significantly, rising 4.1 percent and 4.7 percent, respectively.
Housing prices were restrained at a year-over-year increase of 1.8 percent. Although increases in rent have exceeded 5 percent in many areas of the state, the housing component of CPI also reflects declining home prices, which mitigate the increases in rent levels within the index.
Recent price increases will impact household calculations and attitudes on spending as many households conclude that discretionary spending will need to be scaled back in the face of increasing food and transportation costs.
This in turn will have effects on home purchase activity as well. Note: In addition to the issue of disposable income is the issue of interest rates. Should the Federal Reserve conclude that inflation does need to be addressed, the resulting increase in interest rates would also push down home purchase activity. (Recent declines in the mortgage rate have not spurred large amounts or refinance or purchase activity, as noted here.)
The second graph shows year-over-year changes in CPI for all months since 2002. If current trends continue, CPI growth will return to pre-recession levels in coming months.

Nationally, the CPI was unchanged for the second month in a row:
The Consumer Price Index for All Urban Consumers (CPI-U) was
unchanged in November on a seasonally adjusted basis, the U.S. Bureau
of Labor Statistics reported today. Over the last 12 months, the all
items index increased 3.4 percent before seasonal adjustment.
The energy index declined for the second month in a row and offset
increases in the indexes for food and all items less food and energy.
As in October, the gasoline index fell sharply and the index for
household energy declined as well. The food index rose slightly in
November, though the index for food at home declined as four of the
six major grocery store food group indexes fell.
Housing News Digest, December 16
Single dorm rooms on the rise at colleges
"This generation of students has grown up with their private bedrooms," said Terry Giardino, assistant facilities director at Montclair State. Many also like the security of a single because they think it's safer for their expensive laptops and other electronics.
Increased interest in single rooms started in the 1990s, but has now become a nationwide trend with many schools planning and building dormitories with singles, often configured in suites with shared bathrooms and lounge areas.
"The days of a common bathroom at the end of the hallway are gone," declared Karen Pennington, vice president for student development and campus life at Montclair.
UBS forecaster: Negative real estate outlook in U.S., Colorado
The Colorado and U.S. residential and commercial real estate markets will likely “bounce along the bottom” for the next three to five years, with the multifamily sector being the bright spot, according to Jonathan Woloshin of UBS.
The large amount of negative equity in the system (people who owe more than their homes are worth) and low median price on foreclosed homes will have a depressing effect on the residential market for several years, according to Woloshin.
Colorado Springs commercial real estate sales still stalled
Commercial real estate in the Pikes Peak region has taken a few small steps forward on its way toward a recovery, yet don't expect significant gains next year, according to a forecast by Sierra Commercial Real Estate, a Colorado Springs brokerage.
Businesses are leasing new office and retail space, investors are purchasing commercial properties and some retailers and industrial users have announced expansion plans, Sierra officials said.
Freddie Mac Mandates Servicer Participation in State Mortgage Programs
Freddie Mac has notified servicers that they are required to take part in mortgage assistance programs offered by state Housing Finance Agencies (HFAs) in connection with the federal government’s Hardest Hit Fund initiative.
“[E]ffective immediately, you must begin accepting modification assistance program funds from participating HFAs on behalf of eligible borrowers with Freddie Mac-owned or guaranteed mortgages,” the McLean, Virginia-based GSE wrote in a bulletin update sent to its mortgage servicers on Tuesday.
Thursday, December 15, 2011
October multifamily: El Paso, Denver, Jefferson and Larimer counties dominate
During the first ten months of 2011, 87 percent of new multifamily permits issued have been issued in Larimer, Jefferson, Denver, and El Paso counties. Prior to June 2011, virtually all new permits had been issued in only Larimer, Denver and El Paso counties, but Jefferson County has recently issued permits for more than 500 new multifamily units. Arapahoe county issued multifamily units for the first time this year during September, with 188 new units permitted.
According to new multifamily permit data for Colorado counties, 3,305 multifamily permits have been issued from January through October of this year. 2,877 of them were issued in Larimer, Denver, Jefferson, and El Paso counties.
The remaining 428 permits were issued in Arapahoe, Mesa, Boulder and Douglas counties. No other county in the state reported any new multifamily permits issued so far this year.
For more historical info on multifamily permits, see here.
In the map below, we see that the geographic distribution of new multifamily permits.
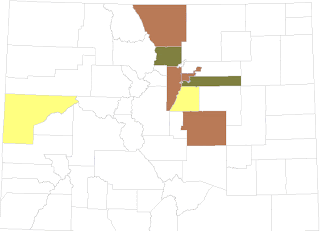
Brown: More than 400 permits issued in 2011
Green: 100-399 permits issued in 2011
Yellow: fewer than 100 permits issued in 2011
White: no permits issued, or no data
Total multifamily permits issued, Jan-Sept 2011
Adams 0
Arapahoe 188
Boulder 103
Broomfield 0
Denver 1,262
Douglas 73
El Paso 657
Jefferson 504
Larimer 454
Mesa 64
Pueblo 0
Weld 0
With so little demand for new condominiums right now, it is safe to assume that the lopsided majority of new multifamily permits being issued are for rental housing. We see most of this activity in areas where vacancy rates have been tight or look to be tight for the near to mid-term.
With apartment vacancy rates headed below five percent in the Denver, Larimer and El Paso counties, the markets appear to be responding to tight vacancies with plans for future construction.
Year-over-year change:
The following show the year-over-year percent changes in new multifamily permits from January-October 2010 to the same period this year.
Adams -100%
Arapahoe -59%
Boulder -65%
Denver +242%
Douglas +386%
El Paso +9,285%
Jefferson +36%
Larimer +23%
Mesa +33%
Pueblo -100%
Pueblo County declined from 17 permits during the first nine months of last year, to zero permits during the same period this year. Adams declined from 27 permits to zero permits over the same period.
According to new multifamily permit data for Colorado counties, 3,305 multifamily permits have been issued from January through October of this year. 2,877 of them were issued in Larimer, Denver, Jefferson, and El Paso counties.
The remaining 428 permits were issued in Arapahoe, Mesa, Boulder and Douglas counties. No other county in the state reported any new multifamily permits issued so far this year.
For more historical info on multifamily permits, see here.
In the map below, we see that the geographic distribution of new multifamily permits.

Brown: More than 400 permits issued in 2011
Green: 100-399 permits issued in 2011
Yellow: fewer than 100 permits issued in 2011
White: no permits issued, or no data
Total multifamily permits issued, Jan-Sept 2011
Adams 0
Arapahoe 188
Boulder 103
Broomfield 0
Denver 1,262
Douglas 73
El Paso 657
Jefferson 504
Larimer 454
Mesa 64
Pueblo 0
Weld 0
With so little demand for new condominiums right now, it is safe to assume that the lopsided majority of new multifamily permits being issued are for rental housing. We see most of this activity in areas where vacancy rates have been tight or look to be tight for the near to mid-term.
With apartment vacancy rates headed below five percent in the Denver, Larimer and El Paso counties, the markets appear to be responding to tight vacancies with plans for future construction.
Year-over-year change:
The following show the year-over-year percent changes in new multifamily permits from January-October 2010 to the same period this year.
Adams -100%
Arapahoe -59%
Boulder -65%
Denver +242%
Douglas +386%
El Paso +9,285%
Jefferson +36%
Larimer +23%
Mesa +33%
Pueblo -100%
Pueblo County declined from 17 permits during the first nine months of last year, to zero permits during the same period this year. Adams declined from 27 permits to zero permits over the same period.
Condo and townhome sales edge up in metro Denver, statewide
Condo and townhome sales in metro Denver and statewide increased, year over year, for the fourth month in a row in October. According to condo and townhome sales data released by the Colorado Association of Realtors, sales increased 18 percent in October 2011 from the same month a year earlier. They increased 20.8 percent in metro Denver over the same period. In the Pikes Peak region, on the other hand, October sales decreased 18.5 percent. In October, there were 1,067 sales statewide. 700 of them were in metro Denver and 79 were in the Pikes Peak region.
This recent growth trend in statewide and metro Denver sales is now seen in the 12-month moving averages used to track trends in home sales. The highly-cyclical nature of home sales trends makes it difficult to track multi-year trends in home sales. The addition of the homebuyer tax credits from 2008 to 2010 further complicated the picture. So, I have smoothed out the sales totals using a 12-month moving average for each month.
The first graph shows the 12-month moving averages in total condo and townhome sales in metro Denver and statewide. The overall trends since 2007 is clearly downward, although average statewide sales have largely stabilized since late 2009. Until recently, the moving average for condo and townhome sales had continued to move downward through late 2010 and most of 2011, although there have been some gains in recent months.
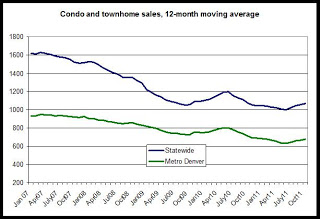
The second graph shows year-over-year changes in the 12-month condo and townhome sales average. We see increases during 2010 following the end of the homebuyer tax credit period. The year-over-year changes moved back into negative territory by early 2011, and the year-over-year change in the moving average, in both metro Denver and statewide, has remained negative for the past twelve months. The magnitude of the the decline for each month has lessened in both areas over the past four months. If the current trend continues, condo and townhome sales will show positive year-over-year changes in average sales by Spring of 2012.
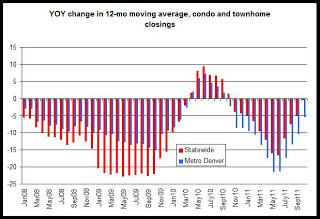
In the Pikes peak region, similar trends hold, although the homebuyer tax credits seem to have had a broader impact with the year over year change in sales remaining in positive territory for 15 months in a row. As can be seen in the third graph, sales activity has since declined, and the year over year changes in recent months have decreased by more than ten percent each month in recent months, suggesting that condo and townhome sales in this market have not yet achieved as much stability as are being seen in metro Denver and statewide.
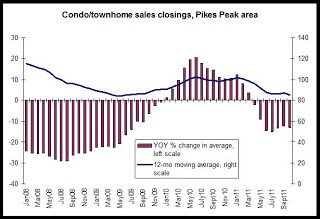
This recent growth trend in statewide and metro Denver sales is now seen in the 12-month moving averages used to track trends in home sales. The highly-cyclical nature of home sales trends makes it difficult to track multi-year trends in home sales. The addition of the homebuyer tax credits from 2008 to 2010 further complicated the picture. So, I have smoothed out the sales totals using a 12-month moving average for each month.
The first graph shows the 12-month moving averages in total condo and townhome sales in metro Denver and statewide. The overall trends since 2007 is clearly downward, although average statewide sales have largely stabilized since late 2009. Until recently, the moving average for condo and townhome sales had continued to move downward through late 2010 and most of 2011, although there have been some gains in recent months.

The second graph shows year-over-year changes in the 12-month condo and townhome sales average. We see increases during 2010 following the end of the homebuyer tax credit period. The year-over-year changes moved back into negative territory by early 2011, and the year-over-year change in the moving average, in both metro Denver and statewide, has remained negative for the past twelve months. The magnitude of the the decline for each month has lessened in both areas over the past four months. If the current trend continues, condo and townhome sales will show positive year-over-year changes in average sales by Spring of 2012.

In the Pikes peak region, similar trends hold, although the homebuyer tax credits seem to have had a broader impact with the year over year change in sales remaining in positive territory for 15 months in a row. As can be seen in the third graph, sales activity has since declined, and the year over year changes in recent months have decreased by more than ten percent each month in recent months, suggesting that condo and townhome sales in this market have not yet achieved as much stability as are being seen in metro Denver and statewide.

Labels:
colorado,
colorado springs,
home prices,
home sales,
metro denver
Condo prices inch up in metro Denver, fall statewide
The median price for condos and townhomes in the metro Denver area increased 2.4 percent, year over year, in October of this year. According to home price information for condos and townhomes, released by the Colorado Association of Realtors, the median price in the region rose to $128,000 from last October's median price of $125,000. Statewide, the median price fell 16.7 percent, falling from October 2010's price of $136,600 to October 2011's price of $113,750. In the Pikes Peak region, the median price fell 16.9 percent to $105,000 during October, falling from October 2010's price of $126,400.
Condo and townhome prices remain well below peak median prices in each region. The statewide median price for condos and townhomes in October was down 51 percent from the March 2006 peak of $236,200. In metro Denver, the median price in October was down21.5 percent from the July 06 peak of $163,300, and the Pikes Peak-area median price for condos and townhomes in October was down 35.3 percent from the September 2007 peak of $162,300.
The first graph shows the median home price in each area for each month since 2006.

Condo and townhome prices do not appear to have stabilized as single-family homes have, and median prices appear to be continuing a slow downward trend. The substantial declines in statewide median prices for condos and townhomes are likely being pushed downward by significant drops in median prices for condos and townhomes in many mountain regions following the 2008 financial crisis.
The second graph shows year over year changes in median home prices for condos and townhomes. With the exception of the 2.4 percent increase during October 2011 for metro Denver, all three areas have reported declines in the median home price since February 2011. The overall trend in home prices among condos and townhomes over the past year has been down, although the recent increase in metro Denver does point toward some added stability in the Denver metro market.

Condo and townhome prices remain well below peak median prices in each region. The statewide median price for condos and townhomes in October was down 51 percent from the March 2006 peak of $236,200. In metro Denver, the median price in October was down21.5 percent from the July 06 peak of $163,300, and the Pikes Peak-area median price for condos and townhomes in October was down 35.3 percent from the September 2007 peak of $162,300.
The first graph shows the median home price in each area for each month since 2006.

Condo and townhome prices do not appear to have stabilized as single-family homes have, and median prices appear to be continuing a slow downward trend. The substantial declines in statewide median prices for condos and townhomes are likely being pushed downward by significant drops in median prices for condos and townhomes in many mountain regions following the 2008 financial crisis.
The second graph shows year over year changes in median home prices for condos and townhomes. With the exception of the 2.4 percent increase during October 2011 for metro Denver, all three areas have reported declines in the median home price since February 2011. The overall trend in home prices among condos and townhomes over the past year has been down, although the recent increase in metro Denver does point toward some added stability in the Denver metro market.

Labels:
colorado,
colorado springs,
home prices,
metro denver
Subscribe to:
Posts (Atom)