According to the June report from the S&P;/Case-Shiller Home Price Index, including data up through June, many cities measured by the index showed improvement from June to July. The increase largely reflects seasonal factors.
The month-to-month change was primarily due to seasonal factors, and the year-over-year change showed a continued slow decline in home prices.
According to the press release issued by S&P;:
With the second quarter’s data, the National Index recovered from its first
quarter low, but still posted an annual decline of 5.9% versus the second quarter of 2010. Nationally, home prices are back to their early 2003 levels.
As of June 2011, 19 of the 20 MSAs covered by S&P;/Case-Shiller Home Price Indices and both monthly composites were up versus May - Portland was flat. However, they were all down compared to June 2010. Twelve of the 20 MSAs and both Composites have now increased for three consecutive months, a sign of the seasonal strength in the housing market. None of the markets posted new lows with June’s report. Minneapolis posted a double-digit 10.8% annual decline; Portland is not far behind at -9.6%.
Thirteen of the cities and both composites saw improvements in their annual rates; however; they all are in negative territory and have been so for three consecutive months.
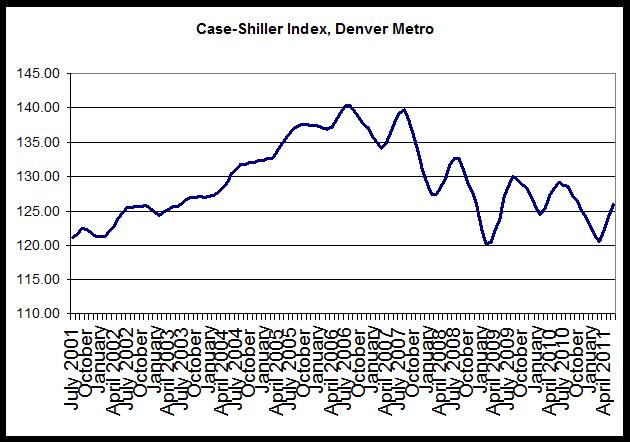
In the Denver area, the home price index is now at a level comparable to that seen in late 2003. The index value for June 2011 was 125.9, and during December 2003, the index value was 126.9.
The first chart shows the the home price index for the Denver area back to 2001.
The index dropped, year-over-year, in all cities measured. Denver's market showed a less-small decrease than all but two of the 20 cities measured in the index. Boston and Washington, DC declined, year over year, by 2.1 percent and 1.2 percent, respectively.
Minneapolis and Portland reported the largest declines with the home prices dropping year over year by 10.8 percent and 9.6 percent, respectively.
The second chart shows trends in the Case-Shiller index for the Denver area and for the 20-city composite index. It is clear that Denver did not experience the kind of price bubble that occurred in many other metropolitan areas, and consequently, the index has not fallen nearly as far in Denver compared to the larger composite. Prices have been largely flat since mid-2009.
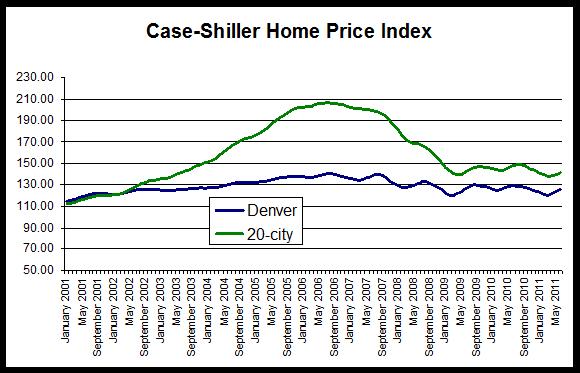
The 20-city composite is down 31.5 percent since it peaked in July 2006, but the Denver index is down only 10.2 percent from its August 2006 peak.
Nevertheless, the Denver index has returned to 2003 levels. In addition, the Denver Index remains near the lowest level experienced since July 2009, and is now 4.7 percent above where it was when it hit its initial recessionary trough in March 2009. The Denver Index was 125.9 during June 2011, and it was 129.2 during June 2010.
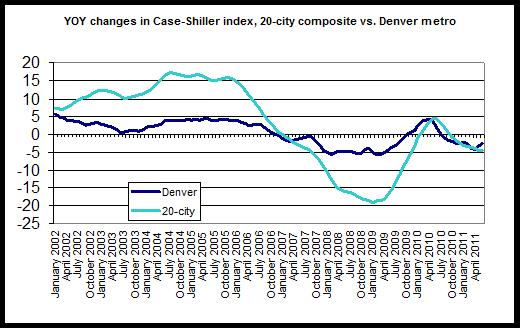
The third chart compares year-over-year changes in the Denver area index and in the 20-city composite. The Denver index did not achieve the rates of growth experienced by the national index, but the Denver index did not experience comparable rates of decline following the onset of the national recession either. Overall, the index has been less volatile in Denver than has been the case for the 20-city composite. However, year-over-year change in the 20-city composite during June was negative with a decrease of 4.5 percent, and the Denver area index’s fall of 3.3 percent is the twelfth month in a row in which the growth rate has been negative. In the 20-city index, the year-over-year change has only been negative for the most recent nine months. June 2011 was the second month in a row in which the index's decline in Denver was smaller than the 20-city composite decline.
The last chart provides a closer look at year-over-year changes in the Denver index. Note that for July 2010 through July 2010, the change has fallen below zero, and reflects the end of the homebuyer tax credit’s end which has led to a fall in demand and a decline in the home price index. The upward trend in the index in response to the tax credit is clear during late 2009 and early 2010.
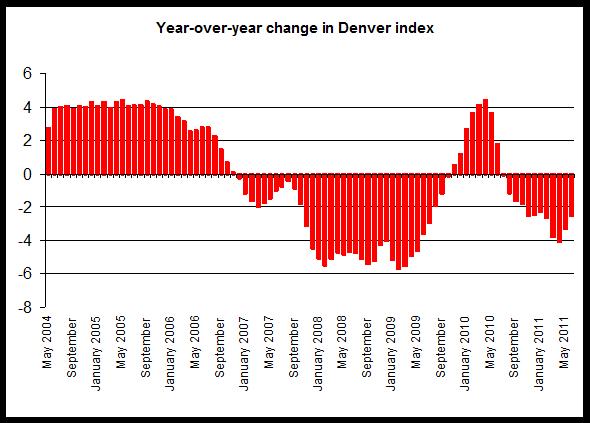
In recent months, the Denver index has been slightly above the indices for the same months of 2009. Comparisons with the same period of 2010 is problematic given the large effects of the end of the tax credit. Comparing to 2009, we see that prices have still moved little since the first half of 2009 when the index was in the 120-123 range. During the first half of 2011, the Denver index has been in the 122-124 range, signalling very limited growth over the past two years.