We have posted revised vacancy data for the statewide report. The Eagle County vacancy number was revised downward, and this revision also pushed down the statewide composite vacancy number to 5.1 percent. The previously-posted statewide vacancy had been 5.2 percent.
The revised reports are posted at the main CDH site.
Thursday, June 7, 2012
Tuesday, June 5, 2012
Train the Trainer: On-site Energy Code Plan Review and Inspection
Train-the-Trainer Curriculum
On Site Plan Review and Inspection Education
(Site Education)
June 27-28, 2012
Parker, CO
On Site Plan Review and Inspection Education
(Site Education)
June 27-28, 2012
Parker, CO
A Train-the-Trainer
will be offered for On-site Energy Code
Plan Review and Inspection in Parker, Colorado on June 27th &
28th. The training
will be hosted by PNNL and DOE’s Building Technologies
Program.
The purpose of the
train-the-trainer session is to provide professional and qualified energy code
specialists and education providers with curricula; process and content for
employing a part-day education-oriented site visit at individual jurisdictions.
As such, the course is not energy code training, it has been created for
experienced educators and energy code professionals wishing to provide on-site
training.
Click here for more information.
Space is limited to
a maximum of 40 attendees.
To register
contact:
Shaunna
Mozingo
Energy Code Consultant/Plans Analyst
Colorado Code Consulting, LLC
4610 S. Ulster St., Ste 150
Denver, CO 80221
[email protected]
(303) 598-3465 direct line
Energy Code Consultant/Plans Analyst
Colorado Code Consulting, LLC
4610 S. Ulster St., Ste 150
Denver, CO 80221
[email protected]
(303) 598-3465 direct line
Douglas, Weld Counties top counties for new single-family permits in 2012
Of the 2,977 new single-family permits issued during the first four
months of 2012, 1,718 of them, or 57 percent, were issued in El Paso, Weld, Douglas and Larimer counties alone. According to new single-family February permit data by
county, released by the Census Bureau,
the counties with the largest numbers of single-family permits issued
during the first four months of 2012 were El Paso, Douglas, Weld and Larimer, with El Paso reporting more single-family permits during the period than any other county.
See here for recent posts about building permits.
New single-family permits during January-April 2012
El Paso 609
Douglas 464
Weld 344
Larimer 301
Also:
Adams 196
Arapahoe 230
Boulder 68
Broomfield 68
Chaffee 36
Elbert 12
Jefferson 207
Mesa 105
Park 13
Pueblo 44
Routt 11
Teller 12
(Note: All permits discussed in this article are single-family permits.)
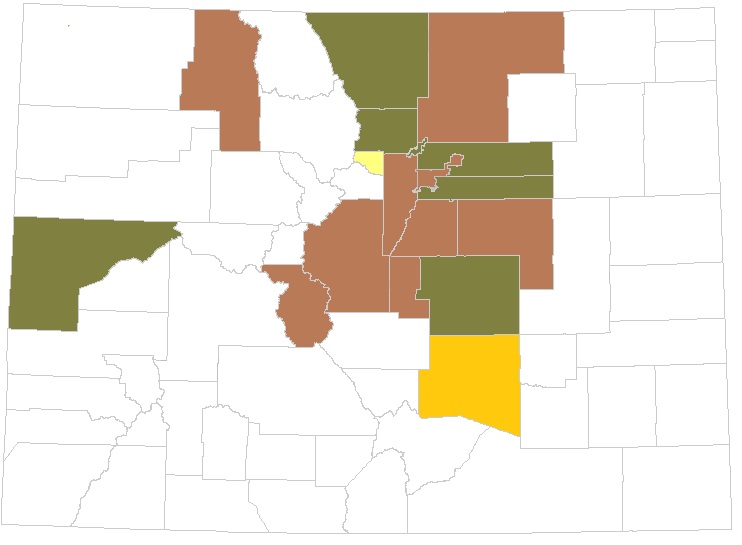
However, when permit totals are adjusted to the number of existing housing units in each county, the counties with the larges amounts of permit activity were Douglas, Weld and Chaffee counties.These three counties have reported the highest permitting rate for several months.
The first map shows the relative amount of single-family permit activity adjusted for the existing size of the housing stock in each county. The counties are then broken out in quartiles reflecting the amount of single-family activity compared to other counties. The top quartile has the largest amount of new permitting compared to the number of existing units. The bottom quartile has the smallest amount.
Top Q: Brown
2nd Q: Green
3rd Q: Orange
Bottom Q: Tan
No data or zero permits: White
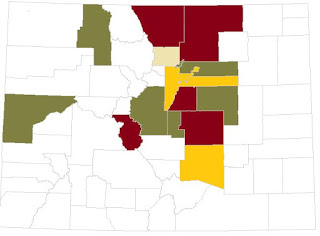
During the first four months of 2012, the metro counties with relatively few new single-family permits relative to the size of the existing stock are Pueblo, Jefferson, Arapahoe, Denver and Boulder counties.
In a larger context, single-family permits remain well below totals experienced prior to 2007. From 2006 to 2008, single-family permits in the state decreased 60 percent from 31,000 to 12,000. Permit activity appears to have bottomed out in 2009. When discussing permit activity from 2008 to the present time, even in areas that report substantial increases, we're looking at permit totals that are near 20-year lows.However, growth rates during 2012 so far has been greater than what has been seen in recent years.
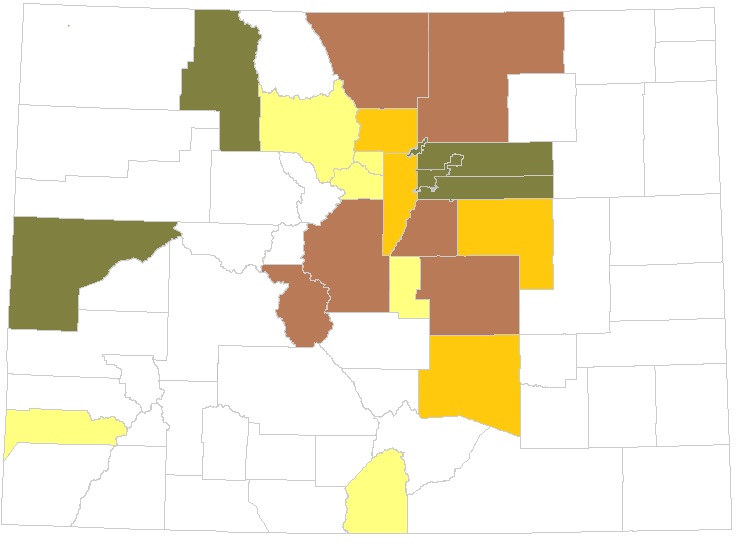
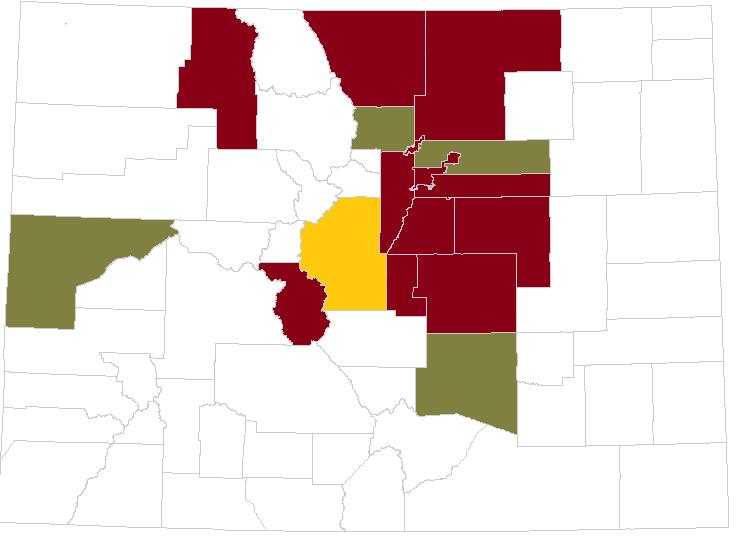
It is also helpful to see which counties have shown the largest increases and decreases in permit activity. In the map below, we see that comparing January-April 2011 to January-April 2012, several metro counties reported year-over-year increases of 50 percent or more. No metro counties reported decreases.

Brown: Increase of 50 percent or more
Green: Increase of 1 to 49.9 percent
Orange: Decrease of 1 to 49.9 percent
Tan: Decrease of 50 percent or more
White: No data or no change.
Largest increases among metro counties:
Denver 58 percent
Weld 86 percent
Douglas 172 percent
See here for recent posts about building permits.
New single-family permits during January-April 2012
El Paso 609
Douglas 464
Weld 344
Larimer 301
Also:
Adams 196
Arapahoe 230
Boulder 68
Broomfield 68
Chaffee 36
Elbert 12
Jefferson 207
Mesa 105
Park 13
Pueblo 44
Routt 11
Teller 12
(Note: All permits discussed in this article are single-family permits.)
However, when permit totals are adjusted to the number of existing housing units in each county, the counties with the larges amounts of permit activity were Douglas, Weld and Chaffee counties.These three counties have reported the highest permitting rate for several months.
The first map shows the relative amount of single-family permit activity adjusted for the existing size of the housing stock in each county. The counties are then broken out in quartiles reflecting the amount of single-family activity compared to other counties. The top quartile has the largest amount of new permitting compared to the number of existing units. The bottom quartile has the smallest amount.
Top Q: Brown
2nd Q: Green
3rd Q: Orange
Bottom Q: Tan
No data or zero permits: White

During the first four months of 2012, the metro counties with relatively few new single-family permits relative to the size of the existing stock are Pueblo, Jefferson, Arapahoe, Denver and Boulder counties.
In a larger context, single-family permits remain well below totals experienced prior to 2007. From 2006 to 2008, single-family permits in the state decreased 60 percent from 31,000 to 12,000. Permit activity appears to have bottomed out in 2009. When discussing permit activity from 2008 to the present time, even in areas that report substantial increases, we're looking at permit totals that are near 20-year lows.However, growth rates during 2012 so far has been greater than what has been seen in recent years.
It is also helpful to see which counties have shown the largest increases and decreases in permit activity. In the map below, we see that comparing January-April 2011 to January-April 2012, several metro counties reported year-over-year increases of 50 percent or more. No metro counties reported decreases.
Brown: Increase of 50 percent or more
Green: Increase of 1 to 49.9 percent
Orange: Decrease of 1 to 49.9 percent
Tan: Decrease of 50 percent or more
White: No data or no change.
Largest increases among metro counties:
Denver 58 percent
Weld 86 percent
Douglas 172 percent
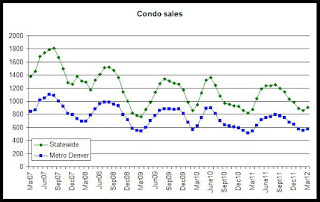
Condo sales rise in Metro Denver, statewide
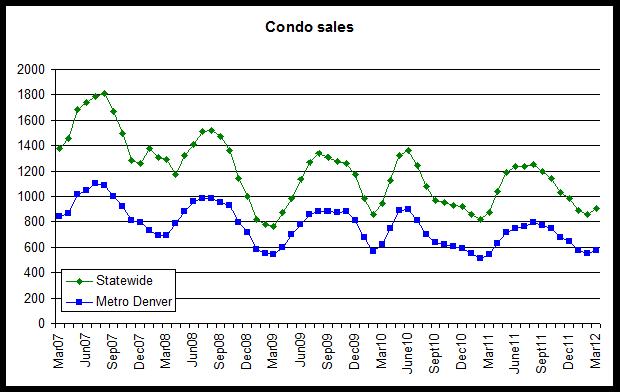
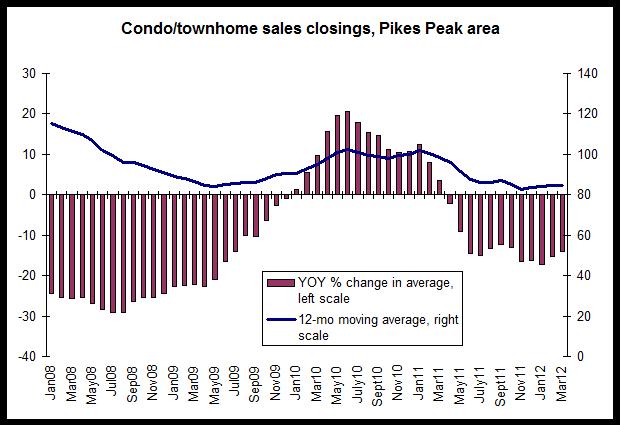
Condo and townhome sales were up in metro Denver, the Pikes Peak area
and statewide during March 2012. According to the condo sales index,
based on a three-month moving average, March 2012's sales total was at a
two-year high in both Metro Denver and statewide. March 2012's sales
total was up 4 percent statewide, compared to March 2011, while metro
Denver's March 2012 sales total was up 5.9 percent compared to March
2011.
March's totals, however, were below 2010 levels in both cases.
The first graph shows that condo and townhome sales activity has been slightly down over the past twelve months when compared to the same period for 2010. The recent decline is quite small, however, compared to the drops we saw from 2008 to 2009.
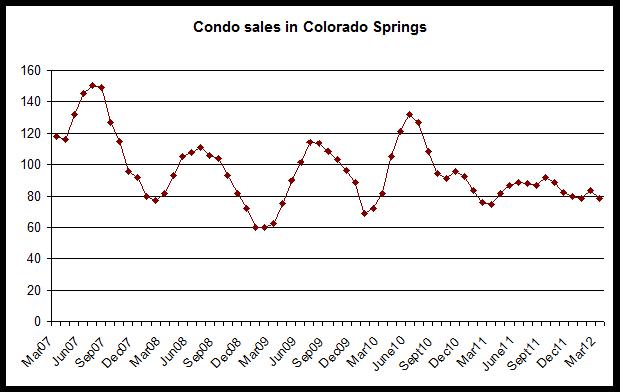
In the Pikes Peak area, condo and townhome sales are up from 2009 and 2011 levels, but have shown signs of stalling in recent months.
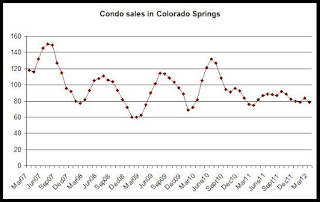
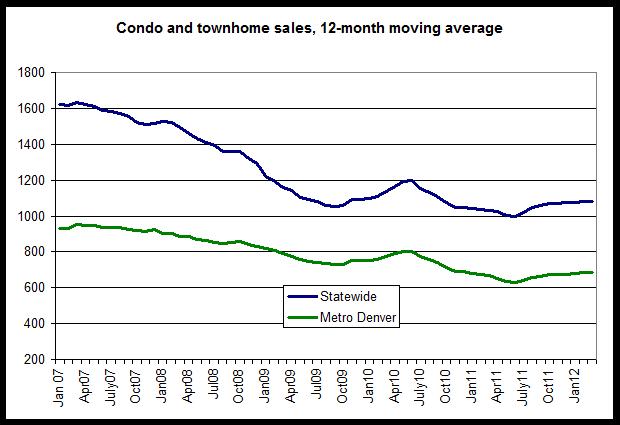
We can remove seasonal effects by using a 12-month moving average which will give us a good view of multi-year trends:
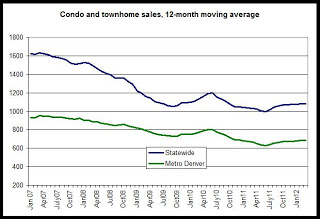
This recent growth trend in statewide and metro Denver sales is reinforced in the 12-month moving averages used to track trends in home sales.The third graph shows the 12-month moving averages in total condo and townhome sales in metro Denver and statewide. The overall trends since 2007 is clearly downward, although average statewide sales have largely stabilized since late 2009. Until recently, the moving average for condo and townhome sales had continued to move downward through late 2010 and most of 2011, but there have been numerous small increases in recent months.
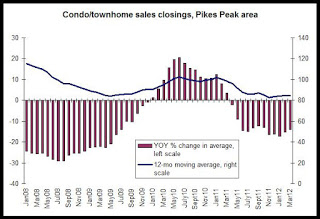
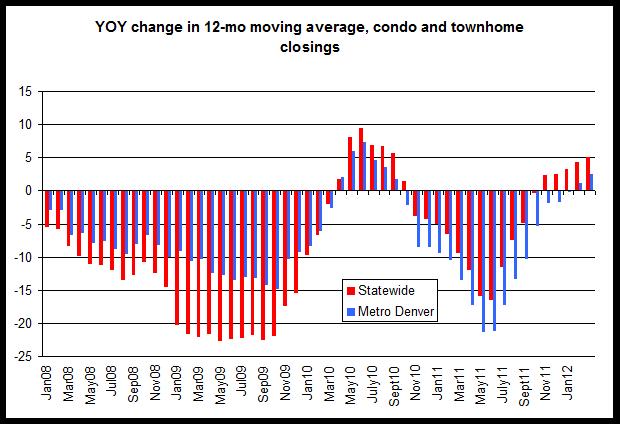
 The fourth graph shows year-over-year changes in the 12-month condo and
townhome sales average. The moving average in statewide sales
increased 4.9 percent, which was the largest year-over-year increase
since September 2010. The metro Denver average rose 2.4 percent and was
the largest year over year increase for metro Denver since August 2010.
The fourth graph shows year-over-year changes in the 12-month condo and
townhome sales average. The moving average in statewide sales
increased 4.9 percent, which was the largest year-over-year increase
since September 2010. The metro Denver average rose 2.4 percent and was
the largest year over year increase for metro Denver since August 2010.

In the Pikes peak region, the trend is still downward, and following the end of the homebuyer tax credit, we have seen 12 months in a row during which the the 12-month moving average in condo and townhome sales have been down from the year prior. Although March numbers indicated some growth over 2011, there has not yet been enough growth in sales activity to be reflected in the 12-month average. In the 12-month average, condo sales were down 13 percent, year over year, in March 2012.
March's totals, however, were below 2010 levels in both cases.
The first graph shows that condo and townhome sales activity has been slightly down over the past twelve months when compared to the same period for 2010. The recent decline is quite small, however, compared to the drops we saw from 2008 to 2009.
In the Pikes Peak area, condo and townhome sales are up from 2009 and 2011 levels, but have shown signs of stalling in recent months.
We can remove seasonal effects by using a 12-month moving average which will give us a good view of multi-year trends:
This recent growth trend in statewide and metro Denver sales is reinforced in the 12-month moving averages used to track trends in home sales.The third graph shows the 12-month moving averages in total condo and townhome sales in metro Denver and statewide. The overall trends since 2007 is clearly downward, although average statewide sales have largely stabilized since late 2009. Until recently, the moving average for condo and townhome sales had continued to move downward through late 2010 and most of 2011, but there have been numerous small increases in recent months.
In the Pikes peak region, the trend is still downward, and following the end of the homebuyer tax credit, we have seen 12 months in a row during which the the 12-month moving average in condo and townhome sales have been down from the year prior. Although March numbers indicated some growth over 2011, there has not yet been enough growth in sales activity to be reflected in the 12-month average. In the 12-month average, condo sales were down 13 percent, year over year, in March 2012.
Monday, June 4, 2012
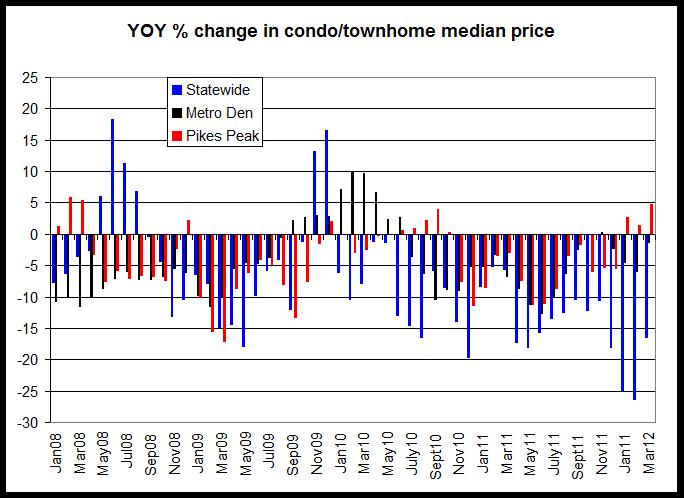
Condo prices continue to slide
The median price for condos and townhomes in the metro Denver area
decreased 1.5 percent, year over year, in March 2012. According to
home price information for condos and townhomes, released by the
Colorado Association of Realtors, the median price in the region fell to
$121,505 from March 2011's median price of $123,356. Statewide, the
median price fell 16 percent, falling from March 2011's price of
$142,037 to March 2012's price of $118,414. In the Pikes Peak region,
the median price rose 4.7 percent to $130,971 during March, rising
from March 2011's price of $123,356.(The monthly median prices discussed in this article are 3-month moving averages.)
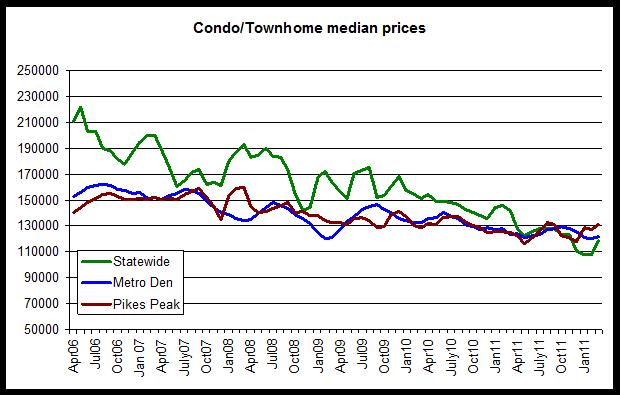
As can be seen in the first graph, condo prices continue to slide from peak levels reached back in 2006. Unlike single-family prices which quickly fell in 2009 and then rebounded somewhat, condo prices have seen a long slide over the past several years. The largest decline is seen in the statewide condo prices, and this is likely due to large dropoffs in prices for condo found in several mountain communities.
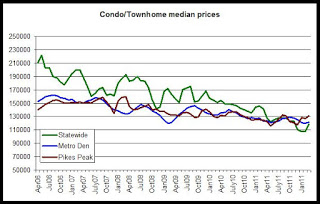
As expected, the data shows that prices in condos and townhomes are significantly lower than single-family home prices. In recent months, the statewide median price has fallen below that found in both metro Denver and in the Pikes Peak region.
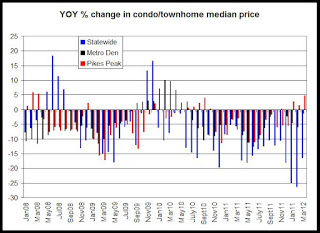
The second graph shows year over year changes in median home prices for condos and townhomes. Metro Denver produced a small price increase during November, but for the most part, year over yeach changes in prices have been all negative since mid-2010. Statewide, year over year drops have been large, with each month showing a 15 percent or more drop for each month from December 2011 to March 2012. Only the Pikes Peak region has shown in increases over the past three months.
Clearly, the overall trend in home prices among condos and townhomes over the past year has been down. Recent increases in demand for single-family homes has not yet been felt in condos and townhomes to any significant degree.
As can be seen in the first graph, condo prices continue to slide from peak levels reached back in 2006. Unlike single-family prices which quickly fell in 2009 and then rebounded somewhat, condo prices have seen a long slide over the past several years. The largest decline is seen in the statewide condo prices, and this is likely due to large dropoffs in prices for condo found in several mountain communities.
As expected, the data shows that prices in condos and townhomes are significantly lower than single-family home prices. In recent months, the statewide median price has fallen below that found in both metro Denver and in the Pikes Peak region.
The second graph shows year over year changes in median home prices for condos and townhomes. Metro Denver produced a small price increase during November, but for the most part, year over yeach changes in prices have been all negative since mid-2010. Statewide, year over year drops have been large, with each month showing a 15 percent or more drop for each month from December 2011 to March 2012. Only the Pikes Peak region has shown in increases over the past three months.
Clearly, the overall trend in home prices among condos and townhomes over the past year has been down. Recent increases in demand for single-family homes has not yet been felt in condos and townhomes to any significant degree.
Realtors: Median home prices fall in Colo. Springs, flat in metro Denver
Median home prices for single-family homes during March 2012 fell
in Colorado and in the Pikes Peak region, and were flat in the metro Denver area.
According to median home price data
for March, released by the Colorado Association of Realtors, the
median home price for single-family homes in the Denver area was
$229,343 during March, which is an decrease of 0.007 percent from March of 2011. In other words, the metro Denver price is unchanged, year over year. Statewide, the median home price was $223,492 during March, a drop of 4.2 percent from the same month last year. The median
price in the Pikes Peak region fell 3.2 percent, year over year, falling
to $190,928 during March. (The values presented here are actually 3-month moving averages for each month, so March's median prices are averages of January, February and March prices.)This article discusses single-family median home prices only.
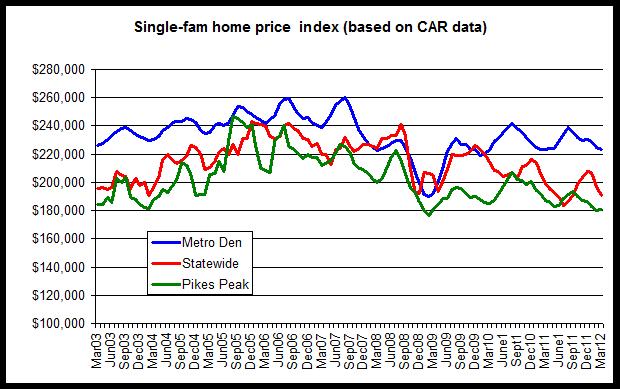
The first graph shows the median single-family home price for the state and for the metro Denver and Pikes Peak regions. Median home prices fell dramatically in all three measures following the financial crisis of late 2008, but moved back up quickly by mid-2009. Since mid-2009, however, median home prices have been largely flat in metro Denver. In the Pikes Peak region, on the other hand, the median price remains well below peak levels and continues to decline slowly following a new 2010 peak. Statewide, as is typical, the median price has been more volatile, but has not recovered as much as the metro Denver median. Statewide, declining prices in western Colorado are a factor in statewide price declines.
The metro Denver area, where the median price is 14 percent below its August 2007 peak levels, has recovered the most. Metro Denver prices appear to have stabilized since 2009 and the median price generally moves between 220K and 240K. The statewide median price is now 20 percent below its August 2008 peak. The Pikes Peak median price fell in January to 26 percent below its July 05 peak, falling to 180K. The Pikes Peak area's median price ranged between 180K and 195K during 2011.
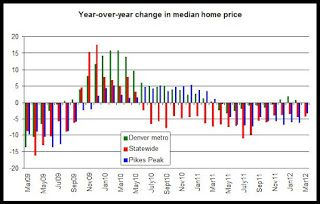
The second graph shows that the year-over-year changes in all three areas have been generally negative each month for the past six months, although Denver metro has shown some growth during that period. Median home price trends in this data show less growth than has been the case in other measures of home prices. The Case-Shiller and Corelogic indices, for example have shown year-over-year increases in prices ranging from 1 percent to 3 percent in recent months. See here for more.
Recent home sales transaction data indicates that demand for home purchasing continues to build. However, this has not yet translated into sustained and significant home price increases. Bargain hunting and demand among the lower price ranges has combined to keep median prices below what was seen during peak levels several years ago.
The home price data provided by the Colorado Association of Realtors is based on home sales transactions that are listed in the MLS systems for each area and do not include for-sale-by-owner transactions or new homes sold directly by home builders.
The first graph shows the median single-family home price for the state and for the metro Denver and Pikes Peak regions. Median home prices fell dramatically in all three measures following the financial crisis of late 2008, but moved back up quickly by mid-2009. Since mid-2009, however, median home prices have been largely flat in metro Denver. In the Pikes Peak region, on the other hand, the median price remains well below peak levels and continues to decline slowly following a new 2010 peak. Statewide, as is typical, the median price has been more volatile, but has not recovered as much as the metro Denver median. Statewide, declining prices in western Colorado are a factor in statewide price declines.
The metro Denver area, where the median price is 14 percent below its August 2007 peak levels, has recovered the most. Metro Denver prices appear to have stabilized since 2009 and the median price generally moves between 220K and 240K. The statewide median price is now 20 percent below its August 2008 peak. The Pikes Peak median price fell in January to 26 percent below its July 05 peak, falling to 180K. The Pikes Peak area's median price ranged between 180K and 195K during 2011.
The second graph shows that the year-over-year changes in all three areas have been generally negative each month for the past six months, although Denver metro has shown some growth during that period. Median home price trends in this data show less growth than has been the case in other measures of home prices. The Case-Shiller and Corelogic indices, for example have shown year-over-year increases in prices ranging from 1 percent to 3 percent in recent months. See here for more.

Recent home sales transaction data indicates that demand for home purchasing continues to build. However, this has not yet translated into sustained and significant home price increases. Bargain hunting and demand among the lower price ranges has combined to keep median prices below what was seen during peak levels several years ago.
The home price data provided by the Colorado Association of Realtors is based on home sales transactions that are listed in the MLS systems for each area and do not include for-sale-by-owner transactions or new homes sold directly by home builders.
March home sales index in metro Denver at 4-year high
The home sales index for March 2012 was at the highest index value for March since 2009. The index, which is just a 3-month moving average for sales totals provided by the Colorado Association of Realtors, was at 2,259 sales during March 2012, which is up 9.6 percent from March 2011 when the index was at 2,059 sales. This article examines single-family homes only.
The first graph shows the 3-month moving average for each month. There is a large seasonality factor in monthly sales totals, but the graph shows that in recent months, home sales totals have been well above what has been seen during the same months of 2009, 2010 and 2011.
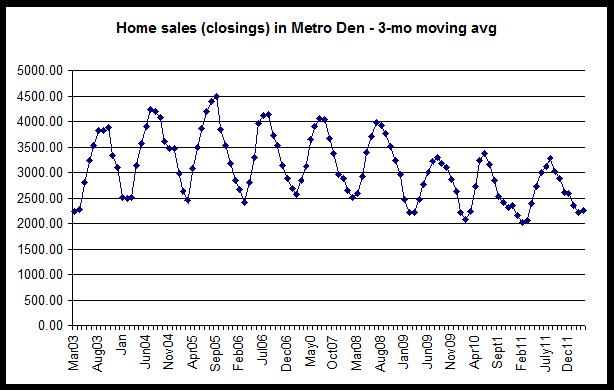
This tells us that home sales activity is up, and it has been up, when compared to the same during the previous year, for the past eight months.
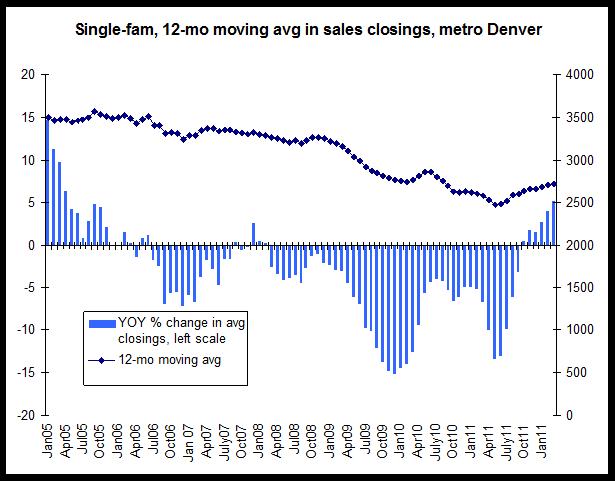
Looking at the broader trend, we also find that home sales activity is up. In the 12-month moving average, which removes the monthly seasonal issues, we see that there have been six months in a row of year-over-year increases. Sales totals are still down significantly from where they were during 2005 and 2006, but they have come up about 9.5 percent from the sales nadir reached during May 2011.
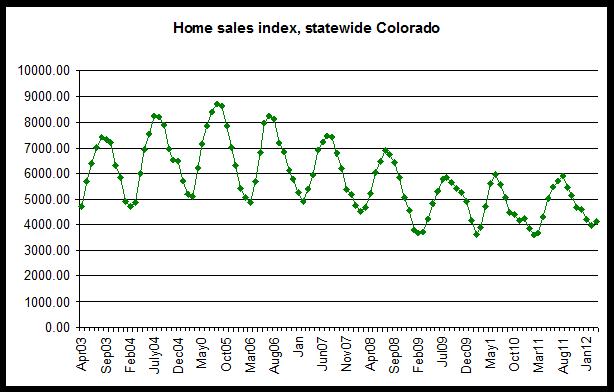
We see a similar trend statewide in home sales, where the home sales index has been up, year over year, for each of the past nine months.
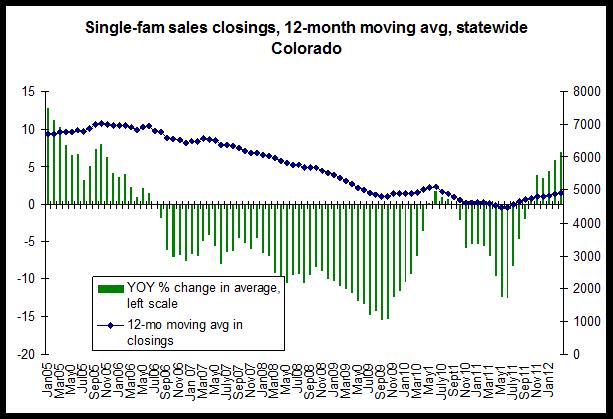
We also see an overall building trend of more sales activity at the statewide level in the 12-month moving average. The 12-month average has been up year over year for the past six months, and reached a growth rate of 6.9 percent during March 2012, which is the largest growth rate since October 2005. We can see that teh 12-month overage overall has been building since June of 2011:
While metro Denver and statewide markets have shown some of the largest increases we've seen in years, Colorado Springs, on the other hand, has shown some signs of moderation in its home sales. The 3-month moving average in sales increased only 1.3 percent, year over year for March, and the 12-month moving average actually declined slightly from February to March 2012. (See graph.)
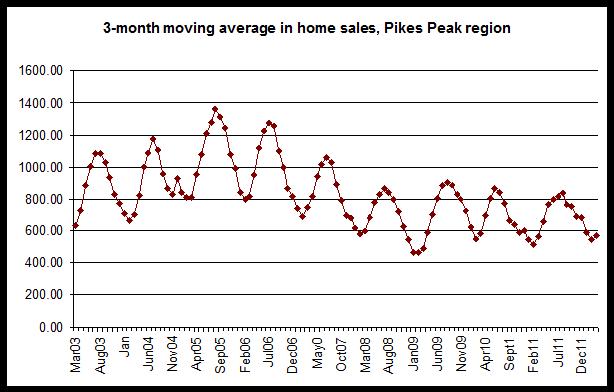
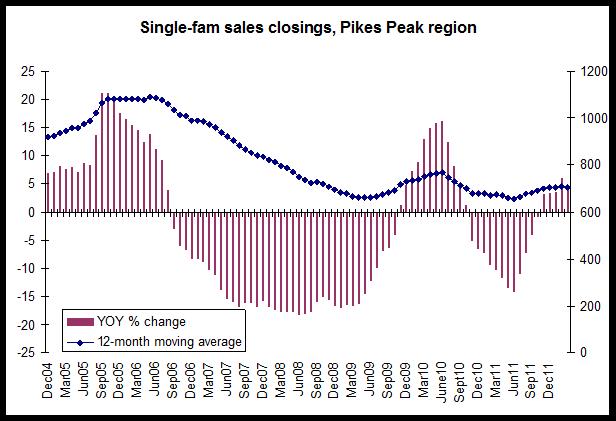
Sales activity continues to pick up in Metro Denver and statewide, and to a lesser extent, it continues to increase in the Pikes Peak area. Growth in demand is definitely weaker in the Pikes Peak area than in metro Denver, however.
Demographics continue to benefit home sellers. Inmigration looks to continue to be relatively strong while new single-family production continues to be 60 to 70 percent below peak levels. Increases in home prices continues to be rather moderate, and suggests that new home construction is not about to boom.
Housing News Digest, June 4
Affordable Windsor housing being built
Back in April, the Windsor Town Board gave the official go-ahead for the eight-year effort to offer additional affordable housing in Windsor, and the application has just been approved.
More than $7 million in tax credits, reserved over the next 10 years, has been approved from the Colorado Housing Finance Authority Tax Credit Allocation Committee. This is the green light that the Windshire Apartments needed in what town board members see as a vital project for the community. John C. Moore, chairman of the Windsor Housing Authority, agrees that this project is a must in the area.
Housing Mismatch: Boomers Sell, Millennials Rent Christopher Habig, 25, and Anne Weingarten, 58, don’t know each other, but they represent two sides of a perplexing new problem that could roil the housing market in years to come. Back in the fall of 2009, Habig, a marketing consultant in Indianapolis, was on the verge of buying a home with savings and mortgage financing after graduating from Butler University. But the deal fell through at the last minute, and Habig says now, “Honestly, I have zero regrets about it.” Though he once viewed home ownership as part of the American dream, the 20-something has had a change of heart. “I view houses and being a homeowner as more of a liability than rental expenses at this point, because I understand now that buying means sinking a lot of money into upkeep and mortgage payments without a guarantee the investment will pay off.”
Eagle River Station now on the hunt for tenants EAGLE, Colorado — One week after voters approved the Eagle River Station proposal, Jeff McMahon, of Trinity/RED Development, said the company's priorities are to finalize plans for a new east Eagle interchange and find tenants interested in setting up shop. “The process of development is a sometimes long and arduous one,” McMahon said. “Last week's vote gives us the chance to try to make this project happen. Now we are going to go out and do what we do best.”
About Town: Windsor seeing activity in economic development Economic activity remains high in the town of Windsor. The town has received 92 attraction prospect requests in the last year. These are companies that are potentially interested in coming to Windsor. There were 25 leads that were classified as non-qualified, meaning we didn’t have the type or size of space they were looking for. We have had 28 attraction prospect leads so far this year, with seven companies actually coming to town to visit, compared to just three all of 2011. There are also two local companies looking to expand currently. Out of the 58 active leads in seven different categories, 53 percent of them are in the manufacturing sector. The town of Windsor has a very diverse breakdown on the industries in the attraction prospect pipeline. Out of 14 different industries, the largest percentage of active prospects is in two sectors, energy at 22 percent and retail at 16 percent.
HARP nearly doubles refinanced mortgages in first quarter The number of refinanced Fannie Mae and Freddie Mac mortgages nearly doubled in the first quarter as the largest banks launched the expanded Home Affordable Refinance Program. Servicers refinanced roughly 180,000 GSE loans in the first three months of 2012, nearly double the 93,000 completed in the fourth quarter, according to Federal Housing Finance Agency data. In March alone, servicers refinanced 80,000 borrowers under the program.
Friday, June 1, 2012
Denver and Douglas counties drive multifamily permits in 2012
Year-to-date through April of 2012, more than half of all new multifamily
permits issued have been issued in Denver and Douglas counties alone.
According to new multifamily permit data for Colorado counties, 2,435 multifamily permits have been issued from January through April of 2012. 1,323 of them, of 54 percent, were issued in Denver and Douglas counties. Adding in El Paso and Boulder counties bring the total to 1,965, or 80 percent, of all multifamily permits through April.
Few other counties issues any multifamily permits at all as of April of this year, although Adams County did issue 220 multifamily permits, which is by far the largest number of new multifamily permits issued by Adams County since 2007. Adams issued 352 permits during 2007, 108 during 2008, 6 during 2009, 27 during 2010 and 0 during 2011.
Total multifamily permits issued, Jan-April 2012
Adams 220
Arapahoe 49
Boulder 327
Broomfield 146
Denver 788
Douglas 535
El Paso 315
Jefferson 8
Larimer 42
Mesa 0
Pueblo 0
Weld 5
With so little demand for new condominiums right now, it is safe to assume that the lopsided majority of new multifamily permits being issued are for rental housing. We see most of this activity in areas where vacancy rates have been tight or look to be tight for the near to mid-term.
With apartment vacancy rates headed below five percent in the metro Denver area, the markets appear to be responding to tight vacancies with plans for future construction. Larimer county has also been a very active county for new multifamily activity over the past 18 months, although 2012 is a moderate year for Larimer county so far.
Change since 2011
Some counties saw very large increases in the number of multifamily permits issued. From January-April of 2011 to the same period this year, in Douglas County, multifamily permits increased more than 5,000% from 10 to 535, while in Adams county they increased from 0 to 220. Boulder County also saw a big increase with a rise in multifamily permits from 0 to 327, year over year through April. Permits also increased in El Paso County and in Broomfield County although they dropped off in Larimer County, dropping from 71 to 42.
There was no multifamily permit activity at all in Pueblo County over the period, and Weld County increased only slightly from 0 to 5.
2011-2012 Consolidated Annual Performance Evaluation Report
HUD requires its Community Planning Development grantees to
submit a Consolidated Annual Performance and Evaluation Report (CAPER)
for each program year. The Department of Local Affairs' most recent
program year that ran from April 1, 2011 through March 31, 2012. This
CAPER reports on DOLA's performance during that period using the
Consolidated Plan Annual Action plan for that time period as
the standard.
Some portions of the report need further updating, and updates will be posted here as they occur.
Your comments on the plan linked below are very much appreciated. Submit your comments to [email protected]
Open the DRAFT 2011-2012 Consolidated Annual Performance and Evaluation Report.
Your comments on the plan linked below are very much appreciated. Submit your comments to [email protected]
Open the DRAFT 2011-2012 Consolidated Annual Performance and Evaluation Report.
Pending home sales up 6.3 percent in US West
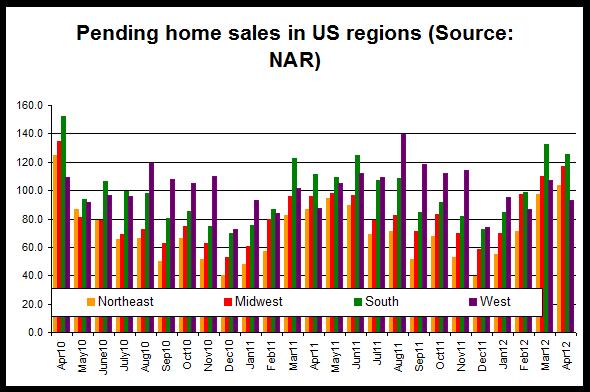
Pending home sales retrenched in April following three consecutive monthly gains, but are notably higher than a year ago, according to the National Association of Realtors®. The Pending Home Sales Index,* a forward-looking indicator based on contract signings, declined 5.5 percent to 95.5 from a downwardly revised 101.1 in March but is 14.4 percent above April 2011 when it was 83.5. The data reflects contracts but not closings.
All regions of the country showed gains in pending home sales, year over year.
In the West, pending home sales increased 6.3 percent from April 2011 to April 2012, and pending sales increased by 14.7 percent nationwide. The West had the smallest year-over-year increase of all regions. Pending home sales increased 22.7 percent in the midwest.
Month to month, the pending home sales index fell 13.2 percent in the West and fell 2.6 percent nationally. The west was the only region to report a month-to-month decline in pending sales although sales activity tends to generally fall from September to October.
Only the northeast and midwest reported month-to-month increases. The West showed the largest decline in the index among all regions.
Overall, the numbers are weaker in the West than in the other regions and in the nation as a whole. Since the West region includes Arizona and Nevada, it is likely that these areas, which continue to face headwinds following the financial crisis, may be dragging on overall regional numbers. Colorado and metro Denver in recent home price data suggests that home price activity is picking up more in Colorado than in many areas of the country.
Colorado still 6th best for non-current loans among states
According to the LPS Mortgage Monitor ,
released today by Lender Processing Serives, 11.3 percent of mortgage
loans during April were "non-current" in the United States. That is,
they were 90-plus-days delinquent or were in foreclosure.
In Colorado, the percentage of active mortgage loans that were non-current during March was 6.2 percent, which was down 9.9 percent from the same period last year. Colorado's year-over-year decline in non-current loans was the 10th largest in the nation. Only Nevada, Michigan, Arizona, California, Idaho, Minnesota, Montana, Utah and Wyoming showed larger declines.
Only five states reported lower percentages of non-current loans than Colorado, making Colorado 6th-best in the nation for the percentage of its mortgage loans that were non-current during April 2012. Montana, Wyoming, South Dakota, Alaska and North Dakota reported lower percentages of non-current loans during February.
The states with the highest rates of non-current loans were Florida, Mississippi and New Jersey with non-current rates of 21.3 percent, 16.8 percent and 15.6 percent, respectively.
According to LPS: LPS Mortgage Monitor is an in-depth report of mortgage industry performance. The monthly report is based on data from the company’s market-leading repository of loan-level residential mortgage data and performance information, including more than 40 million active loans across the credit spectrum. This data is analyzed by LPS experts to produce more than 30 charts and graphs reflecting both trend and point-in-time performance observations.
(The March report includes data up through April.)
Housing News Digest, June 1
The ’70s: Development thrives, solar panels pop up, Arvada Center opens
Jeffco’s scenic beauty was high on the minds of its citizens, who on Nov. 7, 1972, with urging by PLAN Jeffco and the League of Women Voters, voted to create Colorado’s first countywide open-space preservation program. Fueled by a half-percent sales tax, Jeffco Open Space quickly began snapping up crown jewels of Jefferson County: Mount Falcon, Apex Gulch, White Ranch, Reynolds Ranch, Van Bibber Creek, Green Mountain Ranch, Mathews Ranch, Alderfer Ranch, Crown Hill, Welchester and more.
Colorado Awards Housing Credits Eight affordable housing projects have been selected to receive nearly $7 million in low-income housing tax credit (LIHTC) reservations from the Colorado Housing and Finance Authority.
Reading the tea leaves of housing data Mortgage rates are hitting new historic lows, but, contrary to conventional wisdom, pending home sales and mortgage applications have declined. At the same time, home prices are rising. And that's just this month. With so much fluctuating data, how can home buyers possibly figure out whether it's the right time to buy or sell?
Jobs Report Signals More Trouble for Housing The weaker-than expected jobs report for May doesn’t bode well for the overall economy, but for housing it is far more foreboding. From construction, to local economies, even to age segments, the numbers are going in the wrong direction.
3 Reasons the Luxury Housing Market Is Sizzling But that's just what's happening in some of the nation's most competitive and sought-after housing markets. Sales of super high-end properties are booming, experts say, with the tight supply of desirable properties spurring multiple offers and bidding up sale prices.
Subscribe to:
Posts (Atom)