Corelogic released today its April 2012 report on completed foreclosures and foreclosure inventory. According to the report, the foreclosure inventory in the US was 3.4 percent of mortgages during April 2012, which was down 0.1 percent from April 2011.
In Colorado, the foreclosure inventory was 1.4 percent of all mortgages, making Colorado tied for the 4th-lowest foreclosure inventory rate in the nation. Only North Dakota,Wyoming and Nebraska had foreclosure invetory rates that were lower. Colorado was tied at 1.4 percent with Missouri, Virginia, Montana, and South Dakota.
Florida had the highest foreclosure inventory rate in the nation at 12.0 percent during April.
Corelogic listed the number of completed foreclosures in Colorado over the past 12 months at 19,488 which compares fairly closely with annual totals collected by the Colorado Division of Housing. There were 19,622 completed foreclosures during the 12 months of 2011.
The
Denver area was again lowest among all metros in its foreclosure
inventory during April. 1.4 percent of all loans with mortgages were in foreclosure
in the Denver area. In Chicago, the rate was 6.3 percent.
Thursday, May 31, 2012
Denver metro unemployment rate moves above nat'l average
The BLS released its report today on April unemployment in 372 metro areas in the US. The data for Colorado is not
different from the statewide report already released by the Colorado
Department of Labor and Employment. The chart with local unemployment
rates is here.
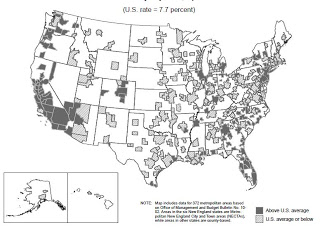
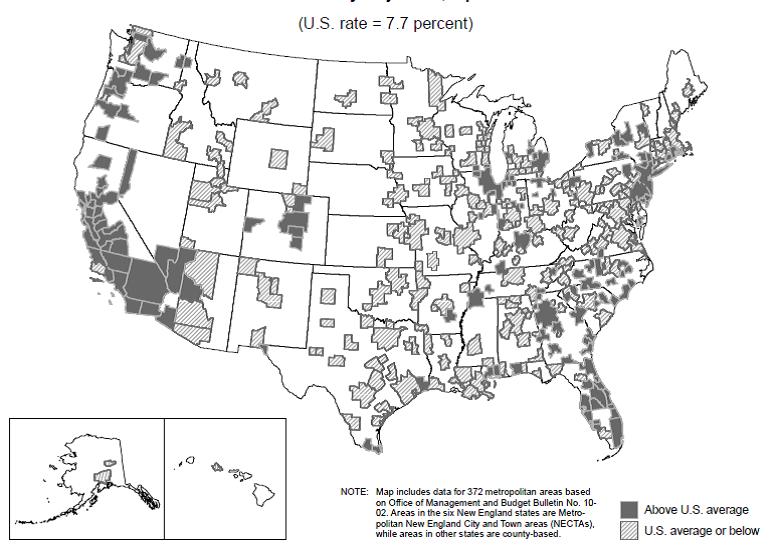
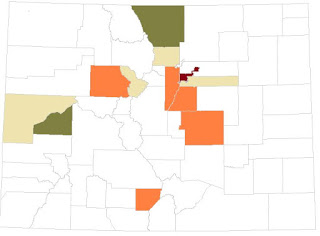
Nevertheless, the report does provide some comparisons with other metro areas in the nation. The map on the last page of the report shows that among the metro areas in Colorado, Denver metro, Pueblo, Colorado Springs, Grand Junction and Greeley have unemployment rates (not seasonally adjusted) above the national rate of 7.7 percent (not seasonally adjusted). During April 2012, Denver Boulder and the Ft. Collins-Loveland area had unemployment rates below the national rate, but Denver metro, has moved above the national unemployment again after several months below the national rate.
The map shows how most metro areas are now above the national unemployment rate.
The map:
Statewide, Colorado's unemployment rate (seasonally adjusted) remains below the national rate, and has been below the national rate since 2005.
The Boulder and Fort Collins areas have posted better unemployment rates than the nation for quite some time. Denver has in the past several months dropped below the national rate.
National comparisons remain important insofar as perceptions of the local job market drive household creation in Colorado. As long as Colorado is perceived as being a better job market than many metro areas in the nation, such a perceptions will foster household creation and population growth in the state. In recent months, however, the gap between the Colorado and the national unemployment rate has narrowed with unemployment declining faster at the national level than in Colorado.
According to today's BLS report:
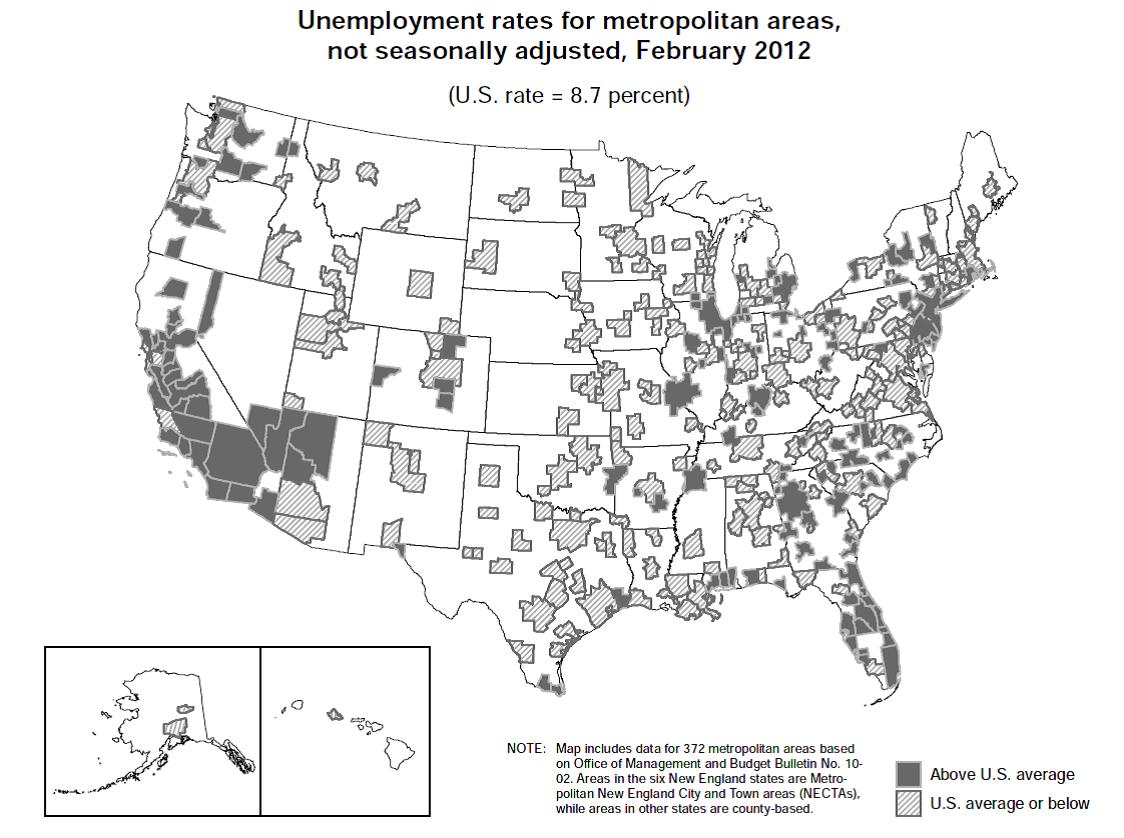
Unemployment rates were lower in April than a year earlier in 342 of the 372 metropolitan areas, higher in 25 areas, and unchanged in 5 areas, the U.S. Bureau of Labor Statistics reported today. Ten areas recorded jobless rates of at least 15.0 percent, while 32 areas registered rates of less than 5.0 percent. Two hundred forty-six metropolitan areas reported over-the-year increases in nonfarm payroll employment, 115 reported decreases, and 11 had no change. The national unemployment rate in April was 7.7 percent, not seasonally adjusted, down from 8.7 percent a year earlier.
Housing News Digest, May 31
Urban Land Conservancy sells TOD site
The Urban Land Conservancy today announced the sale of property at the Evans Light Rail Station along Denver’s Southwest light rail corridor for the construction of a much-anticipated, mixed-use, transit-oriented development that will include 50 workforce housing apartments.
ULC originally purchased the one-acre property at 2140 S. Delaware St. in June 2011 using Denver’s Transit-Oriented Development Fund. The $15 million TOD Fund was created in April 2010 to preserve land near transit stations for the creation of affordable housing. Housing and transportation often make up 60 percent of low-income household expenses. This new development, close to a light rail station, will provide residents with easy access to transportation, jobs, education and other services.
Home building soars in Denver area Home building in the Denver area rose by 43.4 percent in the first four months of the year, compared to the same period in 2011, according to a report released today. An increase in building permits for single-family, detached homes is a trend for more than a year, said Jeff Whiton, President and CEO of the Home Builders Association of Metro Denver, which released the building permit report.
Aurora Gaylord project to be reevaluated after Marriott deal "The company will no longer view large-scale development as a means of growth and will not proceed with the Colorado project in the form previously anticipated. "The company will reexamine how the project should could be completed with minimal financial commitment by Gaylord during the development phase."
Alpine Property Announces Bulk Sale of Mountain Sage Townhomes Development Alpine Property announces a unique property listing in Carbondale, Colorado. The real estate listing is a bulk sale, and comprises eight recently constructed townhomes, of which seven townhomes are finished and one is partially complete. The townhomes are a mixture of 2 and 3 bedroom units, with three 2-bedroom units and five 3-bedroom units. Located on Main Street, the eight townhomes are part of the Mountain Sage Townhomes Development in downtown Carbondale.
Taxpayers may wait 15 years for GSE payback: Moody's Taxpayers will likely wait 15 years until Fannie Mae and Freddie Mac repay their bailouts in full, according to the more optimistic forecast from Moody's Analytics. Fannie turned its first profit in the first quarter since entering conservatorship in 2008. Freddie Mac has been operating at or near break-even for roughly six months. The improved performance prompted some to explore when the money will be paid back. Along with Freddie, the government-sponsored enterprises drew $189.5 billion from the Treasury Department as of March 31 and paid $41.1 billion in dividends.
Wednesday, May 30, 2012
Important Information for all HOME CHDOs
Important Information for all HOME CHDOs (Community Housing
Development Organizations):
The Colorado Division of Housing has changed its annual cycle for receiving
applications for HOME CHDO operating funds from October 1st to September
4th. This will be the only time for applications to be submitted until
the next annual cycle on September 1, 2013.
All CHDOs planning to apply for operating funds must be re-certified by the
Housing Development Specialist for your region (see map at http://www.colorado.gov/cs/Satellite?c=Page&childpagename=DOLA-Main%2FCBONLayout&cid=1251595082735&pagename=CBONWrapper#region1)
prior to submitting your application on September 4th. The deadline for
submission of all certification documents is August 1st.
In order to provide you with important CHDO eligibility information, the
Division of Housing is offering a one hour Webinar on July 12th at 10:00 a.m.
More specific information on how to sign up for the Webinar will be emailed to
you in June.
All questions regarding certification and applications should be directed
to your Housing Development Specialist.
Upcoming Private Activity Bond workshops
Private Activity Bond
Workshop
This workshop is for local
officials, developers & others who want to learn how to best utilize Private
Activity Bond (PAB) financing to benefit their communities, especially given all
the recent changes in our economy and the bond market.
The State of Colorado has
over $486 million of PAB tax-exempt bonding authority annually. Make sure that your community is taking full
advantage of this valuable resource to provide rental housing, homeownership and
industrial development opportunities.
Leave knowing where to get it, what to use it for and how to use
it!
Click here for the brochure.
Housing News Digest, May 30
Mountain Real Estate Capital & Oakwood Homes Acquire Banning Lewis Ranch in Colorado
COLORADO SPRINGS, Colo., May 30, 2012 (BUSINESS WIRE) -- Mountain Real Estate Capital (MREC) announces the closing of a new investment with Oakwood Homes of Denver to acquire and build out Banning Lewis Ranch, a 2,600-acre, 8,500-approved-lot master-planned community located in Colorado Springs, Colo. The transaction represents MREC's second investment in Colorado and first with Oakwood. The terms of the transaction were not disclosed.
The Housing Recovery: A Rethink I predicted since the Summer of 2011 that a housing recovery was building and that it would “kick” around April of 2012. That prediction was based on the assumption that collapsing vacancies and rising rents would fuel a boom in multi-family housing construction. To date, multi-family has experienced a strong turn-around but is well short of the boom I had been calling for.
City law freezes foreclosures in Washington, D.C. The Washington, D.C., foreclosure system remains frozen 18 months after the city council passed a law that made it possible to void a future filing. In November 2010, the D.C. city council passed an emergency ordinance forcing lenders to provide mediation to borrowers in danger of foreclosure. The meeting must take place within 45 days of the notice of default, and mortgage servicers must navigate a slew of other requirements.
Expiring Mortgage Debt Relief Act Fuels Strategic Default: Survey YouWalkAway.com conducted a national survey and found 34 percent of respondents indicated that the act, which is set to expire December 31, 2012, contributed to their decision to walk away sooner rather than later from their property. Those surveyed were YouWalkAway.com clients who were actively considering or navigating through the foreclosure process.
Colorado AG requests foreclosure lawyers' documents from 4 counties Mortgage fraud investigators with the Colorado Attorney General's office have gathered documents filed with at least four county public trustees' offices by some of the state's largest foreclosure law firms, according to several people familiar with the request. Trustees in four counties confirmed they each provided hundreds of pages of documents — mostly bid and cure statements associated with foreclosures spanning a five-year period — in response to a request by the attorney general's consumer protection division.
Tuesday, May 29, 2012
22% of foreclosure inventory went to final sale during the first quarter
According to the mortgage bankers association, there were 19,434 loans in the foreclosure process as of the end of the fourth quarter of 2011. During the first quarter of 2012, 4,221 of those, or 22 percent, loans proceeded to final foreclosure sale at auction.
At 22 percent, the amount of the foreclosure inventory that procceded to auction sale is fairly typical for trends seen over the past three years.
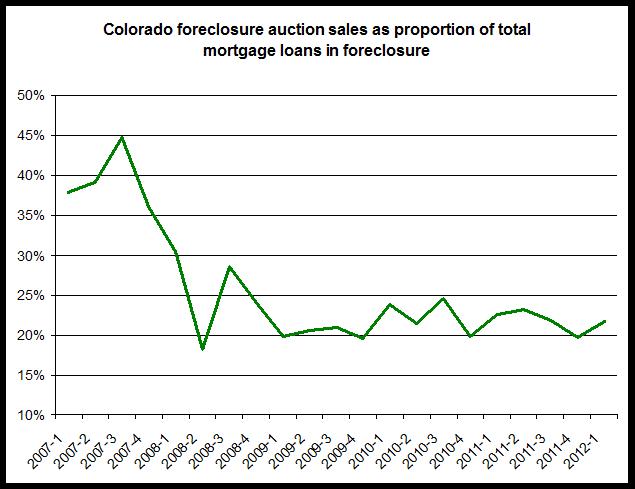
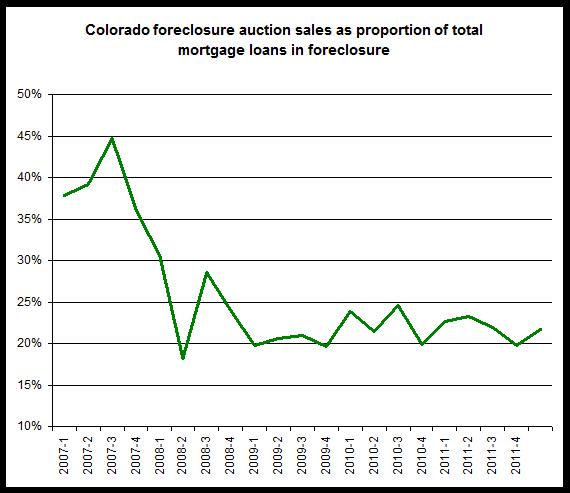
The first graph shows the proportion of the foreclosure inventory that proceeded to auction sale during the following quarter. So, 22 percent represents the percentage of 2012's fourth-quarter foreclosure inventory that proceeded to sale during the first quarter.
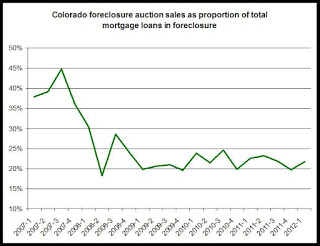 This percentage has generally ranged between 20 percent and 24 percent over the past three years, and this suggests that during recent quarters, almost 80 percent of loans in foreclosure during a given quarter are either still moving through the process or are avoiding foreclosure through short-sale, loan modification or some other action that prevents final foreclosure.
We can see in the graph that this percentage declined substantially after 2007 and 2008. Before 2008, as much as 40-45 percent of the foreclosure inventory was proceeding to sale during a single quarter. Since then, the pace of processing foreclosures has clearly slowed. This trend likely reflects the rise of foreclosures as a national issue which forced many servicers to revise their methods.
During the first quarter of 2012, there were 18,859 loans in the foreclosure process in Colorado. The number of loans in the foreclosure inventory has decreased every quarter since the fourth quarter of 2010. (See the second graph.)
Total loans serviced in Colorado
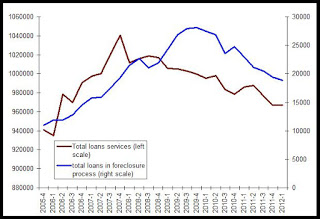
Meanwhile, the number of loans serviced in Colorado increased 0.02 percent during the first quarter of 2012, rising to 967,156 loans (according to the Mortgage Bankers Association's sample.) As can be seen in the second graph, the total number of loans serviced in Colorado has declined significantly since late 2007. Total loans peaked during the third quarter of 2007 and has usually declined each quarter since. The foreclosure inventory grew until the second quarter of 2009 but then began to trend with total loans.
At 22 percent, the amount of the foreclosure inventory that procceded to auction sale is fairly typical for trends seen over the past three years.
The first graph shows the proportion of the foreclosure inventory that proceeded to auction sale during the following quarter. So, 22 percent represents the percentage of 2012's fourth-quarter foreclosure inventory that proceeded to sale during the first quarter.
We can see in the graph that this percentage declined substantially after 2007 and 2008. Before 2008, as much as 40-45 percent of the foreclosure inventory was proceeding to sale during a single quarter. Since then, the pace of processing foreclosures has clearly slowed. This trend likely reflects the rise of foreclosures as a national issue which forced many servicers to revise their methods.
During the first quarter of 2012, there were 18,859 loans in the foreclosure process in Colorado. The number of loans in the foreclosure inventory has decreased every quarter since the fourth quarter of 2010. (See the second graph.)
Total loans serviced in Colorado
Meanwhile, the number of loans serviced in Colorado increased 0.02 percent during the first quarter of 2012, rising to 967,156 loans (according to the Mortgage Bankers Association's sample.) As can be seen in the second graph, the total number of loans serviced in Colorado has declined significantly since late 2007. Total loans peaked during the third quarter of 2007 and has usually declined each quarter since. The foreclosure inventory grew until the second quarter of 2009 but then began to trend with total loans.
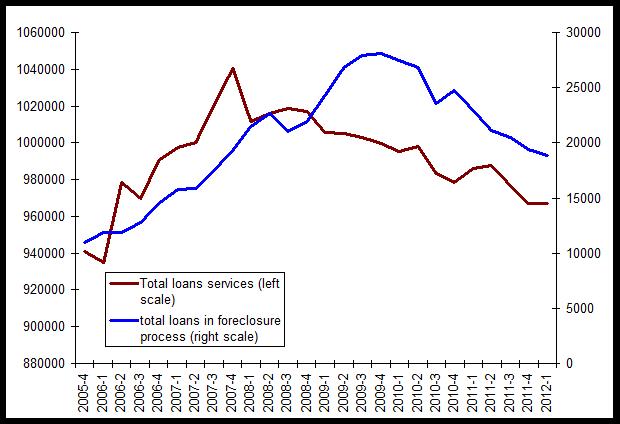
The foreclosure inventory is expected to continue to decline as total loans serviced declines. With fewer loans to foreclosure, this also suggests that it is unlikely that foreclosure activity will return to 2007-2009 levels unless the employment situation experiences severe shocks that significantly push down total employment.
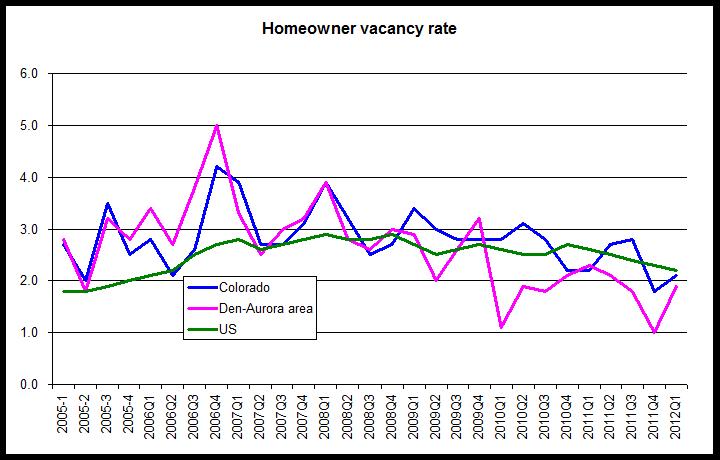
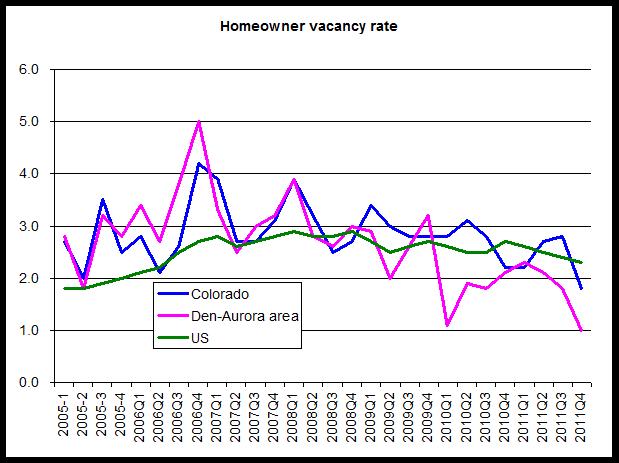
Census: For-sale vacancies fall during first quarter
According to the Housing Vacancy Survey for the first quarter of 2011,
released on last month by the Census Bureau, the vacancy rate in
for-sale housing in Colorado fell year over year to 2.1 percent from
2011's first-quarter rate of 2.2 percent. The vacancy rate in for-sale
housing in the Denver-Aurora area also fell yeear over year, dropping to
1.9 percent from 2011's first quarter rate of 2.3 percent.
Nationanlly, the vacancy rate was slightly higher, and was 2.2 percent during the first quarter of 2012. That's down from 2011's first quarter rate of 2.6 percent.
The vacancy rate in for-sale residences is difficult to measure and is based on information collected from homeowners. If the homeowners report that the unit has been recently vacant or will be vacant in the near future, the unit will be counted as vacancy if other conditions are met as well. The units included must not be rental units.
The graph shows that vacancies in for-sale units have been declining since 2007 nationally, and in Colorado and the Denver-Aurora area. The Denver-Aurora vacancy rate during the first quarter was at the lowest rate measured during the first quarter in more than seven years.
Recent data on home sales suggests that demand for homes continues to build in the Denver area, and also in Colorado overall. Recent increases in demand for for-sale properties may also be reducing turnover time in these properties, and may be contributing to faster turnover in foreclosures properties. This would in turn drive down the vacancy rate in owner-occupant properties.
As the HVS Q and A page notes, many foreclosing properties may not show up as vacant "for sale" properties.
The Denver-Aurora vacancy rate has been below the national rate since 2010, and this falling vacancy rate in the Denver area relative to the the nationwide vacancy rate may reflect declining foreclosure totals in Colorado as well as ongoing demand due to relatively strong household formation.
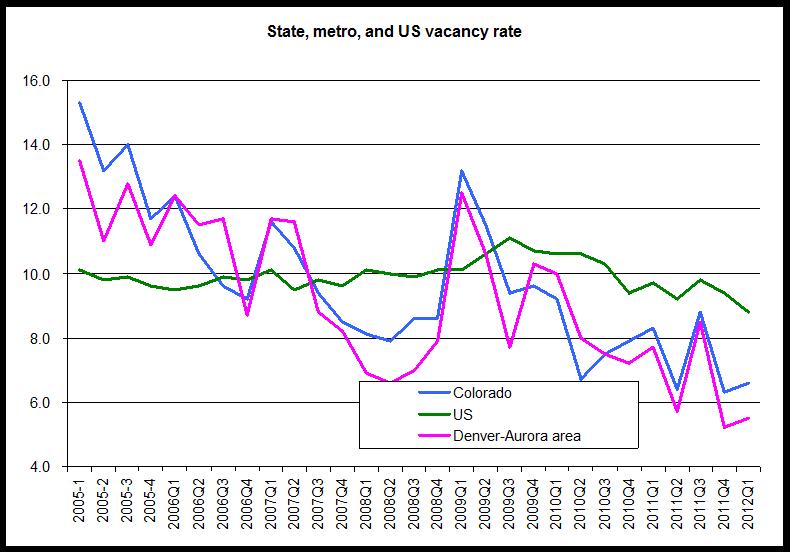
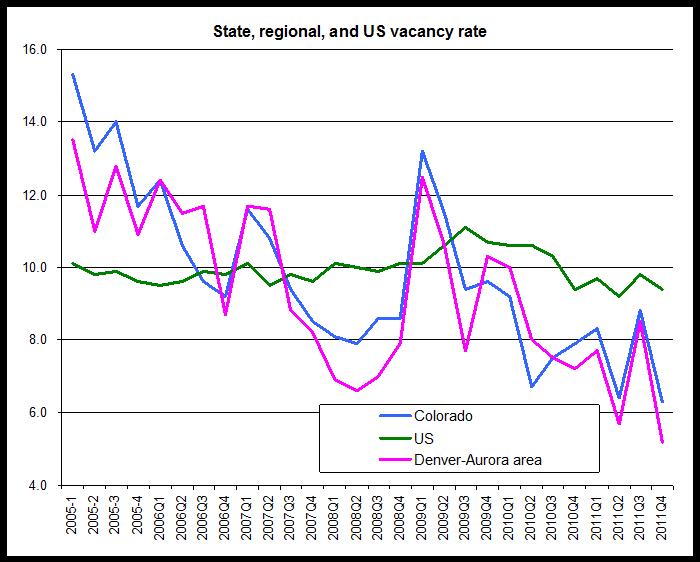
Census bureau: Colorado and Denver rental vacancy rates fall
According to the Census Bureau, the vacancy rate in rental housing in
Colorado fell year over year during the first quarter of 2012 to 6.6 percent. In the
Denver-Aurora area, the vacancy rate during the first quarter also fell year over year to 5.5 percent. In both cases, the vacancy rates are at the lowest rates
recorded during the first quarter in more than seven years.
Nationwide, the rental vacancy rate was 8.8 percent during the first quarter of 2012.
In Colorado, the vacancy rate was 11.7 percent during the fourth quarter of 2005 and had declined to 8.6 percent during the fourth quarter of 2008 before rising again in the wake of the financial crisis. As the demand for rental housing increased, the vacancy rate fell to 6.3 percent by the end of 2011, but inched up during the first quarter.
In the Denver-Aurora area, vacancy rates have tended to be somewhat lower with the vacancy rate at 10.9 percent during the fourth quarter of 2005, falling to 7.9 percent during the fourth quarter of 2008. The rate then fell to 5.2 percent by the end of 2011 and ticked up slightly to 5.5 percent during the first quarter of this year.
In both the Denver-Aurora area and statewide, vacancy rates have fallen steadily since 2009.
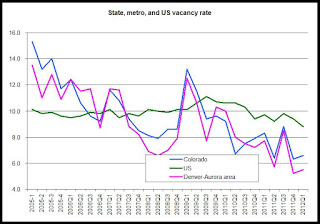
Nationwide, the vacancy rate has been far less volatile. Over the past seven yeas, the national vacancy rate has rarely exceeded ten percent, and since 2009, the vacancy rate has only fallen about one percentage point to 9.4 percent.During the first quarter of 2012, the national rental vacancy rate fell to the lowest level reported in any quarter since the fourth quarter of 2001, when the vacancy rate was 8.8 percent.
As Colorado's vacancy rate moved further below the national rate, the most recent data further suggests that rental housing in Colorado and the Denver area is experiencing greater demand than is the case nationwide. This is likely due to strong population growth and household formation in Colorado relative to many states and metro areas.
These vacancy rates are part of the Census Bureau's Housing Vacancy Survey (HVS). The method for data collection varies significantly form the method used for the collection of the Division of Housing's vacancy and rent surveys.
The Division of Housing's report is based on quarterly surveys that measure the vacancy of all surveyed units in specific dates for each quarter. Units are either vacant on the day in question, or they are not. By contrast, vacancies in the HVS are measured according to occupancy of a unit over a much broader time period, and are subject to some interpretation on the part of the person conducting the survey.
Overall, however, the two surveys for Colorado and the metro Denver area show the same general trends over the past seven years.
Nationwide, the rental vacancy rate was 8.8 percent during the first quarter of 2012.
In Colorado, the vacancy rate was 11.7 percent during the fourth quarter of 2005 and had declined to 8.6 percent during the fourth quarter of 2008 before rising again in the wake of the financial crisis. As the demand for rental housing increased, the vacancy rate fell to 6.3 percent by the end of 2011, but inched up during the first quarter.
In the Denver-Aurora area, vacancy rates have tended to be somewhat lower with the vacancy rate at 10.9 percent during the fourth quarter of 2005, falling to 7.9 percent during the fourth quarter of 2008. The rate then fell to 5.2 percent by the end of 2011 and ticked up slightly to 5.5 percent during the first quarter of this year.
In both the Denver-Aurora area and statewide, vacancy rates have fallen steadily since 2009.
Nationwide, the vacancy rate has been far less volatile. Over the past seven yeas, the national vacancy rate has rarely exceeded ten percent, and since 2009, the vacancy rate has only fallen about one percentage point to 9.4 percent.During the first quarter of 2012, the national rental vacancy rate fell to the lowest level reported in any quarter since the fourth quarter of 2001, when the vacancy rate was 8.8 percent.
As Colorado's vacancy rate moved further below the national rate, the most recent data further suggests that rental housing in Colorado and the Denver area is experiencing greater demand than is the case nationwide. This is likely due to strong population growth and household formation in Colorado relative to many states and metro areas.
These vacancy rates are part of the Census Bureau's Housing Vacancy Survey (HVS). The method for data collection varies significantly form the method used for the collection of the Division of Housing's vacancy and rent surveys.
The Division of Housing's report is based on quarterly surveys that measure the vacancy of all surveyed units in specific dates for each quarter. Units are either vacant on the day in question, or they are not. By contrast, vacancies in the HVS are measured according to occupancy of a unit over a much broader time period, and are subject to some interpretation on the part of the person conducting the survey.
Overall, however, the two surveys for Colorado and the metro Denver area show the same general trends over the past seven years.
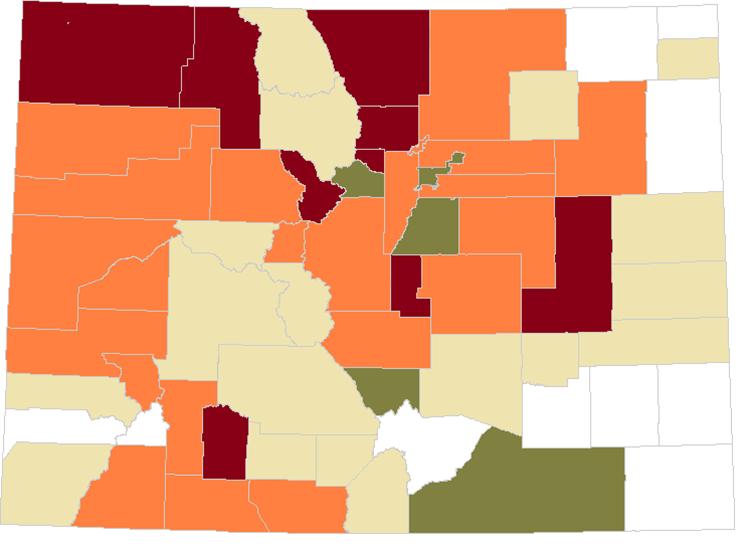
Single-family activity fell in most Colorado counties from 2010 to 2011
Although early estimates showed an increase of 2.6 percent in single-family permitting acmtivity from 2010 to 2011 in Colorado, more recent county-by-county data released by the Census Bureau shows a decline of 3.9 percent in single-family permits over that time. Indeed, only 14 of Colorado's 64 counties reported increases in the number of single-family permits issued from 2010 to 2011. For all counties combined, the total number of single-family permits fell from 8,790 during 2010 to 8,442 during 2011.
The first map shows the counties with growing single-family permit activity in burgundy and green. The counties in orange and tan show counties that had fewer single-family permits in 2011 than in 2010. White counties showed no change over the time period.
Budgundy: increase of more than 25%
Green: increase between 1% and 25%
Orange: Decrease between 1% and 25%
Tan: Decrease of mroe than 25%
White: no change

The counties that reported increases in single-family permits:
Moffatt, +42%
Routt, +48
Summit, +26%
Gilpin, +300%
Boulder, +41%
Larimer, +47%
Denver, +11
Douglas, +17
Teller,+30%
Lincoln, +300
Mineral, +80
Custe, 11%
Las Animas, +10%
All other counties reported decreases or no change.
Statewide, only a handful of counties drove overall totals in permits from 2010 to 2011. Although some small counites, such as Gilpin and Lincoln, experienced a tripling in single-family permitting, these numbers were very small. In Gilpin county, for example, permits increased from 4 to 16.
What drove most statewide activity in single-family activity was the new permit activity in the larger metro counties such as Boulder, Larimer, Denver and Douglas counties.
The number of single-family permits in these four counties combined increased by 25 percent.
Even fewer counties reported increases when compared to 2008, that most recent year to reflect peak permitting levels.
Compared to 2008, only 10 counties showed increases in single-family activity. All other counties reported fewer single-family permits issued in 2011 than in 2008. In many cases, the decline in single-family permit activity declined by 50 percent or more from 2008 to 2011.
The ten counties that reported increases from 2008 to 2011 were:
Boulder, +27%
Broomfield, +20%
Clear Creek, +6.6%
Custer, +24%
Douglas, +3.9%
El Paso, +0.5%
Jefferson, +17%
Larimer, +8.1%
Logan, +18%
These counties have now either surpassed, or on their way to surpassing, peak levels in permit activity experienced during the last expansion. Many other counties are still well below peak levels.
The ten counties that are still fathest below 2008 levels are:
Garfield, -88%
Grand, -90%
Jackson, -83%
Moffat, -75%
Montrose, -67%
Morgan, -72%
Pueblo, -67%
Rio Blanco, -71%
Routt, -76%
San Juan, -85%
With the exception of Morgan and Pueblo counties, the counties that are farthest below 2008 levels are found in the mountains and on the Western Slope.
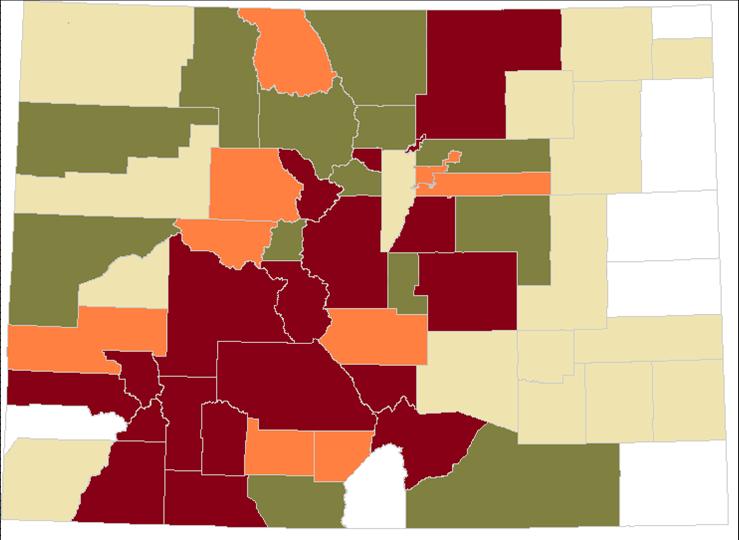
Single-family permitting rates
As might be expected, the most populous counties tend to supply most of the new single-family permit activity. Adams, Arapahoe, Denver, El Paso, Larimer, Jefferson, and Weld counties alone accounted for 61 percent of all single-family permit activity during 2010 and 2011.
If we adjust the number of new permits to the existing number of occupied households in each county, we get a better idea of which counties are adding the most single-family units compared to the existing housing stock.
The second map shows single-family permit activity adjusted for the existing size of the housing stock. We find that the counties that, given their size, many of the counties in central and sourthwestern Colorado issued a sizable numbe rof single-family permits. Along the front range, the most active counties were Weld, Broomfield, Douglas and El Paso Counties.
The map is broken into quartiles:
Burgundy: Top quartile
Green: Second quartile
Orange: Third Quartile
Tan: Bottom quartile
White: No permits
Among the most populous counties, Jefferson, Pueblo and Mesa counties reported small amounts of single-family permit activity, adjusted for the existing housing stock.

Conclusions: Taking into account overall permitting activity as well as recent growth rates in single-family permits, we can conclude that El Paso, Douglas, Denver and Larimer counties are among the most active counties in single-family permitting activity as of the end of 2011. Other counties that have shown relatively high rates of activity include Adams, Boulder and Weld counties.
The first map shows the counties with growing single-family permit activity in burgundy and green. The counties in orange and tan show counties that had fewer single-family permits in 2011 than in 2010. White counties showed no change over the time period.
Budgundy: increase of more than 25%
Green: increase between 1% and 25%
Orange: Decrease between 1% and 25%
Tan: Decrease of mroe than 25%
White: no change
The counties that reported increases in single-family permits:
Moffatt, +42%
Routt, +48
Summit, +26%
Gilpin, +300%
Boulder, +41%
Larimer, +47%
Denver, +11
Douglas, +17
Teller,+30%
Lincoln, +300
Mineral, +80
Custe, 11%
Las Animas, +10%
All other counties reported decreases or no change.
Statewide, only a handful of counties drove overall totals in permits from 2010 to 2011. Although some small counites, such as Gilpin and Lincoln, experienced a tripling in single-family permitting, these numbers were very small. In Gilpin county, for example, permits increased from 4 to 16.
What drove most statewide activity in single-family activity was the new permit activity in the larger metro counties such as Boulder, Larimer, Denver and Douglas counties.
The number of single-family permits in these four counties combined increased by 25 percent.
Even fewer counties reported increases when compared to 2008, that most recent year to reflect peak permitting levels.
Compared to 2008, only 10 counties showed increases in single-family activity. All other counties reported fewer single-family permits issued in 2011 than in 2008. In many cases, the decline in single-family permit activity declined by 50 percent or more from 2008 to 2011.
The ten counties that reported increases from 2008 to 2011 were:
Boulder, +27%
Broomfield, +20%
Clear Creek, +6.6%
Custer, +24%
Douglas, +3.9%
El Paso, +0.5%
Jefferson, +17%
Larimer, +8.1%
Logan, +18%
These counties have now either surpassed, or on their way to surpassing, peak levels in permit activity experienced during the last expansion. Many other counties are still well below peak levels.
The ten counties that are still fathest below 2008 levels are:
Garfield, -88%
Grand, -90%
Jackson, -83%
Moffat, -75%
Montrose, -67%
Morgan, -72%
Pueblo, -67%
Rio Blanco, -71%
Routt, -76%
San Juan, -85%
With the exception of Morgan and Pueblo counties, the counties that are farthest below 2008 levels are found in the mountains and on the Western Slope.
Single-family permitting rates
As might be expected, the most populous counties tend to supply most of the new single-family permit activity. Adams, Arapahoe, Denver, El Paso, Larimer, Jefferson, and Weld counties alone accounted for 61 percent of all single-family permit activity during 2010 and 2011.
If we adjust the number of new permits to the existing number of occupied households in each county, we get a better idea of which counties are adding the most single-family units compared to the existing housing stock.
The second map shows single-family permit activity adjusted for the existing size of the housing stock. We find that the counties that, given their size, many of the counties in central and sourthwestern Colorado issued a sizable numbe rof single-family permits. Along the front range, the most active counties were Weld, Broomfield, Douglas and El Paso Counties.
The map is broken into quartiles:
Burgundy: Top quartile
Green: Second quartile
Orange: Third Quartile
Tan: Bottom quartile
White: No permits
Among the most populous counties, Jefferson, Pueblo and Mesa counties reported small amounts of single-family permit activity, adjusted for the existing housing stock.
Conclusions: Taking into account overall permitting activity as well as recent growth rates in single-family permits, we can conclude that El Paso, Douglas, Denver and Larimer counties are among the most active counties in single-family permitting activity as of the end of 2011. Other counties that have shown relatively high rates of activity include Adams, Boulder and Weld counties.
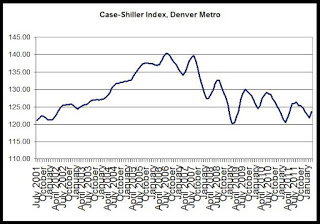
Denver home prices grow more than in most US cities in latest Case-Shiller report
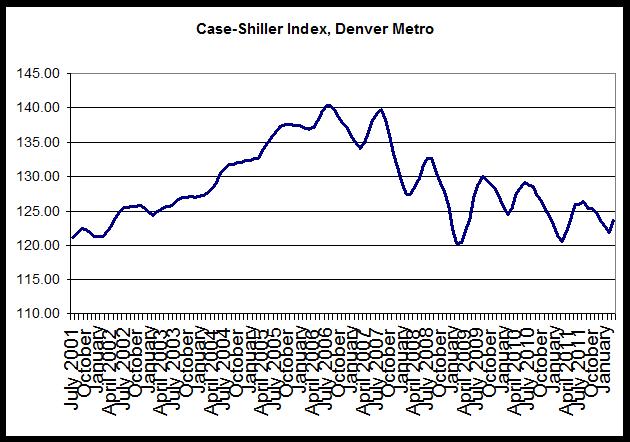
Case-Shiller released its home price index for March 2012
today. The home price index for the Denver area rose 1.5 percent
percent from February to March, and rose 2.6 percent, year over year,
from March 2011 to March 2012. The year-over-year increase in March was the third year-over-year increase in a row for Denver, and
was the largest increase in 22 months . The first graph shows
the index values since 2001:
According to S&P's press release, home prices are still facing headwinds:
In year-over-year comparisons for March, Atlanta showed the largest drop, with a decline of 17.7 percent, while the index in Las Vegas fell 7.5 percent. Year over year, home price indices fell in 13 of the 20 cities included in the study.Denver was among the seven cities reporting increases, and had the third-largest increase of the twenty cities. Only Phoenix and Minneapolis reported larger year-over-year increases in the home price index than Denver.
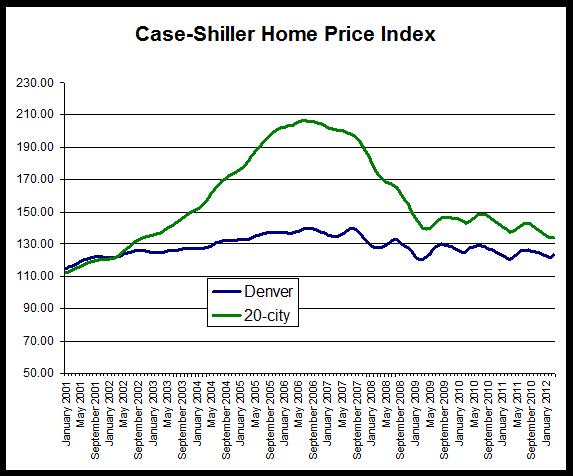
The second chart shows trends in the Case-Shiller index for the Denver area and for the 20-city composite index. It is clear that Denver did not experience the kind of price bubble that occurred in many other metropolitan areas, and consequently, the index has not fallen nearly as far in Denver compared to the larger composite.
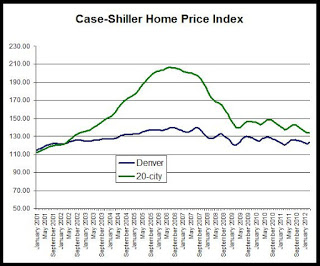
The 20-city composite is down 35 percent since it peaked in July 2006, but the Denver index is down only 11.8 percent from its August 2006 peak.
Although the Denver index showed some significant growth in March compared to March of last year, the Denver index during February was at levels comparable to those found during 2002.
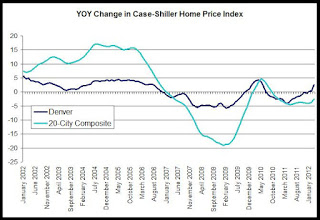
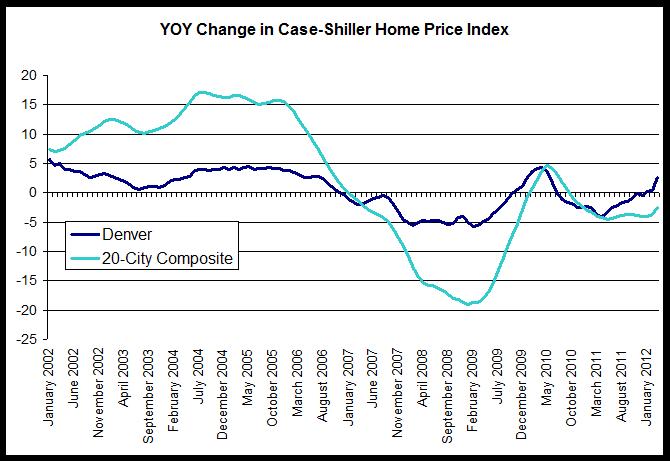
The third chart compares year-over-year changes in the Denver area index and in the 20-city composite. The Denver index did not achieve the rates of growth experienced by the national index, but the Denver index did not experience comparable rates of decline following the onset of the national recession either. Overall, the index has been less volatile in Denver than has been the case for the 20-city composite, and the rates of decline in Denver have been smaller in recent months. The year-over-year change in the 20-city composite during March was negative with a decrease of 2.6 percent while Denver reported an increase of 2.6 percent, and also increased for the thirdmonth in a row. In the 20-city index, the year-over-year change has been negative for the past 18 months.
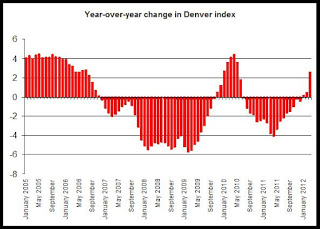
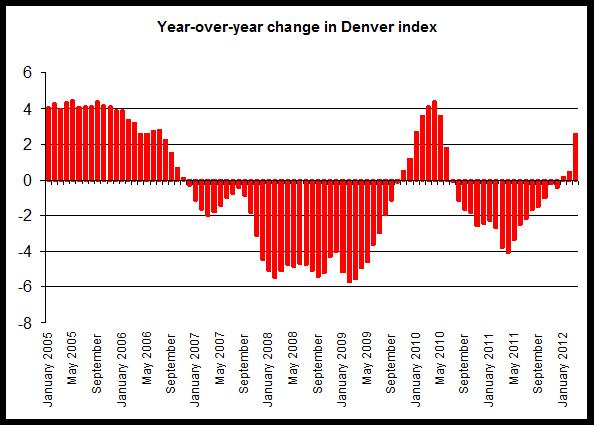
The last chart provides a closer look at year-over-year changes in the Denver index. Note that the change was below zero between June 2010 and December 2011, and likely reflects the end of the homebuyer tax credit’s end which has led to a fall in demand and a decline in the home price index. The upward trend in the index in response to the tax credit is clear during late 2009 and early 2010. Home prices showed increases in Denver compared to 2011 during the first quarter of 2012, and March's relatively large increase of 2.6 percent suggests continued strength in the demand for home purchases, at least in the short term .
According to S&P's press release, home prices are still facing headwinds:
“While there has been improvement in some regions, housing prices have not turned,” says David M. Blitzer, Chairman of the Index Committee at S&P Indices. “This month’s report saw all three composites and five cities hit new lows. However, with last month’s report nine cities hit new lows. Further, about half as many cities, seven, experienced falling prices this month compared to 16 last time.
In year-over-year comparisons for March, Atlanta showed the largest drop, with a decline of 17.7 percent, while the index in Las Vegas fell 7.5 percent. Year over year, home price indices fell in 13 of the 20 cities included in the study.Denver was among the seven cities reporting increases, and had the third-largest increase of the twenty cities. Only Phoenix and Minneapolis reported larger year-over-year increases in the home price index than Denver.
The second chart shows trends in the Case-Shiller index for the Denver area and for the 20-city composite index. It is clear that Denver did not experience the kind of price bubble that occurred in many other metropolitan areas, and consequently, the index has not fallen nearly as far in Denver compared to the larger composite.
The 20-city composite is down 35 percent since it peaked in July 2006, but the Denver index is down only 11.8 percent from its August 2006 peak.
Although the Denver index showed some significant growth in March compared to March of last year, the Denver index during February was at levels comparable to those found during 2002.
The third chart compares year-over-year changes in the Denver area index and in the 20-city composite. The Denver index did not achieve the rates of growth experienced by the national index, but the Denver index did not experience comparable rates of decline following the onset of the national recession either. Overall, the index has been less volatile in Denver than has been the case for the 20-city composite, and the rates of decline in Denver have been smaller in recent months. The year-over-year change in the 20-city composite during March was negative with a decrease of 2.6 percent while Denver reported an increase of 2.6 percent, and also increased for the thirdmonth in a row. In the 20-city index, the year-over-year change has been negative for the past 18 months.
The last chart provides a closer look at year-over-year changes in the Denver index. Note that the change was below zero between June 2010 and December 2011, and likely reflects the end of the homebuyer tax credit’s end which has led to a fall in demand and a decline in the home price index. The upward trend in the index in response to the tax credit is clear during late 2009 and early 2010. Home prices showed increases in Denver compared to 2011 during the first quarter of 2012, and March's relatively large increase of 2.6 percent suggests continued strength in the demand for home purchases, at least in the short term .
Housing News Digest, May 29
Fire destroys Avon condominium complex
AVON - Three people escaped a three-alarm condominium complex fire that quickly spread to a neighboring hillside Monday afternoon.
Just after 4 p.m., a fire was reported at the Chambertin Condominiums located on 440 Nottingham Road.
Local living costs move closer to national average Rising costs for groceries, housing and utilities pushed local living costs to the closest they have been to the national average in seven years, according to a quarterly survey. Living costs in Colorado Springs were 4.5 percent below the national average in the first quarter, up from 6.8 percent below the average for all of 2011, according to a survey by the Arlington, Va.-based Council for Community and Economic Research.
Need to rent a house? Good luck finding one KUSA - Our recovering Colorado economy means it's very much a landlord's market on the rental front. That's what a new report from the Colorado Division of Housing is showing. We spoke with Ryan McMaken of the Colorado Division of Housing. He said vacancies in for-rent condos, single-family homes, and other small properties across metro Denver rose slightly during the first quarter although the market remained very tight with a rate of 1.6 percent.
Signs of 'Housing Spring': Bidding Wars Multiple offers and bidding wars have returned to some housing markets amid shrinking supplies of homes for sale. The dwindling inventories — driven by a mix of reluctant sellers, fewer foreclosure resales and rising demand — are spreading as the housing market gains strength.
Affordable' Apartments That Helped Sell Big Projects Have Yet to Materialize The promise of more than 4,000 units of low- and middle-income housing was a significant selling point for two of the city's largest new developments, Atlantic Yards in Brooklyn and Willets Point in Queens. Today, they are moving forward, but the housing pieces have been pushed back for years behind other portions of the multibillion-dollar projects, as the boom-era visions are proving to be difficult to see through in a slowly recovering economy.
Friday, May 25, 2012
Only 2 Colo counties built more multifam units in 2011 than 2008
Only two of Colorado's 64 counties issues more multifamily permits during 2011 than they did during 2008. 2008 was a peak year for multifamily production before the financial crisis led to a significant downturn in new construction of all types of housing units. According to census bureau data on building permits for 2011 in all Colorado counties, El Paso county issued 52 percent more multifamily permits during 2011 than it did during 2008, and Jefferson county issued 161 percent more multifamily permits in 2011 than in 2008.
The number of multifamily permits issued in the following counties fell by 100 percent (fell to zero) from 2008 to 2011:
Adams, Archuleta, Broomfield, Eagle, Garfield, Grand, Gunnison, La Plata, Montezuma, Montrose, Pitkin, Pueblo, Rio Blanco, Routt, San Miguel and Weld.
Among the 12 counties that reported any multifamily permit activity during 2011, Larimer, El Paso, Denver and Jefferson counties were the primary drivers behind statewide totals with 81 percent of all multifamily permit activity during 2011 coming out of those four counties.
The number of permits reported among the metropolitan counties:
Adams 0
Arapahoe 188
Boulder 223
Broomfield 0
Denver 1,835
Douglas 255
El Paso 657
Jefferson 504
Larimer 470
Mesa 64
Pueblo 0
Weld 0
If we adjust the number of new multifamily permits issued to the existing number of housing units, we find that Denver county was the most active county during 2011 with 1 permit issued per 144 occupied housing units. The second most active county was Larimer county with one new multifamily unit permitted for every 256 occupied housing units.
The map shows the counties broken into quartiles according to the number of permits adjusted for the size of the existing housing stock.
Highest quartile: Denver
Second-highest: Larimer, Delta
Third-highest Eagle, Jefferson, Douglas, El Paso, Alamosa
Bottom quartile: Arapahoe, Boulder, Summit, Mesa
All others: no activity
From 2010 to 2011, the counties that reported the biggest increases in multifamily activity were Denver, Douglas, El Paso and Jefferson counties. From 2010 to 2011, most counties reported declines, or reported zero multifamily activity in both years.
Among the counties that did report growth from 2010 to 2011, the growth rates were as follows:
Denver 290%
Douglas 254%
El Paso 753%
Jefferson 384%
Mesa 33%
Summit 63%
Conclusions: Among the counties that were active in new multifamily permitting in 2008, most have completely stopped building multifamily units as of 2011. Garfield county, for example, permitted 95 new multifamily units in 2008, but issued zero multifam permits during 2011. This sort of trend has been found in numerous mountain counties. Few counties saw growth from 2010 to 2011, although several Front Range counties has reported substantial growth rates, and those counties tend to be driving statewide totals in multifamily activity.
The number of multifamily permits issued in the following counties fell by 100 percent (fell to zero) from 2008 to 2011:
Adams, Archuleta, Broomfield, Eagle, Garfield, Grand, Gunnison, La Plata, Montezuma, Montrose, Pitkin, Pueblo, Rio Blanco, Routt, San Miguel and Weld.
Among the 12 counties that reported any multifamily permit activity during 2011, Larimer, El Paso, Denver and Jefferson counties were the primary drivers behind statewide totals with 81 percent of all multifamily permit activity during 2011 coming out of those four counties.
The number of permits reported among the metropolitan counties:
Adams 0
Arapahoe 188
Boulder 223
Broomfield 0
Denver 1,835
Douglas 255
El Paso 657
Jefferson 504
Larimer 470
Mesa 64
Pueblo 0
Weld 0
If we adjust the number of new multifamily permits issued to the existing number of housing units, we find that Denver county was the most active county during 2011 with 1 permit issued per 144 occupied housing units. The second most active county was Larimer county with one new multifamily unit permitted for every 256 occupied housing units.
The map shows the counties broken into quartiles according to the number of permits adjusted for the size of the existing housing stock.
Highest quartile: Denver
Second-highest: Larimer, Delta
Third-highest Eagle, Jefferson, Douglas, El Paso, Alamosa
Bottom quartile: Arapahoe, Boulder, Summit, Mesa
All others: no activity

From 2010 to 2011, the counties that reported the biggest increases in multifamily activity were Denver, Douglas, El Paso and Jefferson counties. From 2010 to 2011, most counties reported declines, or reported zero multifamily activity in both years.
Among the counties that did report growth from 2010 to 2011, the growth rates were as follows:
Denver 290%
Douglas 254%
El Paso 753%
Jefferson 384%
Mesa 33%
Summit 63%
Conclusions: Among the counties that were active in new multifamily permitting in 2008, most have completely stopped building multifamily units as of 2011. Garfield county, for example, permitted 95 new multifamily units in 2008, but issued zero multifam permits during 2011. This sort of trend has been found in numerous mountain counties. Few counties saw growth from 2010 to 2011, although several Front Range counties has reported substantial growth rates, and those counties tend to be driving statewide totals in multifamily activity.
Upcoming ULI event: June 7
June 7
trends conference for developers, planners, designers, brokers
will
answer: who is lending? building? buying? renting?
On Thursday, June 7, from 7:30 to 11:30 a.m. Urban
Land Institute Colorado presents “What’s
Next for Housing,” a half-day conference featuring more than 20 expert
speakers and panelists. To be held at the Embassy Suites Hotel, 1420 Stout
Street, Denver, the conference features keynote
Victoria S. Davis, President, Urban Atlantic
Development, Bethesda, Maryland.
For more information
and to register go to http://colorado.uli.org
Four
panels follow the keynote featuring these lineups.
Demographics. How Gen Y and Boomers
Are Affecting Market Demand. Moderator: Brad Segal,
P.U.M.A. Panelists: Elizabeth Garner, Colorado State Demographer; John Covert,
MetroStudy; Elizabeth Borden, The Highland Group
Affordable Housing: Doing More with
Less. Moderator:
Pat Coyle, Director, Colorado Division of Housing. Panelists: Stuart Grogan,
Boulder Housing Partners; Aaron Miripol, Urban Land Conservancy; Yong Cho,
Studio Completiva; Cris White, Colorado Housing and Finance Authority (CHFA)
Apartments: Lasting Market Change, or
New Bubble? Moderator:
Jeff Hawks, Apartment Realty
Advisors. Panelists: Scott Holton, Element Properties; Matthew Schildt,
Trammell Crow Residential; John Binder, KEPHART; Ralph Pace, US Bank
For Sale Housing (Single Family and
Condo): Coming Back When & How? Moderator: Andy
Knudtsen, EPS Denver. Panelists: David Ware, McStain Constructors; Ron
Tilton, FirstBank; Liz Richards, Kentwood City Properties
Foreclosure inventory falls to 2007 levels in Colorado
The foreclosure inventory in Colorado got smaller during the first
quarter of 2012 as the total percentage of mortgage loans in the
foreclosure process fell to 1.95 percent. During the first quarter, the foreclosure inventory fell to the lowest level recorded since the fourth quarter of 2007. During the fourth quarter of
2011, 2.01 percent of all mortgage loans were in the foreclosure
process.
According to the National Delinquency Survey, released earlier this month by the Mortgage Bankers Association, 30-day delinquencies were down year over year, falling from 2.17 percent to 2.03 percent.
The foreclosure inventory in Colorado has fallen for five quarters in a row following an uptick in the foreclosure inventory during the fourth quarter of 2010.
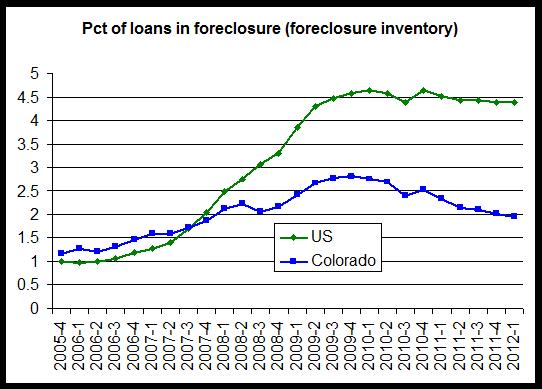
The national foreclosure inventory rate was 4.39 percent during the first quarter of 2012, continuing a trend in which the national foreclosure inventory rate has been above the Colorado rate since the fourth quarter of 2007.
As noted in an earlier post, Colorado was 6th best in the nation for the percentage of loans that are either in foreclosure or are 90 or more days delinquent.
The first graph shows the foreclosure inventory rate for each quarter since the fourth quarter of 2005. Colorado is in a generally downward trend that began after the fourth quarter of 2009. It is important to note, of course, that while Colorado is back to the foreclosure inventory rate it experienced in 2009, 2009 was not a good year for real estate and foreclosures, and the foreclosure inventory is still about than double what it was in 2005.
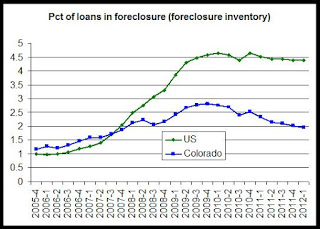
Foreclosure inventory rate:
Colorado:
1st Q 2012: 1.95
4th Q 2011: 2.01
1st Q 2011: 2.33
Most recent peak: 2.81, 4th Q 2009
US:
1st Q 2012: 4.39
4th Q 2011: 4.38
1st Q 2011: 4.52
Most recent peak: 4.63, 1st Q 2010, or 4th Q 2010
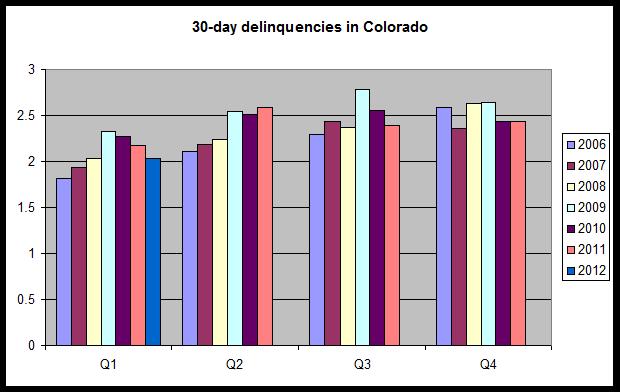
30-day delinquencies
During the fourth quarter of 2011, new 30-day mortgage delinquencies in Colorado were down year over year, falling from 2.17 percent to 2.03 percent.
In the graph below, the 30-day delinquency rate is broken out by year and by quarter. We can see that the 30-day delinquency rate for the first quarter of this year was the lowest first-quarter rate reported since 2008 when the rate was also 2.03 percent, and the first-quarter rate has now fallen for three years in a row.

According to the National Delinquency Survey, released earlier this month by the Mortgage Bankers Association, 30-day delinquencies were down year over year, falling from 2.17 percent to 2.03 percent.
The foreclosure inventory in Colorado has fallen for five quarters in a row following an uptick in the foreclosure inventory during the fourth quarter of 2010.
The national foreclosure inventory rate was 4.39 percent during the first quarter of 2012, continuing a trend in which the national foreclosure inventory rate has been above the Colorado rate since the fourth quarter of 2007.
As noted in an earlier post, Colorado was 6th best in the nation for the percentage of loans that are either in foreclosure or are 90 or more days delinquent.
The first graph shows the foreclosure inventory rate for each quarter since the fourth quarter of 2005. Colorado is in a generally downward trend that began after the fourth quarter of 2009. It is important to note, of course, that while Colorado is back to the foreclosure inventory rate it experienced in 2009, 2009 was not a good year for real estate and foreclosures, and the foreclosure inventory is still about than double what it was in 2005.
Foreclosure inventory rate:
Colorado:
1st Q 2012: 1.95
4th Q 2011: 2.01
1st Q 2011: 2.33
Most recent peak: 2.81, 4th Q 2009
US:
1st Q 2012: 4.39
4th Q 2011: 4.38
1st Q 2011: 4.52
Most recent peak: 4.63, 1st Q 2010, or 4th Q 2010
30-day delinquencies
During the fourth quarter of 2011, new 30-day mortgage delinquencies in Colorado were down year over year, falling from 2.17 percent to 2.03 percent.
In the graph below, the 30-day delinquency rate is broken out by year and by quarter. We can see that the 30-day delinquency rate for the first quarter of this year was the lowest first-quarter rate reported since 2008 when the rate was also 2.03 percent, and the first-quarter rate has now fallen for three years in a row.
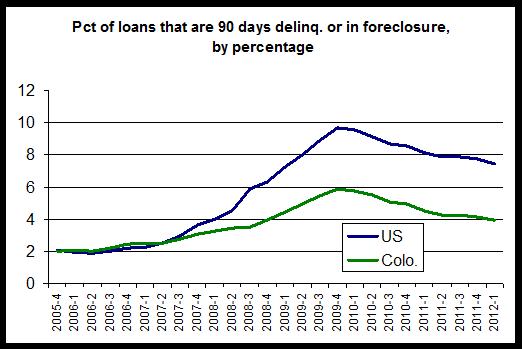
MBA: Colorado 6th-best in the nation for delinquencies and foreclosures
During the first quarter of 2012, only six states reported lower
percentages of mortgage loans that were were either in foreclosure or
were 90 days delinquent. According to the first quarter's national
delinquency survey, released earlier this month by the Mortgage Bankers
Association, the percentage of mortgage loans in Colorado that are
either in foreclosure or are either 90-days delinquent, was 3.91
percent. Nationally, the rate was 7.44 percent. Only Nebraska, Alaska, Montana, Wyoming and the Dakotas reported a
delinquency/foreclosure rate that was lower than Colorado's.
The graph shows the the percentage of loans that are either in foreclosure or 90+ days delinquent in both the US and in Colorado over the past six years. The foreclosure/90-day delinquency measure has decreased in both the US and in Colorado for every quarter since the fourth quarter of 2009.
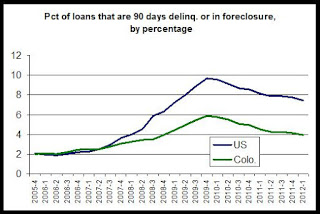
At the same time, Colorado has continued to compare more favorably to more and more states over time. This has been due to the number of states that have continued to report growth in delinquencies and foreclosures while Colorado's rate has declined.
In total loans that are either 90+ days delinquent or are in foreclosure, Colorado moved up from the 7th-best in the nation during the fourth quarter of last year, to 6th best in the nation during the first quarter of this year.
Colorado was also 6th-vest according to the LPS mortgage monitor, analyzed here.
The graph shows the the percentage of loans that are either in foreclosure or 90+ days delinquent in both the US and in Colorado over the past six years. The foreclosure/90-day delinquency measure has decreased in both the US and in Colorado for every quarter since the fourth quarter of 2009.
At the same time, Colorado has continued to compare more favorably to more and more states over time. This has been due to the number of states that have continued to report growth in delinquencies and foreclosures while Colorado's rate has declined.
In total loans that are either 90+ days delinquent or are in foreclosure, Colorado moved up from the 7th-best in the nation during the fourth quarter of last year, to 6th best in the nation during the first quarter of this year.
Colorado was also 6th-vest according to the LPS mortgage monitor, analyzed here.
CORRECTED 5/25: Denver home prices inch up 1.1 percent in latest LPS index
According to the LPS Home Price Index for February,
released this month, the average house price in the Denver was up 1.1
percent from February 2011 to February 2012. According to the report, the
average home price in the Denver area was $232,000 during February 2012,
which was up slightly from $230,000 recorded during February 2011. The
Denver average price was the 10th-highest average price among the 25
cities surveyed. In Denver, the average price peaked during Jun of 2007.
Nationally, the average house price fell 2.5 percent form February 2011 to February 2012, dropping to $195,000. Nationally, the average house price peaked during June of 2006.
Denver's home price was up, and only six other metro areas reported gains, including Cincinnati, Detroit, Honolulu, Minneapolis, Pittsburgh, and Washington, DC. All other areas reported declines.
According to the LPs press release:
This report shows few surprises when compared to other home price indices such as the FHFA's report and the Case-Shiller index. The Denver area continues to show more stability in prices than most metro areas surveyed and continues to show smaller declines in prices than the nation as a whole. A change of 1.1 percent is similar to the February price change shown by the Case-Shiller index (+0.5 percent) and is below the change reported for March by the Corelogic index (+3.0 percent).
See here for the home price archives.
Nationally, the average house price fell 2.5 percent form February 2011 to February 2012, dropping to $195,000. Nationally, the average house price peaked during June of 2006.
Denver's home price was up, and only six other metro areas reported gains, including Cincinnati, Detroit, Honolulu, Minneapolis, Pittsburgh, and Washington, DC. All other areas reported declines.
According to the LPs press release:
"Our HPI shows an increase in seasonally adjusted prices this month for the first time since March 2010, and for only the third time in five years,” said Raj Dosaj, vice president of LPS Applied Analytics. “There have been signs of price declines slowing for a few months now, and our estimates for next month are flat to slightly positive. Without a pickup in sales volumes from their current anemic levels, it’s hard to be more optimistic that the market may be nearing the end of its fall."
This report shows few surprises when compared to other home price indices such as the FHFA's report and the Case-Shiller index. The Denver area continues to show more stability in prices than most metro areas surveyed and continues to show smaller declines in prices than the nation as a whole. A change of 1.1 percent is similar to the February price change shown by the Case-Shiller index (+0.5 percent) and is below the change reported for March by the Corelogic index (+3.0 percent).
See here for the home price archives.
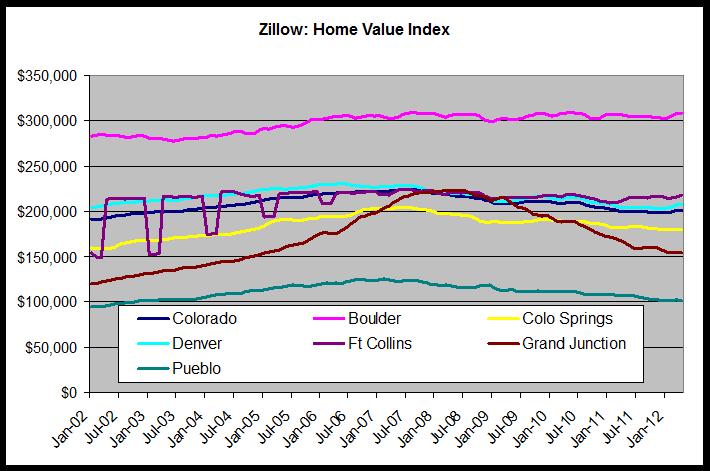
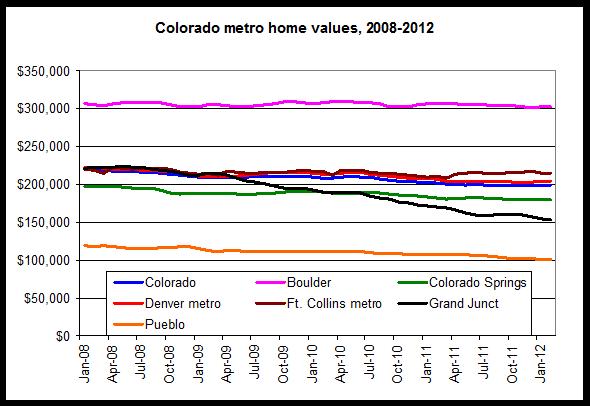
Zillow: Denver metro, Ft. Collins home prices up, Pueblo and Grand Jct. prices down
The Zillow Home Value Index for the United States decreased 1.8
percent from April 2011 to April 2012, falling to $147,300. In
Colorado, the home value index rose 0.9 percent over the same period to
$201,800.
In Colorado's metro areas, from April 2011 to April 2011, home prices increased in Boulder, Denver metro and in the Ft. Collins metros. Prices decreased in Colorado Springs, Grand Junction and Pueblo over the same period. Grand Junction and Pueblo dropped by 7.2 percent and 5.7 percent, respectively.
Greeley data was not included in the report.
Change from April 2011 to April 2012:
Boulder+0.9
Colo Springs -1.4
Denver metro+1.9
Ft. Collins+2.5
Grand Junct-7.2
Pueblo -5.7
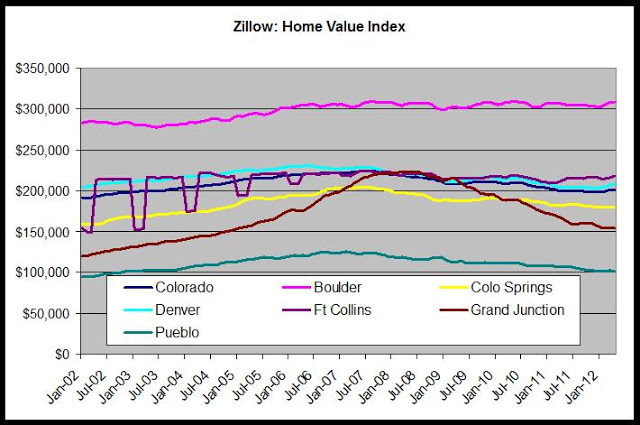
As can be seen in the graph, in recent years, home prices have shown the most stability in Boulder, Fort Collins and in Denver metro. These three areas also have the highest median estimated value, according to Zillow.
Estimated home value for each metro area for February 2012:
Boulder $308,300
Colo Springs $179,400
Denver metro $208,000
Ft. Collins $218,100
Grand Junct $154,300
Pueblo $101,000
The Grand Junction area has showed the most bubble-like behavior in its run-up in prices in 2007 and 2008 before a significant decline over the past 2 years.
Zillow home valuations, known as the median "Zestimate valuation" should be taken with a grain of salt, but in this case they do appear to be in line with other home price indices and trends. The metro trends presented here match up well with the metro trends provided by FHFA's quarterly reports on home prices in Colorado.
The strongest Colorado job markets, found in Boulder, metro Denver and the Ft. Collins area correspond with the highest home value estimates. The continued small declines in prices reflects other indices, although the Case-Shiller and CoreLogic indices did show some small increases for prices during January and February, respectively.
In Colorado's metro areas, from April 2011 to April 2011, home prices increased in Boulder, Denver metro and in the Ft. Collins metros. Prices decreased in Colorado Springs, Grand Junction and Pueblo over the same period. Grand Junction and Pueblo dropped by 7.2 percent and 5.7 percent, respectively.
Greeley data was not included in the report.
Change from April 2011 to April 2012:
Boulder+0.9
Colo Springs -1.4
Denver metro+1.9
Ft. Collins+2.5
Grand Junct-7.2
Pueblo -5.7
As can be seen in the graph, in recent years, home prices have shown the most stability in Boulder, Fort Collins and in Denver metro. These three areas also have the highest median estimated value, according to Zillow.
Estimated home value for each metro area for February 2012:
Boulder $308,300
Colo Springs $179,400
Denver metro $208,000
Ft. Collins $218,100
Grand Junct $154,300
Pueblo $101,000
The Grand Junction area has showed the most bubble-like behavior in its run-up in prices in 2007 and 2008 before a significant decline over the past 2 years.
Zillow home valuations, known as the median "Zestimate valuation" should be taken with a grain of salt, but in this case they do appear to be in line with other home price indices and trends. The metro trends presented here match up well with the metro trends provided by FHFA's quarterly reports on home prices in Colorado.
The strongest Colorado job markets, found in Boulder, metro Denver and the Ft. Collins area correspond with the highest home value estimates. The continued small declines in prices reflects other indices, although the Case-Shiller and CoreLogic indices did show some small increases for prices during January and February, respectively.
Housing News Digest, May 25
Permits to build single-family homes in Colorado up
DENVER — Interest in building homes in Colorado appears to be growing.
State housing officials say that through the first three months of this year, permits for single-family home construction in Colorado are up 34 percent compared with the same time last year
Home/condo vacancy rate is at 1.6 percent Less than 2 percent of the rental homes and condominiums in the Denver metro area were vacant in the first quarter, according to a new study that the Colorado Division of Housing released Thursday.
Colorado bank profits jump in Q1 Colorado banks continue to increase their profitability, with insured institutions reporting $99 million year-to-date net income as of March 31, compared with $56 million in the first quarter of 2011, according to Federal Deposit Insurance Corp. data released Thursday.
Oakwood completes purchase of portion of Banning Lewis Oakwood Homes completed its purchase Wednesday of 2,600 acres of the northern portion of the Banning Lewis Ranch in Colorado Springs, breathing new life into a property beset by the financial troubles of previous owners.
Fed releases Ally foreclosure review plan The Federal Reserve released a plan between Ally Financial and third-party consultant PricewaterhouseCoopers, hired to conduct the independent foreclosure review. The release also included an action plan from Citigroup ($26.66 0%), updating the Fed on its implementation of consent order requirements agreed to in April 2011. The Fed also included a letter from HSBC ($40.28 -0.24%) covering how the bank plans to implement single-point-of-contact requirements under the consent order.
Thursday, May 24, 2012
Kansas City Fed: 'manufacturing activity rebounded in May'
According to the Kansas City Fed, manufacturing in the Fed's tenth district, which includes Colorado, rebounded in May:
The full report is here.
Growth in Tenth District manufacturing activity rebounded in May, and producers were more optimistic than in previous months. The majority of producers reported stable or increasing capital spending plans in the next six to twelve months, with very few anticipating a decrease. Most price indexes moderated, although more producers than in April plan to raise selling prices in future months.
Future factory indexes rose solidly after two months of slight moderation. The future composite index increased from 12 to 17, and the future new orders and order backlog indexes also improved. The future production and shipments indexes posted their highest levels since early 2011, and the future employment index inched higher from 15 to 18.
The full report is here.
Trulia: Rent growth in Denver and Colo. Springs among top ten in nation
Asking prices for homes were up 6.3 percent in the Denver area, year over year, during April 2012, according to a new report from Trulia. Denver was listed among the top ten metros for price increases.
Meanwhile, both Colorado Springs and metro Denver were listed among the top ten metros with the largest rent increases. According to the report, rents in Denver metro increased 9.8 percent from April 2011 to April 2012, while rents increased 10.2 percent in Colorado Springs during the same period.
According to Trulia:
The year-over-year price increases are significantly larger in the Trulia study than in recent State of Colorado vacancy and rent studies. In the state's study, the year over year rent increase for the first quarter (March data) was 4.5 in metro Denver and 2.4 percent in Colorado Springs. See here for more.
Meanwhile, both Colorado Springs and metro Denver were listed among the top ten metros with the largest rent increases. According to the report, rents in Denver metro increased 9.8 percent from April 2011 to April 2012, while rents increased 10.2 percent in Colorado Springs during the same period.
According to Trulia:
Asking prices on for-sale homes-which lead sales prices by approximately two or more months-were 0.5 percent higher in April than in March, seasonally adjusted. Together with increases in March and February, asking prices in April rose nationally 1.9 percent quarter over quarter (Q-o-Q), seasonally adjusted. The price increase unadjusted for seasonality was even higher: 4.8 percent Q-o-Q, since prices typically jump in springtime. Year over year (Y-o-Y), asking prices rose 0.2 percent nationally.
The year-over-year price increases are significantly larger in the Trulia study than in recent State of Colorado vacancy and rent studies. In the state's study, the year over year rent increase for the first quarter (March data) was 4.5 in metro Denver and 2.4 percent in Colorado Springs. See here for more.
Metro Denver best among 25 metros for foreclosures and delinquencies
Corelogic released today its March 2012 report on delinquencies and foreclosures. According to the report,
the number of homes with mortgages that were more than 90 days
delinquent in the US were down 0.5 percent during March when compared
to March 2011. The foreclosure inventory was down 0.1 percent over
the same period. Nationally, 3.4 percent of all homes with mortgages
were in the foreclosure inventory, and 7.0 percent of loans were 90+
days delinquent.
In Colorado, the number of homes with mortgages that were more than 90 days delinquent fell by 0.6 percent from March 2011 to March 2012. Over the same period, the percentage of homes with mortgages that were in the foreclosure inventory fell by 0.4 percent.
3.8 percent of homes with mortgages in Colorado were more than 90-days delinquent while 1.4 percent of all homes with mortgages were in foreclosure.
Overall, the proportion of homes affected in Colorado was substantially smaller in Colorado than in the nation as a whole.
43 states reported higher rates of 90-day delinquency than Colorado. Only 6 states reported lower rates: Montana, Alaska, Wyoming, Nebraska and The Dakotas.
States with significantly higher rates of delinquency and foreclosure were Nevada, Florida and New Jersey.
41 states reported foreclosure inventory rates that were higher than Colorado's rate of 1.4 percent. Only 4 states reported lower foreclosure inventory rates: North Dakota, Nebraska, Alaska and Wyoming. Four states reported the same foreclosure inventory rate as Colorado.
The states with the highest foreclosure inventory rates were Nevada, Florida, New Jersey and Illinois.
According to the report, 3.9 percent of all homes with mortgages in the Denver-Aurora-Broomfield area were 90 days or more delinquent, which placed the Denver area last among 25 metro. All other metro areas reported higher delinquency rates. In Chicago, for example, the 90+-day delinquency rate was 10.5 percent during March.
The Denver area was also last among all metros in its foreclosure inventory. 1.4 percent of all loans with mortgages were in foreclosure in the Denver area. In Chicago, the rate was 6.4 percent.
Zillow: 29% of homes underwater in Denver area
29 percent of homeowners with mortgages have negative equity
in their homes. According to a report released today by Zillow, that percentage
is down a bit from the fourth quarter of 2011 when the percentage of mortgaged
homes that were underwater was 30.2 percent. Among the homeowners who were
underwater, 6.1 percent were 90 days or more delinquent.
Nationwide, the percentage of homes that are underwater is
31.4 percent, and 10.1 percent of the underwater homeowners are 90 days or more
delinquent.
See below for the list released today by Zillow.
Zillow's number for underwater homes are considerably higher
than the numbers
put out recently by Corelogic. Corelogic's numbers, which measure the
state as a whole as opposed to the metro Denver
area, during recent quarters estimate that about 21 percent of mortgaged homes
in Colorado
are underwater.
Since statewide averages tend to be heavilty influenced by Denver metro trends, it stands to reason that there is a
significant variation between Zillow's numbers and Corelogic's numbers for
metro Denver.
Zillow also provided county level data. There are few
surprises here. The counties with some of the highest foreclosure rates in
recent years have some of the highest numbers for underwater homes, while some
of the areas with the lowest foreclosure rates have some of the lowest numbers
for underwater homes.
Adams 42%
Arapahoe 35%
Boulder
13%
Broomfield
15%
Denver
29%
Douglas 20%
El Paso
31%
Jefferson 22%
Larimer 16%
Mesa
41%
Pueblo
35%
Weld 35%
Some info on some non-metro counties was provided as well. Garfield county, for
example had an underwater rate op 45%, according to Zillow.
The full press release is below.
Housing News Digest, May 24
Fort Collins, Greeley among most affordable Colorado cities
The Fort Collins-Loveland area ranked 118th on the list of 225 while Greeley ranked 127th. Pueblo and Colorado Springs are listed as more affordable for home buyers, ranking 27th and 65th respectively.
The index calculates affordability based on the share of homes in an area that are affordable for households at the median income level, according to the Colorado Division of Housing. Rental home data is not included in the index.
US sales of new homes rose 3.3 percent in April WASHINGTON — Americans bought more new homes last month, the latest evidence that the U.S. housing market could be starting to recover. New-home sales increased 3.3 percent in April from March to a seasonally adjusted annual rate of 343,000, the Commerce Department said Wednesday. Sales rose sharply in every region of the country but the South.
Sales of new homes inch up NEW YORK (CNNMoney) -- Sales of new homes are showing some signs of life, growing 3.3% month over month to an annualized rate of 343,000 in April, according to a government report released Wednesday. Sales are still slow compared with the boom years when they reached a rate of close to 1.4 million, but the month's results were slightly better than expected. Industry experts had projected a rate of 339,000, according to Briefing.com.
Vacancies in Denver-area rental houses at historic lows Vacancies in Denver-area rental houses remained near historic lows during the first quarter of this year, the Colorado Division of Housing said today. Vacancies in for-rent condos, single-family homes and other small properties across metro Denver rose slightly during the first quarter although the market remained tight with a vacancy rate of 1.6 percent.
More than 30% of mortgage borrowers still underwater NEW YORK (CNNMoney) -- Despite rising home prices, more than 30% of borrowers, or close to 16 million homeowners, were underwater on their mortgage during the first quarter, according to Zillow. The percentage of borrowers who owed more on their home than it was worth increased to 31.4% during the quarter, up slightly from 31.1% three months earlier, according to Zillow. In the year-ago period, 32.4% of all borrowers had negative equity on their loan.
Vacancies in Denver-area rental houses remain at historic lows
Vacancies in
for-rent condos, single-family homes, and other small properties across metro Denver rose slightly
during the first quarter although the market remained very tight with a rate of
1.6 percent. The vacancy rate during the first quarter was the second-lowest
vacancy rate recorded in any quarter since the survey was started in 2001. According to a report released Thursday by the
Colorado Division of Housing, the metro-wide vacancy rate during the first
quarter of 2012 was up from 2011’s first-quarter rate of 1.4 percent while it
was down from 2011’s fourth-quarter rate of 2.1 percent.
At the county level,
the lowest vacancy rates were found in Douglas
County and in Jefferson County
where the vacancy rates were 1.3 percent and 1.0 percent, respectively.
The highest
county-wide vacancy rate, found in Adams
County, was 3.8 percent.
Vacancy rates for
all counties surveyed were: Adams, 3.8 percent; Arapahoe, 1.9 percent; Denver, 1.7 percent; Douglas, 1.3 percent; and Jefferson, 1.0 percent.
“With a vacancy rate
below two percent, you’re essentially dealing with 100% occupancy,” said Ryan
McMaken, a spokesman for the Colorado Division of Housing. “The vacancies we do
see are due to little more than turnover, so this tells us that in most of the
metro area, rental homes are filling up, and are doing so rather quickly.”
During 2012’s first
quarter, the average number of days on the market for single-family rentals and
similar properties was 28.7 days, which was the third-lowest average recorded
since the survey was started in 2001. The number of days on the market during
the first quarter was down from 29.7 days during 2011’s first quarter, and was
also down from 2011’s fourth-quarter average of 38.9 days.
The average rent in
metro Denver
for single-family and similar properties rose to $1,056 during 2012’s first
quarter, rising 1.6 percent from 2011’s first-quarter average rent of $1,039.
This year’s first quarter’s average rent was down from 2011’s fourth-quarter
average rent of $1,062. Average rents
are not adjusted for inflation.
The average rent
rose, year over year, in all county areas except in Arapahoe and Adams counties. Growth in the average rent was strongest
in Jefferson County where the average rent grew 2.7
percent from 2011’s first quarter to 2012’s first quarter. The average rent
fell the most in Arapahoe
County where it was down
5.3 percent, year over year.
Average rents for all counties were: Adams, $1,046; Arapahoe, $1,003; Denver, $1,001; Douglas, $1,410; and Jefferson,
$1,020.
The Colorado Statewide
Vacancy and Rent Study is released each quarter by the Colorado Division of
Housing. The Report is available online at the Division of Housing economics
site: www.divisionofhousing.com. The
Colorado Vacancy and Rent Survey reports averages and, as a result, there are
often differences in rental and vacancy rates by size, location, age of
building, and apartment type.
Wednesday, May 23, 2012
Colorado still 6th best in nation for non-current mortgage loans
According to the LPS Mortgage Monitor ,
released today by Lender Processing Serives, 11.2 percent of mortgage
loans during March were "non-current" in the United States. That is,
they were 90-plus-days delinquent or were in foreclosure.
In Colorado, the percentage of active mortgage loans that were non-current during March was 6.2 percent, which was down 10.1 percent from the same period last year. Colorado's year-over-year decline in non-current loans was the 9th largest in the nation. Only Nevada, Michigan, Arizona, California, Idaho, Minnesota, Montana and Wyoming showed larger declines.
Only five states reported lower percentages of non-current loans than Colorado, making Colorado 6th-best in the nation for the percentage of its mortgage loans that were non-current during March 2012. Montana, Wyoming, South Dakota, Alaska and North Dakota reported lower percentages of non-current loans during February.
The states with the highest rates of non-current loans were Florida, Mississippi and Nevada with non-current rates of 21.5 percent, 16.6 percent and 15.5 percent, respectively.
According to LPS: LPS Mortgage Monitor is an in-depth report of mortgage industry performance. The monthly report is based on data from the company’s market-leading repository of loan-level residential mortgage data and performance information, including more than 40 million active loans across the credit spectrum. This data is analyzed by LPS experts to produce more than 30 charts and graphs reflecting both trend and point-in-time performance observations.
(The March report includes data up through March.)
Corelogic: March home prices up 3 percent in Colorado
After many months of year-over-year declines in Corelogic's Home Price Index (HPI),
Colorado showed a 3.0 increase during March 2012, marking the third month in a row during which CoreLogic has reported a year-over-year increase. The March HPI report, released this month by Corelogic, shows the national HPI rising by 0.6 percent, year over year.
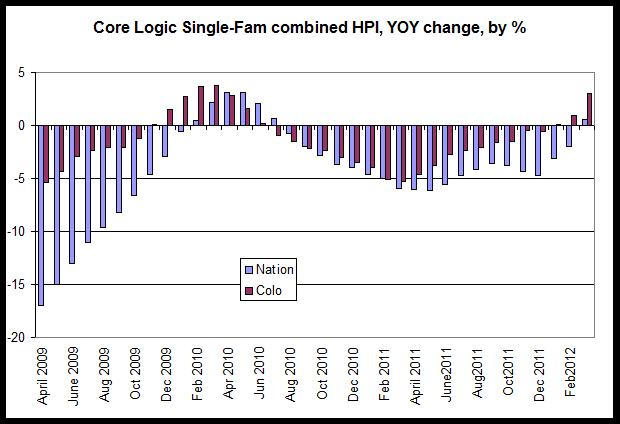
The annual increase in the HPI of 3.0 percent during March reflects to a certain extent other home price indices, such as the Case-Shiller index and the FHFA's expanded house price index. Indeed, the Case-Shiller index for February 2012 (the most recent data available) showed the second positive year-over-year increase in 21 months, with an increase of 0.5 percent. The CoreLogic HPI for March shows one of the larger gains in home prices for the state, although most indices now do show some small increases during the first quarter of the year.
The CoreLogic HPI shows that, nationally, home prices have fallen more than prices in Colorado and that Colorado prices are increasing at a faster rate.
In the March report, only 7 states reported larger year-over-year increases than Colorado. The states wit the largest increases were Wyoming and West Virginia with increases of 5.9 percent and 5.3 percent, respectively. The states with the largest declines in the home price index were Illinois and Delaware with drops of 8.3 percent and 10.6 percent, respectively.
Housing starts hit 4-year high in U.S. West region
Housing starts in the West Census region of the US, which includes
Colorado, were up 16.9 percent from April 2011 to April 2012,
counting both single-family and multi-family units. According to new
housing construction and housing starts data released last week by
the US Census Bureau, housing starts in the US. West region hit a four-year high and there were approximately 12,400 housing units
started in the West during April 2012. Of the new units started, 9,000
were single-family structures and 3,400 were structures containing more
than one housing unit.
Nationally, housing starts rose 31 percent during the same period, with total housing starts rising to a total of 64,200.
Total housing starts remain well below peak levels both nationally and in the West. April 2012 housing starts in the West were 77 percent below the peak reached during May 2004. Nationally, April was 67 percent below peak levels. The national peak in housing starts was reached during May 2005.
Multifamily starts have rebounded more than single-family starts. In the West, single-family starts are 81 percent below peak levels while multifamily starts are only 66 percent below peak levels.
The West census region includes states on the west coast and within the Rocky Mountain region.
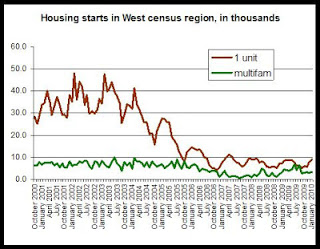
The first graph shows the difference between single-family starts and starts for structures in the West with more than one housing unit. Both remain near ten-year lows, but single-family starts in the West rose 25 percent from April 2011 to April 2012. Starts for structures with more than one unit were flat at 3,400 units over the same period.This runs contrary to local trends in Colorado which indicate that multifamily production is increasing faster than single-family production.
The second graph shows month-by-month comparisons in housing starts for each year in the West. April's housing starts total was a 12.7 percent increase from March. Nationally, the increase during the same period was 11.8 percent. Numbers are not seasonally adjusted.
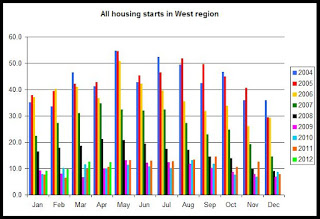
April 2012's multifamily starts were tied at a four-year high of 3,400. There were also 3,400 multifamily starts during April 2011.
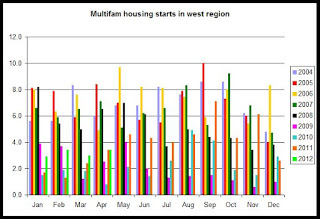
This report is the latest indicator pointing to some slight growth in new construction, but there are few signs, at least regionally, of surges in new housing starts. Multifamily has shown some ongoing signs of multifamily growth at the state level for Colorado, however.
Nationally, housing starts rose 31 percent during the same period, with total housing starts rising to a total of 64,200.
Total housing starts remain well below peak levels both nationally and in the West. April 2012 housing starts in the West were 77 percent below the peak reached during May 2004. Nationally, April was 67 percent below peak levels. The national peak in housing starts was reached during May 2005.
Multifamily starts have rebounded more than single-family starts. In the West, single-family starts are 81 percent below peak levels while multifamily starts are only 66 percent below peak levels.
The West census region includes states on the west coast and within the Rocky Mountain region.
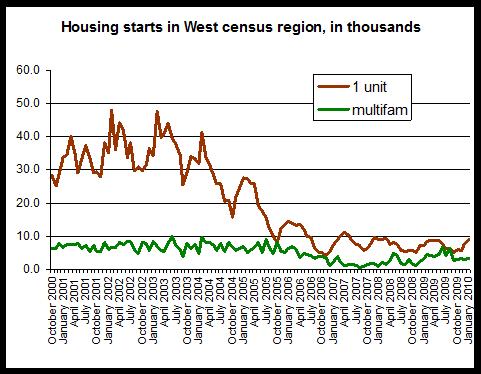
The first graph shows the difference between single-family starts and starts for structures in the West with more than one housing unit. Both remain near ten-year lows, but single-family starts in the West rose 25 percent from April 2011 to April 2012. Starts for structures with more than one unit were flat at 3,400 units over the same period.This runs contrary to local trends in Colorado which indicate that multifamily production is increasing faster than single-family production.
The second graph shows month-by-month comparisons in housing starts for each year in the West. April's housing starts total was a 12.7 percent increase from March. Nationally, the increase during the same period was 11.8 percent. Numbers are not seasonally adjusted.
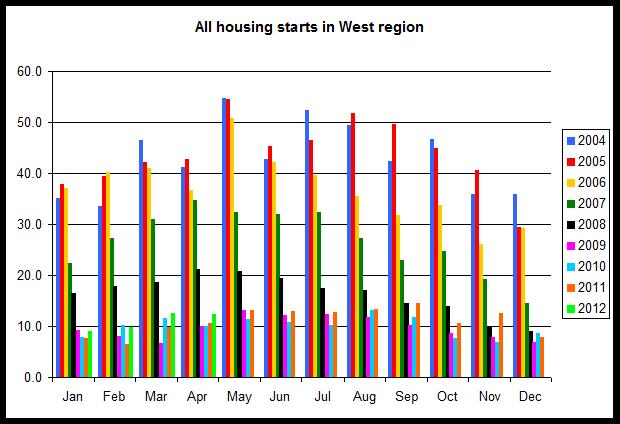
April 2012's multifamily starts were tied at a four-year high of 3,400. There were also 3,400 multifamily starts during April 2011.
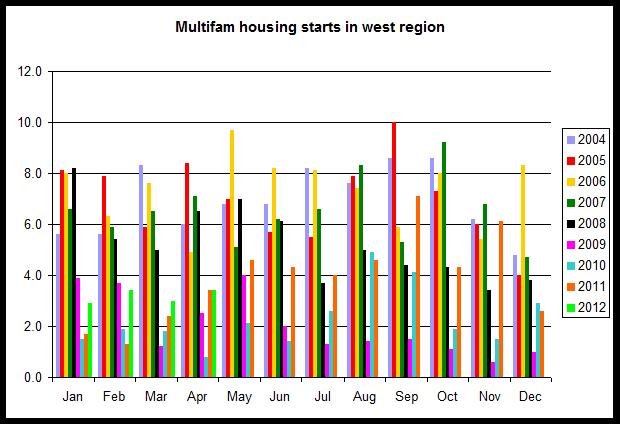
This report is the latest indicator pointing to some slight growth in new construction, but there are few signs, at least regionally, of surges in new housing starts. Multifamily has shown some ongoing signs of multifamily growth at the state level for Colorado, however.
Colorado multifamily permits surge in March, up 62 percent in 2012
Through March 2012 in Colorado this year, building permits issued
for multifamily construction were up 62 percent, year over year, while
permits issued for single-family construction were up 34 percent for
the same period.
During the month, 702 multifamily permits were issued in Colorado, and 913 single-family permits were issued. During March 2011, there were 493 multi-family permits issued, and 735 single-family permits issued. The first graph shows permit activity for the first three months of the year since 1998. Through March of this year, there have been 2319 single-family permits and 1108 multifamily permits issued.
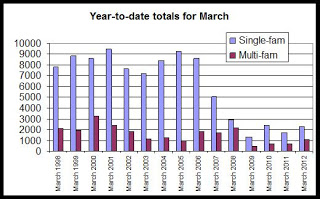
The second graph shows that overall, both multi-family and single-family permits in March were at levels well below what were typical over the past decade. During recent months, however, both multi-family and single-family permits have shown a slow upward trend.
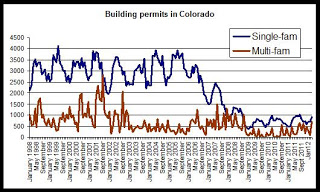
During March 2012, the number of new multi-family permits issued was up from March 2011, and were at a six-year high. Over the past decade, only 2006 had more multifamily permit activity during the month of March.
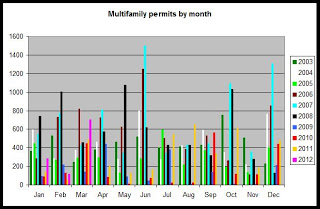
In the other hand. March was another flat month for single-family permits for the most part, and March's single-family permit total was at the third-lowest level reported in ten years. Overall, March's totals were well below March totals seen before 2009.

Once again, multi-family growth trends outpaced single-family growth, and March 2012 was one of the strongest months for multifamily activity in five years.
Summary: Permit activity during March signaled a continued lack of growth in single-family construction while multifamily activity continued to grow.
During the month, 702 multifamily permits were issued in Colorado, and 913 single-family permits were issued. During March 2011, there were 493 multi-family permits issued, and 735 single-family permits issued. The first graph shows permit activity for the first three months of the year since 1998. Through March of this year, there have been 2319 single-family permits and 1108 multifamily permits issued.
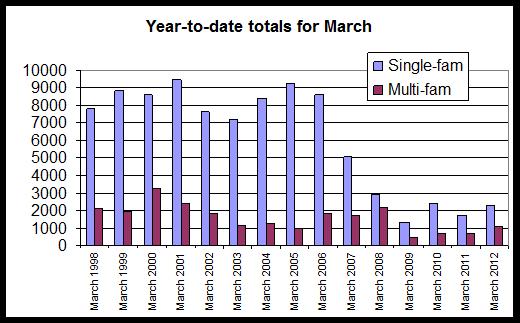
The second graph shows that overall, both multi-family and single-family permits in March were at levels well below what were typical over the past decade. During recent months, however, both multi-family and single-family permits have shown a slow upward trend.
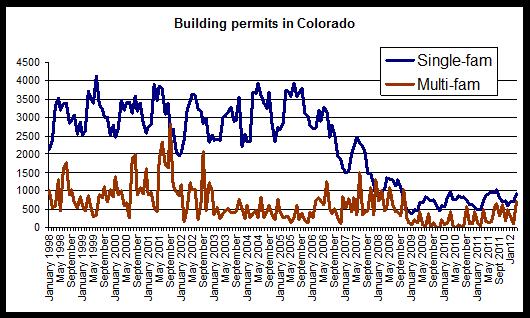
During March 2012, the number of new multi-family permits issued was up from March 2011, and were at a six-year high. Over the past decade, only 2006 had more multifamily permit activity during the month of March.

In the other hand. March was another flat month for single-family permits for the most part, and March's single-family permit total was at the third-lowest level reported in ten years. Overall, March's totals were well below March totals seen before 2009.
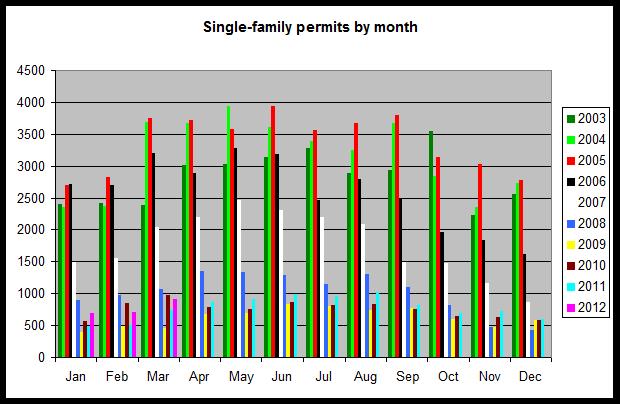
Once again, multi-family growth trends outpaced single-family growth, and March 2012 was one of the strongest months for multifamily activity in five years.
Summary: Permit activity during March signaled a continued lack of growth in single-family construction while multifamily activity continued to grow.
New home inventory falls to new low, sales up slightly
New single-family home sales rose 12.5 percent from April 2011 to April 2012, but total sales remain near post-recession lows. According to Tuesday's New Home
Sales report, released by the Census Bureau,there were nine thousand new
home sales in the Western U.S. during April 2012.
The report, which monitors sales activity for newly constructed houses, reported that in the West, new home sales were up from April 2011's 8,000 new homes sold. Nationwide, sales rose 10 percent, rising from 30,000 to 33,000 during the same period.
At 9,000 new home sales during April, sales are up from March 2012's total of 7,000, but were down from April 2010's total of 10,000. This suggests a continued lack of robust demand for new homes.
The first graph shows monthly new home sales totals for each month since 2003:
For the West region:
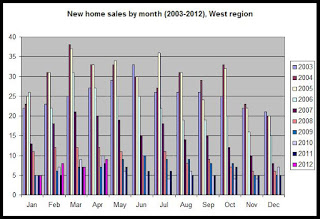
The second graph shows that new home sales continue to be well below peak levels, although they have begun to slowly move up in recent months.
New home sales peaked during the spring and summer of 2005 and have generally trended downward since. The number of new houses sold in the United States is down 74 percent since the peak of March 2005, and new home sales in the West have fallen 76 percent since sales peaked in the region during March 2004.
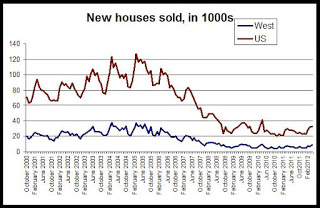
The third graph shows the declines in both US and regional totals in new homes for sale.
The number of new homes for sale has also fallen off considerably. The number of new houses for sale in the West has fallen 76 percent since the total peaked during June 2007, and the same total has fallen 74 percent in the US since the number of new homes for sale peaked in the US during August 2006.
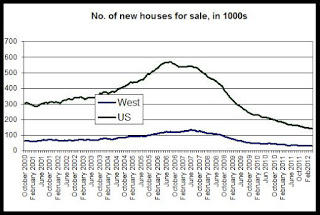
With 32,000 new homes for sale in April, the number of new single-family homes for sale in the West remained near March's ten-year low of 31,000.
As a final note, we can also look to the new home inventory. In this case, we calculate inventory by subtracting the number of new home sales in a given month from the number of new homes for sale at the end of the previous month. In the final graph, we see that the inventory is now at a ten-year low of 22,000 homes and is at the lowest level reported in more than 12 years. This is good news for owners seeking to sell homes since it suggests that fewer new homes are sitting and waiting to be sold, thus diminishing some of the inventory-driven downward pressure on prices. Inventory has also been down in existing home sales, as noted here.
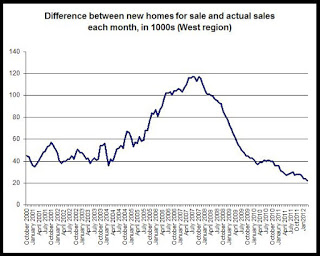 Overall,
this report shows that while new home sales are not declining, they are not showing growth either. Inventory is at very low levels, although median home price growth in existing homes may not be sufficient to spur a large amount of new single-family construction.
Overall,
this report shows that while new home sales are not declining, they are not showing growth either. Inventory is at very low levels, although median home price growth in existing homes may not be sufficient to spur a large amount of new single-family construction.
The report, which monitors sales activity for newly constructed houses, reported that in the West, new home sales were up from April 2011's 8,000 new homes sold. Nationwide, sales rose 10 percent, rising from 30,000 to 33,000 during the same period.
At 9,000 new home sales during April, sales are up from March 2012's total of 7,000, but were down from April 2010's total of 10,000. This suggests a continued lack of robust demand for new homes.
The first graph shows monthly new home sales totals for each month since 2003:
For the West region:
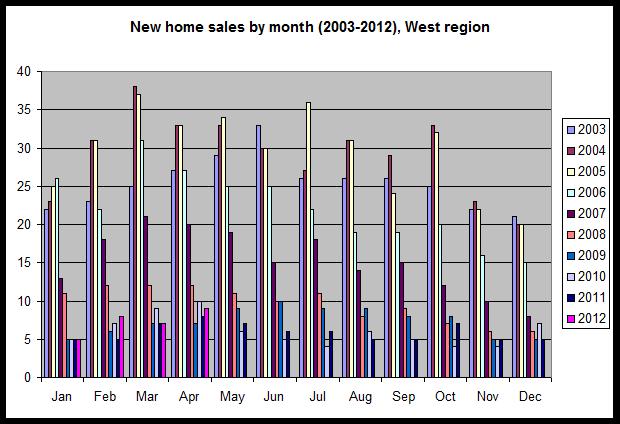
The second graph shows that new home sales continue to be well below peak levels, although they have begun to slowly move up in recent months.
New home sales peaked during the spring and summer of 2005 and have generally trended downward since. The number of new houses sold in the United States is down 74 percent since the peak of March 2005, and new home sales in the West have fallen 76 percent since sales peaked in the region during March 2004.
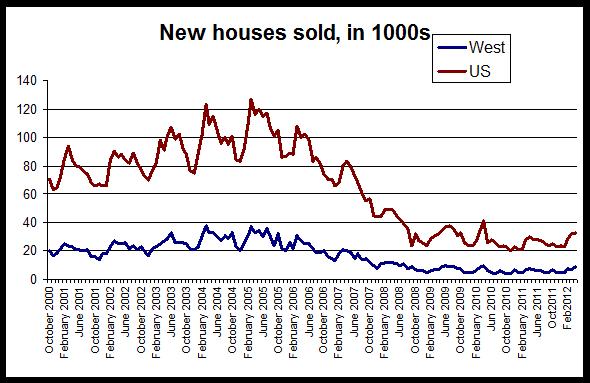
The third graph shows the declines in both US and regional totals in new homes for sale.
The number of new homes for sale has also fallen off considerably. The number of new houses for sale in the West has fallen 76 percent since the total peaked during June 2007, and the same total has fallen 74 percent in the US since the number of new homes for sale peaked in the US during August 2006.
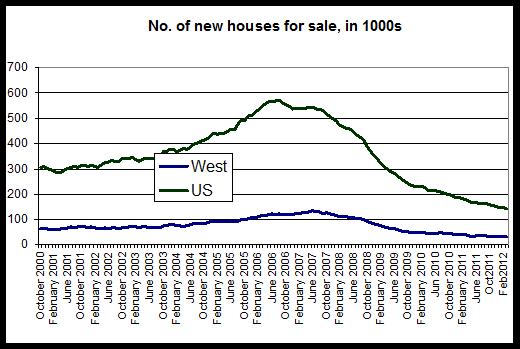

With 32,000 new homes for sale in April, the number of new single-family homes for sale in the West remained near March's ten-year low of 31,000.
As a final note, we can also look to the new home inventory. In this case, we calculate inventory by subtracting the number of new home sales in a given month from the number of new homes for sale at the end of the previous month. In the final graph, we see that the inventory is now at a ten-year low of 22,000 homes and is at the lowest level reported in more than 12 years. This is good news for owners seeking to sell homes since it suggests that fewer new homes are sitting and waiting to be sold, thus diminishing some of the inventory-driven downward pressure on prices. Inventory has also been down in existing home sales, as noted here.
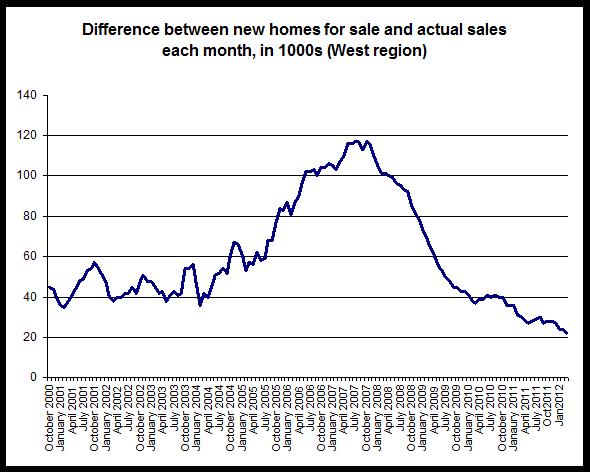
Tuesday, May 22, 2012
Builder sentiment declines in West, rises in all other regions
According to National Association of Home Builders/Wells Fargo Housing Market Index (HMI):
See full press release:
Three out of four regions registered improving builder sentiment in May. This included a six-point gain to 32 in the Northeast, and five-point gains to 27 and 28 in the Midwest and South, respectively. The West posted a two-point decline, to 29.
See full press release:
Goss index for April: Economic indicators in "very healthy range"
Mountain States’ Leading Economic Indicator Declines:
Inflation Pressures Down
April survey results at a glance:
Denver, CO - For the 30th straight month, the overall index for the Mountain States region, a leading economic indicator for the three-state area of Colorado, Utah and Wyoming, advanced above growth neutral 50.0. The national index has risen above growth neutral for 32 consecutive months (www.ism.ws) but has remained lower than the regional reading. As a result, growth in the Mountain States region is expected to exceed that of the U.S in the next 3 to 6 months.
Overall Index: The overall index, or Business Conditions Index, which ranges between 0 and 100, slipped to a healthy 58.8 from 62.6 in March. An index of 50.0 is considered growth neutral. The overall index is a mathematical average of indices for new orders, production or sales, employment, inventories and delivery lead time. This is the same methodology used by the national Institute for Supply Management.
Inflation Pressures Down
April survey results at a glance:
- Leading economic indicator stays in very healthy range.
- Exports remain important contributor to growth.
- Inflation cools significantly for the month.
- Input prices expected to expand by a low 2.2 percent for rest of 2012.
- Almost four of ten firms indicated that regulatory burdens were biggest obstacle to growth.
Denver, CO - For the 30th straight month, the overall index for the Mountain States region, a leading economic indicator for the three-state area of Colorado, Utah and Wyoming, advanced above growth neutral 50.0. The national index has risen above growth neutral for 32 consecutive months (www.ism.ws) but has remained lower than the regional reading. As a result, growth in the Mountain States region is expected to exceed that of the U.S in the next 3 to 6 months.
Overall Index: The overall index, or Business Conditions Index, which ranges between 0 and 100, slipped to a healthy 58.8 from 62.6 in March. An index of 50.0 is considered growth neutral. The overall index is a mathematical average of indices for new orders, production or sales, employment, inventories and delivery lead time. This is the same methodology used by the national Institute for Supply Management.
Housing Opportunity Index: Pueblo most affordable city, Boulder least affordable
The National Association of Home Builders and Wells Fargo released the first-quarter Housing Affordable Index this month. According to the index, Pueblo was the most affordable city in the state for home buyers, while Boulder was the least affordable. In fact, Pueblo was one of the most affordable cities in the nation with a ranking of 27th out of 225 cities. Boulder, on the other hand was one of the least affordable cities in the nation with a ranking of 199th out of 225.
The index calculates affordability based on the share of homes in the area affordable for households at the median income level.
Colorado Springs was ranked 65th while Ft. Collins-Loveland, Greeley, and Denver were ranked 118th, 127th and 150th, respectively. Grand Junction was not included on the list.
The index listed its calculations for the median sales price in each metro:
Boulder, $199,000
Colorado Springs, $180,000
Denver-Aurora, $150,000
Greeley, $175,000
Ft. Collins-Loveland, $214,000
Pueblo $110,000
Nationwide, the most affordable area was Cumberland, Marylandon the West Virginia border, and the least affordable area was San Francisco.
The index calculates affordability of purchase homes and does not include information on rental housing.
According to the NAHB press release:
Mass layoffs and new unemployment claims in Colorado down through April of this year
Mass layoff events fell 8.5 percent to 32 events during the first four
months of 2012 in Colorado. There were 35 mass layoff events during the
same period last year. According to a new report released today by the U.S. Bureau of Labor Statistics, there were 12 mass layoff events
during April 2012 alone, which was down 20 percent from the 15 events
reported during April of last year. Comparing the first four months
of each year, both total mass layoffs and first time unemployment have decreased each year since 2009.
Monthly mass layoff events grew rapidly after October 2008 in Colorado, andhave gradually declined since.
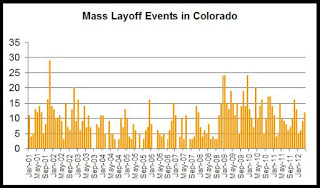
Nationally, mass layoff events decreased 18.8 percent from 1,750 during April 2011 to 1,421 during April of this year.
In the year-to-date total for April, mass layoffs have now fallen three years in a row after peaking at 71 mass layoffs during the first four months of 2009. The second graph shows year-to-date totals for April since 2002:

Mass layoffs were rare from 2004 through most of 2008.
Overall, the most recent mass layoffs data suggests that the employment situation continues to stabilize. New layoffs continue to lessen, but as we've seen in the most recent employment data for Colorado, job growth continues to disappoint and total employment totals remain well below 2008's peak totals.
New jobless claims
New claims for unemployment insurance fell year over year in April by 19.9 percent to 1,401 in April 2012. There were 1,750 new claims during April of last year. New claims for unemployment insurance have also gradually fallen since early 2010. Nationally, new claimants fell 22.9 percent during the same period.
As can be seen in the third graph, during April new unemployment claims fell year over year in Colorado and nationally.March 2012 showed the largest year over year increase in new claims since late 2009, although the overall monthly trends show much variation in year-over-year changes and do not point to a strong downward trend.
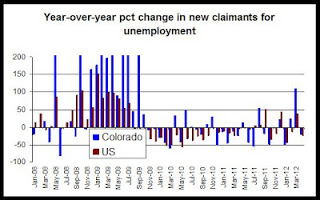
In year-to-date totals for new unemployment claims through April, totals are down 5.6 percent year over year in Colorado. There were 3,600 new claims during the first four months of 2012, compared to 3,816 new claims during the same period last year. In the year-to-date total for April, new claims for unemployment insurance have now fallen three years in a row after peaking at 6,325 claims during the first four months of 2009. The last graph shows year-to-date totals for April since 2002:
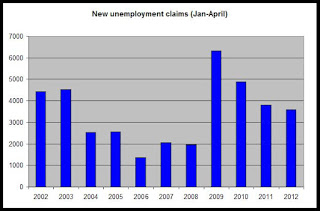
Monthly mass layoff events grew rapidly after October 2008 in Colorado, andhave gradually declined since.
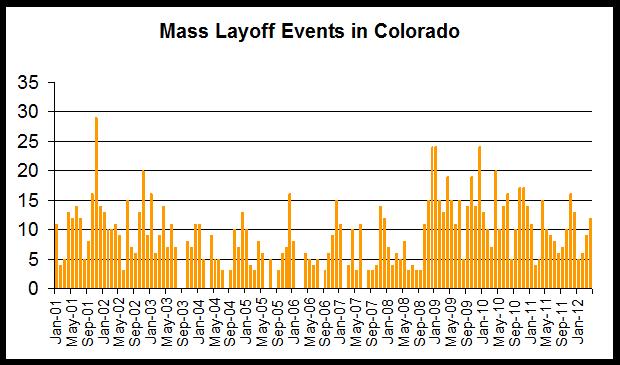
Nationally, mass layoff events decreased 18.8 percent from 1,750 during April 2011 to 1,421 during April of this year.
In the year-to-date total for April, mass layoffs have now fallen three years in a row after peaking at 71 mass layoffs during the first four months of 2009. The second graph shows year-to-date totals for April since 2002:
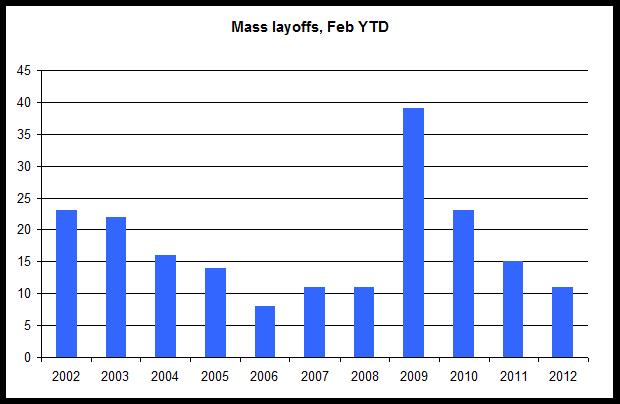
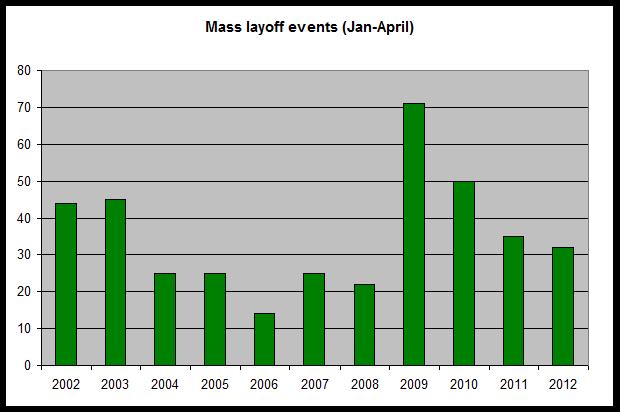
Mass layoffs were rare from 2004 through most of 2008.
Overall, the most recent mass layoffs data suggests that the employment situation continues to stabilize. New layoffs continue to lessen, but as we've seen in the most recent employment data for Colorado, job growth continues to disappoint and total employment totals remain well below 2008's peak totals.
New jobless claims
New claims for unemployment insurance fell year over year in April by 19.9 percent to 1,401 in April 2012. There were 1,750 new claims during April of last year. New claims for unemployment insurance have also gradually fallen since early 2010. Nationally, new claimants fell 22.9 percent during the same period.
As can be seen in the third graph, during April new unemployment claims fell year over year in Colorado and nationally.March 2012 showed the largest year over year increase in new claims since late 2009, although the overall monthly trends show much variation in year-over-year changes and do not point to a strong downward trend.

In year-to-date totals for new unemployment claims through April, totals are down 5.6 percent year over year in Colorado. There were 3,600 new claims during the first four months of 2012, compared to 3,816 new claims during the same period last year. In the year-to-date total for April, new claims for unemployment insurance have now fallen three years in a row after peaking at 6,325 claims during the first four months of 2009. The last graph shows year-to-date totals for April since 2002:
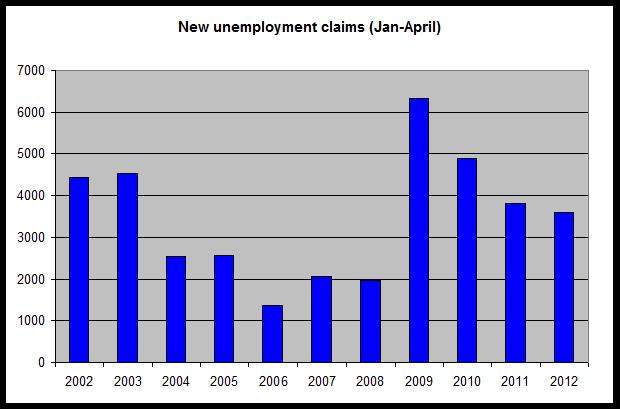
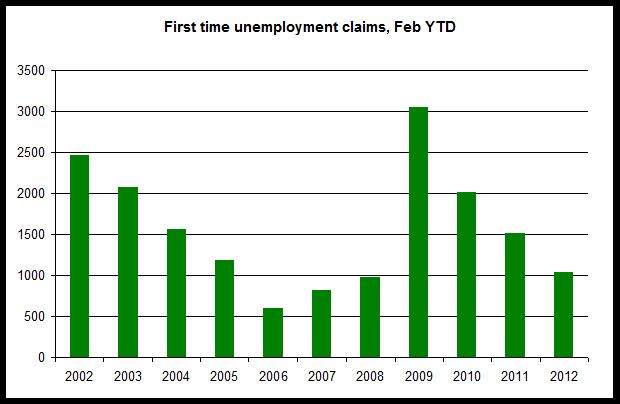
NAR: Median home prices in region at highest level since May 2010
The median home price in the West region of the U.S., which includes
Colorado, rose 15.9 percent from April 2011 to April 2012,rising to the highest median price recorded since May 2010. According to
new existing home sales data, released today
by the National Association of Realtors, the median home price rose
nationally and in all regions, with the West posting the largest year-over-year increase of all regions.
The first graph shows median home prices for all regions plus the U.S. The median home price in the West rose to $221,700. Nationally, the median home price rose to $177,400. In the West, the median price has increased 3 months in a row, reflecting seasonal factors, but is also showing more price gains than has been the gains over the past two years.
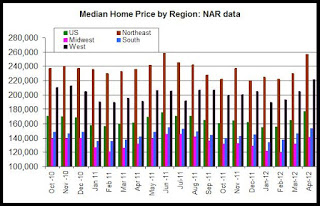
Nationally, home prices rose 10.1 percent, year over year.
According to today's report, home sales transactions (closings, not seasonally adjusted) rose 1.0 percent, from April 2011 to April 2012, in the West region while nationally, sales rose 6.7 percent during the same period. All regions reported year-over-year increases in sales activity. The largest increase was reported in the Northeast where sales rose 15.6 percent.
The second graph shows closings by region. All regions showed a month-over-month increase from March to April, which is common due to seasonality. Sales rose nationally 11.1 percent from March to April, while sales in the West rose 9.5 percent.
Overall, April's sales activity was higher than was the case during April of last year.
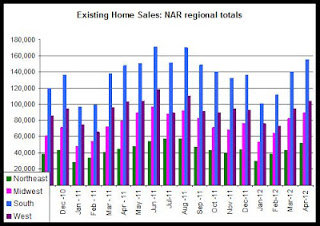 These numbers suggest continued slow and stead growth in home prices. Price growth, however, is moderated by sales of foreclosed properties and short sales. Local real estate professionals report that the most activity in purchases is occurring at the lower price levels below $300,000.
The first graph shows median home prices for all regions plus the U.S. The median home price in the West rose to $221,700. Nationally, the median home price rose to $177,400. In the West, the median price has increased 3 months in a row, reflecting seasonal factors, but is also showing more price gains than has been the gains over the past two years.
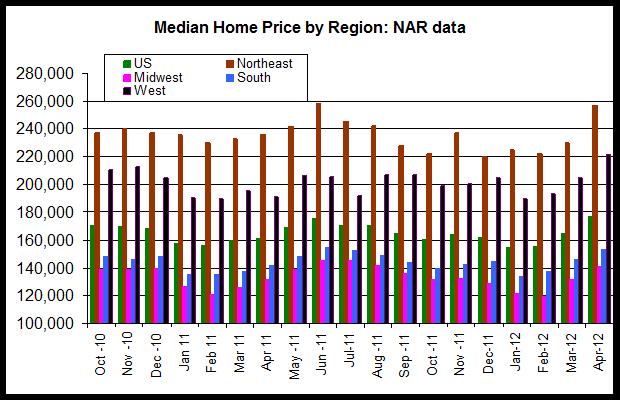
Nationally, home prices rose 10.1 percent, year over year.
According to today's report, home sales transactions (closings, not seasonally adjusted) rose 1.0 percent, from April 2011 to April 2012, in the West region while nationally, sales rose 6.7 percent during the same period. All regions reported year-over-year increases in sales activity. The largest increase was reported in the Northeast where sales rose 15.6 percent.
The second graph shows closings by region. All regions showed a month-over-month increase from March to April, which is common due to seasonality. Sales rose nationally 11.1 percent from March to April, while sales in the West rose 9.5 percent.
Overall, April's sales activity was higher than was the case during April of last year.
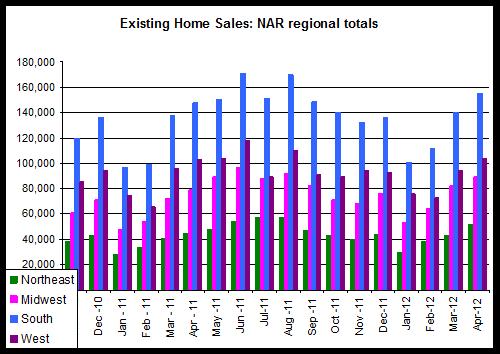
Subscribe to:
Posts (Atom)