Nationally, the CPI increased 3.6 percent, year-over-year, and was driven by increases in food and transportion costs, according to the BLS release:
The Consumer Price Index for All Urban Consumers (CPI-U) increased
0.5 percent in July on a seasonally adjusted basis, the U.S. Bureau
of Labor Statistics reported today. Over the last 12 months, the all
items index increased 3.6 percent before seasonal adjustment.
The gasoline index rebounded from previous declines and rose sharply
in July, accounting for about half of the seasonally adjusted
increase in the all items index. The food at home index accelerated
in July and also contributed to the increase, as dairy and fruit
indexes posted notable increases and five of the six major grocery
store food groups rose.
The index for all items less food and energy increased as well,
though the 0.2 percent increase was slightly smaller than the two
previous months. The shelter index accelerated in July, and the
apparel index again increased sharply. In contrast, the index for new
vehicles was unchanged after a long string of increases. The index
for household furnishings and operations was flat in July as well,
and the recreation index declined slightly.
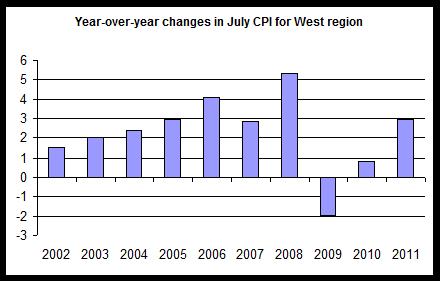
In the first graph, we can see that the CPI growth in July 2011 is now roughly the third-highest increase observed for July during the past ten years, and is extremely similar to CPI growth reported during July 2005 and July 2007. 2006 and 2008 showed larger increases, and price increases in those years were partially countered by strong growth in employment and incomes, but at the present time, income growth has been flat in recent years, as discussed here.
In the west region, as well as nationally, price increases are being largely driven by transportation costs, which increased by 8.6 percent, year over year. Food costs also increased significantly, rising 3.8 percent. Price increases in housing have begun to inch up with July's year-over-year increase at 1.3 percent. Housing costs to consumers will likely move upward as rent increases in the face of building demand and little new construction.
Recent price increases will impact household calculations and attitudes on spending as many households conclude that discretionary spending will need to be scaled back in the face of increasing food and transportation costs. These price increases come in the face of continued lackluster performance in the labor markets.
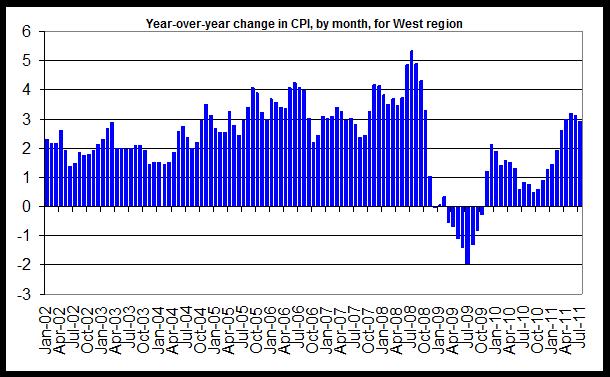
The second graph shows year-over-year changes in CPI for all months since 2002. CPI growth has fallen slightly during the last two months in the region, although current growth rates remain near post-recession highs.
Rents and housing costs make up a significant portion of the CPI and recent growth in rental-housing costs to consumers across much of Colorado has contributed to growth in housing prices as recorded in the CPI. On the other hand, the cost of purchase housing has been stable or declining in many areas of Colorado. See here for recent home price information.