According to the Case-Shiller report including data up through April, many cities measured by the index showed improvement from March to April, reflecting seasonal factors, but also showing some of the largest improvements in several months:
Data through April 2011, released today by S&P; Indices for its S&P;/CaseShiller
1 Home Price Indices, the leading measure of U.S. home prices, show a monthly increase in prices for the 10- and 20-City Composites for the first time in eight months. The 10- and 20-City Composites were up 0.8% and 0.7%, respectively, in April versus March. Both indices are lower than a year ago; the 10-City Composite fell 3.1% and the 20-City Composite is down 4.0% from April 2010 levels. Six of the 20 MSAs showed new index lows in April - Charlotte, Chicago, Detroit, Las Vegas, Miami and Tampa.
In year-over-year comparisons for March, Minneapolis showed the largest drop, with a decline of 10.0 percent, while the index in Phoenix fell 8.4 percent. Home price indices fell in 19 of the 20 cities included in the study.
The first chart shows trends in the Case-Shiller index for the Denver area and for the 20-city composite index. It is clear that Denver did not experience the kind of price bubble that occurred in many other metropolitan areas, and consequently, the index has not fallen nearly as far in Denver compared to the larger composite. Prices have been largely flat since mid-2009.
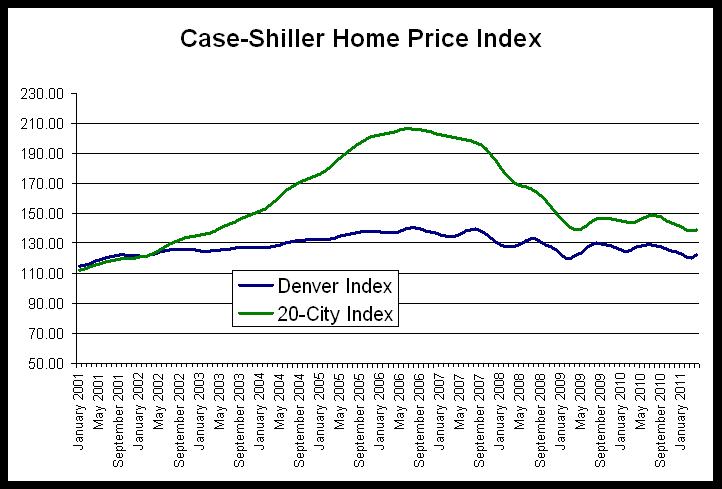
The 20-city composite is down 32.8 percent since it peaked in July 2006, but the Denver index is down only 12.8 percent from its August 2006 peak.
Nevertheless, the Denver index has returned to 2001 levels. In addition, the Denver Index remains near the lowest level experienced since March 2009, and is now only 1.7 percent above where it was when it hit its initial recessionary trough in March 2009. The Denver Index was 122.32 during April 2011, and it was 120.39 during March 2009.
The second chart compares year-over-year changes in the Denver area index and in the 20-city composite. The Denver index did not achieve the rates of growth experienced by the national index, but the Denver index did not experience comparable rates of decline following the onset of the national recession either. Overall, the index has been less volatile in Denver than has been the case for the 20-city composite. However, year-over-year growth in the 20-city composite during April was negative with a decrease of 4.0 percent, and the Denver area index’s fall of 4.1 percent is the tenth month in a row in which the growth rate has been negative. In the 20-city index, the year-over-year change has only been negative for the most recent seven months.
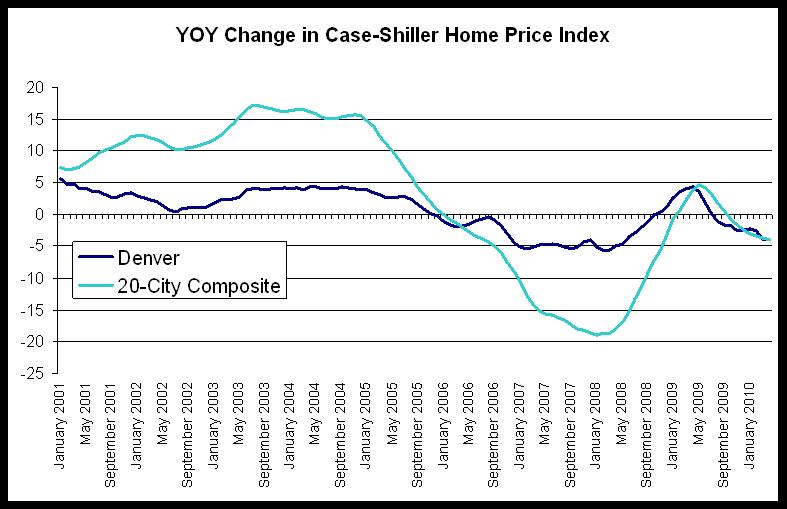
The year-over-year change of -4.1 percent for the Denver index in April marks the largest year-over-year decline in 24 months. The Denver index has not fallen by more than 4.1 percent since May 2009 when the year-over-year change was -4.5 percent.
The last chart provides a closer look at year-over-year changes in the Denver index. Note that for July through April, the change has fallen below zero, and likely reflects the end of the homebuyer tax credit’s end which has led to a fall in demand and a decline in the home price index. The upward trend in the index in response to the tax credit is clear during late 2009 and early 2010.
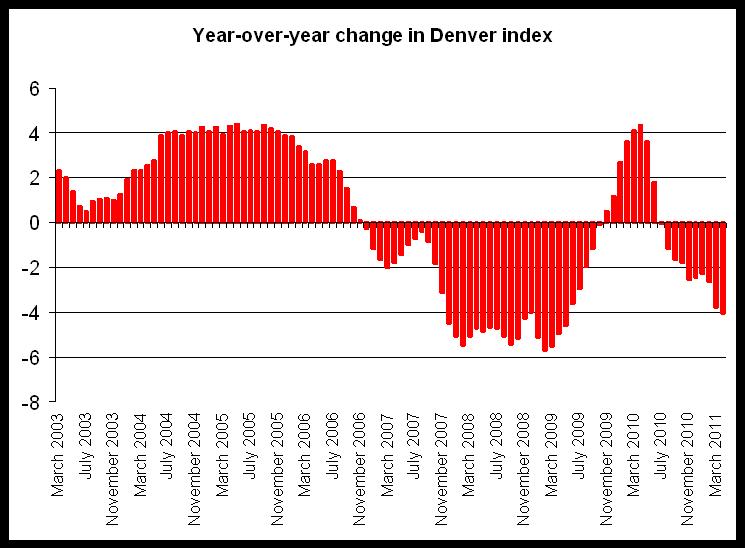
The chart shows that from July 2010 through April 2011, the home price index has been below the index for the same period a year earlier (July 2009 through April 2010). Given that 2009 was itself a weak year for home sales, this data does not suggest a speedy rebound for home prices.
0 comments:
Post a Comment