In the first graph, we can see that the CPI growth in June 2011 is now at the third-highest increase observed for June during the past ten years. Only 2006 and 2008 showed larger increases, and price increases in those years were partially countered by strong growth in employment and incomes, but at the present time, income growth has been flat in recent years, as discussed here.
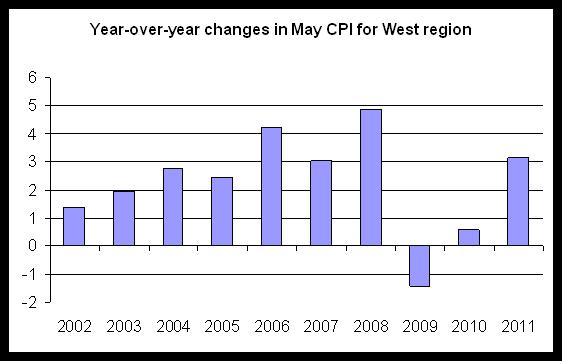
The price increases are being largely driven by transportation costs, such as gasoline, which increased by 10.2 percent, year over year. Food costs also increased significantly, rising 3.6 percent. Price increases in housing have begun to inch up with June's year-over-year increase at 1.2 percent. Housing costs to consumers will likely move upward as rent increases in the face of building demand and little new construction.
Recent price increases will impact household calculations and attitudes on spending as many households conclude that discretionary spending will need to be scaled back in the face of increasing food and transportation costs. These price increases come in the face of continued lackluster performance in the labor markets. The most recent regional data, shown here, showed a surge in layoffs and a decline in new hires.
This in turn will have effects on home purchase activity as well. Note: In addition to the issue of disposable income is the issue of interest rates. Should the Federal Reserve conclude that inflation does need to be addressed, the resulting increase in interest rates would also push down home purchase activity. On the other hand, a slowing job market would produce deflationary effects, which would push the fed toward additional monetary easing.
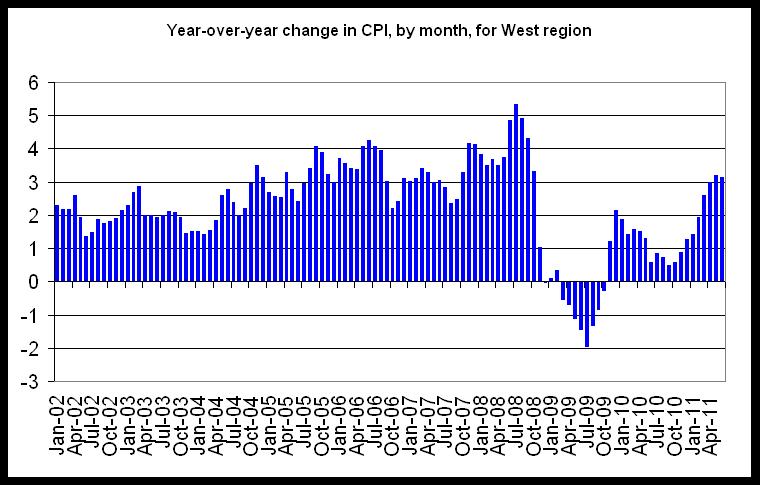
The second graph shows year-over-year changes in CPI for all months since 2002. If current trends continue, CPI growth will return to pre-recession levels in coming months.
0 comments:
Post a Comment