According to the Case-Shiller report,
The National Index hit a new recession low with the first quarter’s data and posted an annual decline of 5.1% versus the first quarter of 2010. Nationally, home prices are back to their mid-2002 levels. As of March 2011, 19 of the 20 MSAs covered by S&P;/Case-Shiller Home Price Indices and both monthly composites were down compared to March 2010. Twelve of the 20 MSAs and the 20-City Composite also posted new index lows in March. With an index value of 138.16, the 20-City Composite fell below its earlier reported April 2009 low of 139.26. Minneapolis posted a double-digit 10.0% annual decline, the first market to be back in this territory since March 2010 when Las Vegas was down 12.0% on an annual basis. In the midst of all these falling prices and record lows, Washington DC was the only city where home prices increased on both a monthly (+1.1%) and annual (+4.3%) basis. Seattle was up a modest 0.1% for the month, but still down 7.5% versus March 2010
In year-over-year comparisons for March, Minneapolis showed the largest drop, with a decline of 10.0 percent, while the index in Phoenix fell 8.4 percent. Home price indices fell in 19 of the 20 cities included in the study.
The first chart shows trends in the Case-Shiller index for the Denver area and for the 20-city composite index. It is clear that Denver did not experience the kind of price bubble that occurred in many other metropolitan areas, and consequently, the index has not fallen nearly as far in Denver compared to the larger composite. Prices have been largely flat since mid-2009, but continue a slow trend downward.
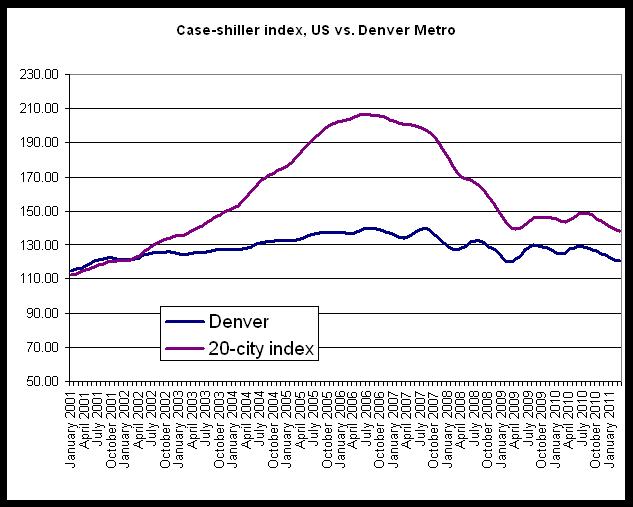
The 20-city composite is down 33 percent since it peaked in July 2006, but the Denver index is down only 14 percent from its August 2006 peak.
Nevertheless, the Denver index has returned to 2001 levels. In addition, the Denver Index is now at the lowest level experienced since March 2009, reaching a 25-month low, and is now essentially where it was when it hit its initial recessionary trough. The Denver Index was 120.55 during March 2011, and it was 120.39 during March 2009.
The second chart compares year-over-year changes in the Denver area index and in the 20-city composite. The Denver index did not achieve the rates of growth experienced by the national index, but the Denver index did not experience comparable rates of decline following the onset of the national recession either. Overall, the index has been less volatile in Denver than has been the case for the 20-city composite. However, year-over-year growth in the 20-city composite during March was negative with a decrease of 3.6 percent, and the Denver area index’s fall of 3.8 percent is the ninth month in a row in which the growth rate has been negative. In the 20-city index, the year-over-year change has only been negative for the most recent six months.
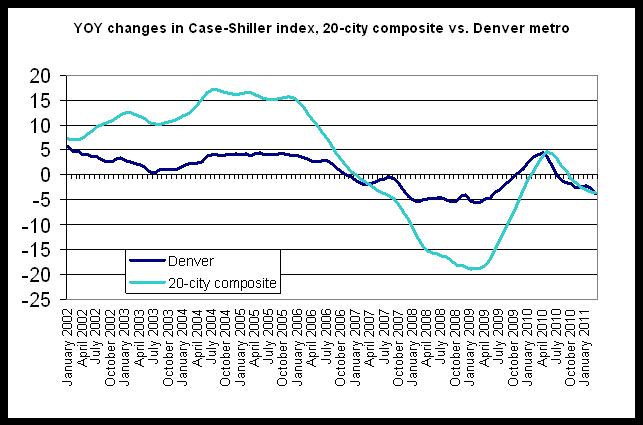
The year-over-year change of -3.8 percent for the Denver index in March marks the largest year-over-year decline in 23 months. The Denver index has not fallen by more than 3.8 percent since May 2009 when the year-over-year change was -4.5 percent.
The last chart provides a closer look at year-over-year changes in the Denver index. Note that for July through March, the change has fallen below zero, and likely reflects the end of the homebuyer tax credit’s end which has led to a fall in demand and a decline in the home price index. The upward trend in the index in response to the tax credit is clear during late 2009 and early 2010.
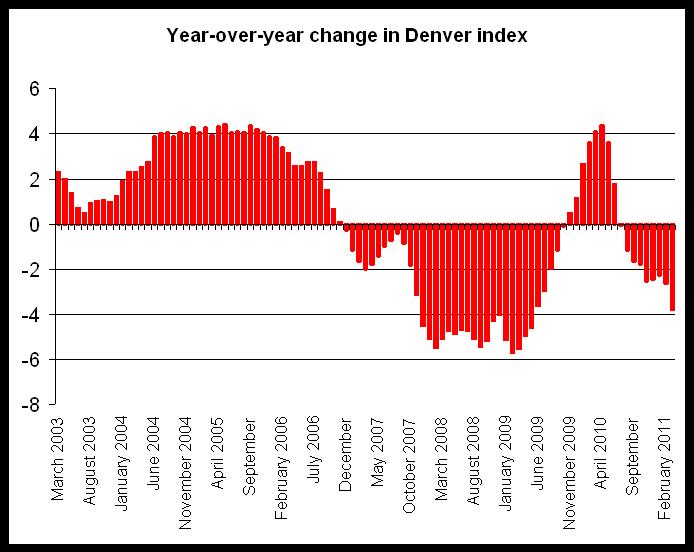
The chart shows that from July 2010 through March 2011, the home price index has been below the index for the same period a year earlier (July 2009 through January 2010). Given that 2009 was itself a weak year for home sales, this data does not suggest a speedy rebound for home prices.
0 comments:
Post a Comment