According to S&P;'s press release, there is also some good news:
“In the August data, the good news is continued improvement in the annual rates of change in home prices. In spring and summer’s seasonally strong period for housing demand, we cautioned that monthly increases in prices had to be paired with improvement in annual rates before anyone could declare that the market
might be stabilizing. With 16 of 20 cities and both Composites seeing their annual rates of change improve in August, we see a modest glimmer of hope with these data. As of August 2011, the crisis low for the 10- City Composite was back in April 2009; whereas it was a more recent March 2011 for the 20-City Composite. Both are about 3.9% above their relative lows.
In year-over-year comparisons for August, Minneapolis showed the largest drop, with a decline of 8.5 percent, while the index in Phoenix fell 7.7 percent. Year over year, home price indices fell in 18 of the 20 cities included in the study. Only Washington, DC and Detroit showed increases.
The second chart shows trends in the Case-Shiller index for the Denver area and for the 20-city composite index. It is clear that Denver did not experience the kind of price bubble that occurred in many other metropolitan areas, and consequently, the index has not fallen nearly as far in Denver compared to the larger composite. Prices have been largely flat since mid-2009.
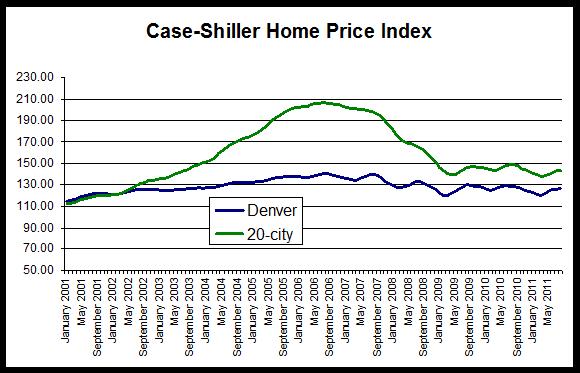
The 20-city composite is down 30.8 percent since it peaked in July 2006, but the Denver index is down only 9.8 percent from its August 2006 peak.
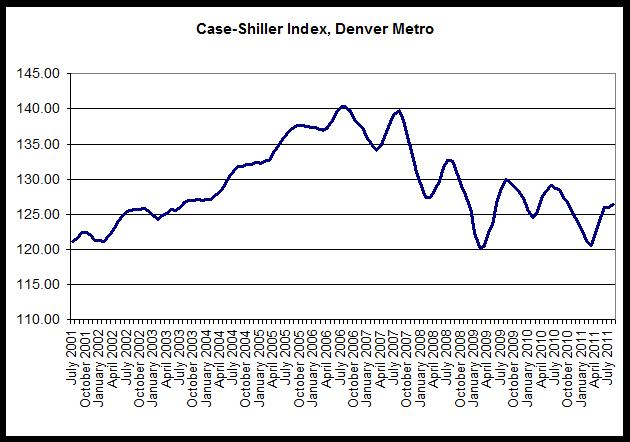
Nevertheless, the Denver index during August was at the lowest August value seen since 2003.
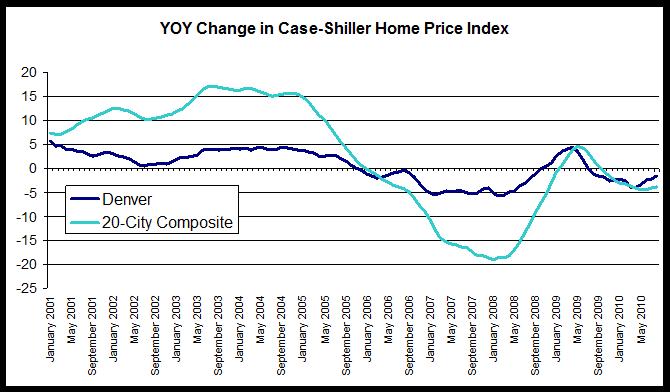
The third chart compares year-over-year changes in the Denver area index and in the 20-city composite. The Denver index did not achieve the rates of growth experienced by the national index, but the Denver index did not experience comparable rates of decline following the onset of the national recession either. Overall, the index has been less volatile in Denver than has been the case for the 20-city composite. However, year-over-year growth in the 20-city composite during August was negative with a decrease of 3.8 percent, and the Denver area index’s fall of 1.6 percent is the 14th month in a row in which the growth rate has been negative. In the 20-city index, the year-over-year change has been negative for the most recent 11 months.
The last chart provides a closer look at year-over-year changes in the Denver index. Note the the change has been below zero since June 2010, and likely reflects the end of the homebuyer tax credit’s end which has led to a fall in demand and a decline in the home price index. The upward trend in the index in response to the tax credit is clear during late 2009 and early 2010.
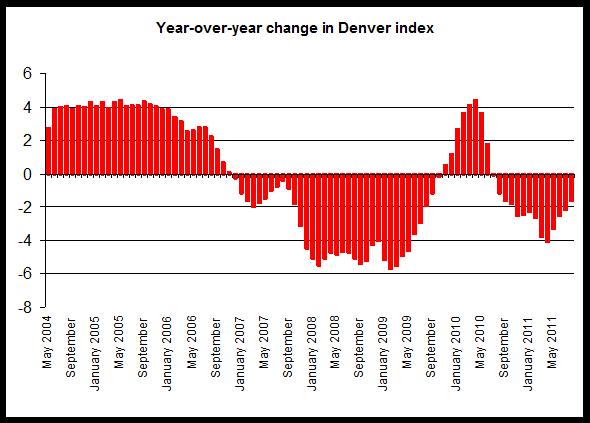
The chart shows that from July 2010 through August 2011, the home price index has been below the index for the same period a year earlier (July 2009 through January 2010). Given that 2009 was itself a weak year for home sales, this data does not suggest a speedy rebound for home prices.
0 comments:
Post a Comment