Overall, the March data shows that home prices have stabilized, however in light of recent Case-Shiller report showing slow and ongoing declines in prices, it is likely that overall, prices in the Denver metro continue to fall at a slow and measured pace.
With the March data, we now have almost a full year of data showing trends since the end of the home purchase tax credit ended. In that time, home prices appear to have largely flattened, although the trend in the number of home sales transactions is less clear.
All of the data analyzed in this entry is for single-family homes.
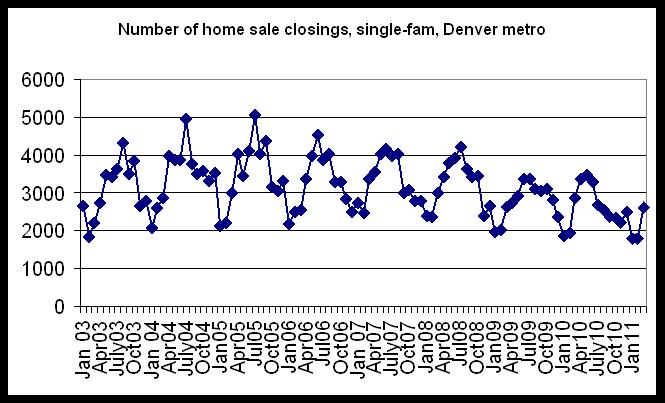
The first graph shows the total number of home sales closings in the metro Denver area (excluding Boulder). In March 2011, there were 2,597 which is the smallest March total for closings since March 2003 when there were 2,222 closings. The number of closings in March was up substantially from February, which was expected and in line with seasonal trends.
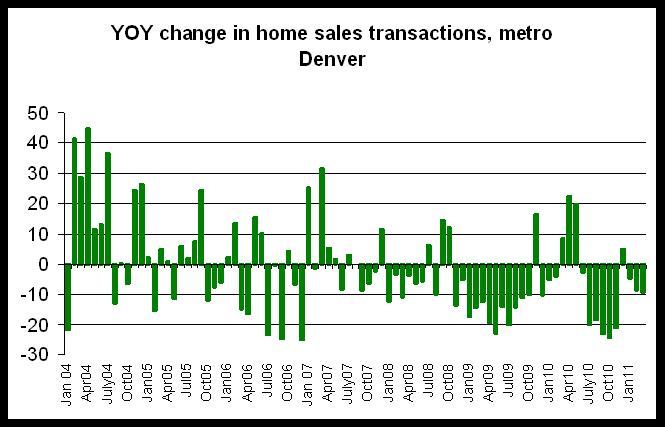
The second graph shows the year-over-year comparisons in home sales closings. The number of home sales in March 2011 was down 9.1 percent from March 2010's total of 2,857. March 2010's total was actually quite high compared to most March totals of the past, and this reflected activity spurred by the homebuyer tax credit that was in place at the time.
Only 5 of the last 24 months have shown positive year-over-year comparisons in home sales closings, which has undoubtedly put downward pressure on median home prices, although the relatively low number of buyers during this period has provided numerous opportunities for bargain-hunting among those looking to buy single-family homes.
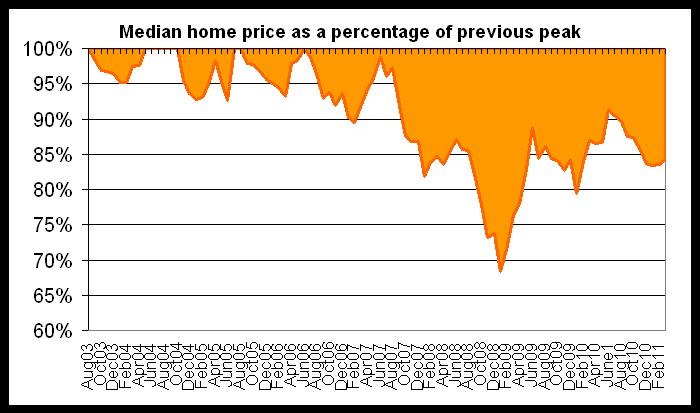
The third chart shows how far median home prices are below the most recent peak. The median home price in metro Denver most recently leaked at $263,000 during June 2006. Since then, the median home price initially bottomed-out at 68% of the peak price during January 2009. During March 2011, the median home price of $224,000 was at 84% of the peak price.
The median home price has largely been flat since December 2010.
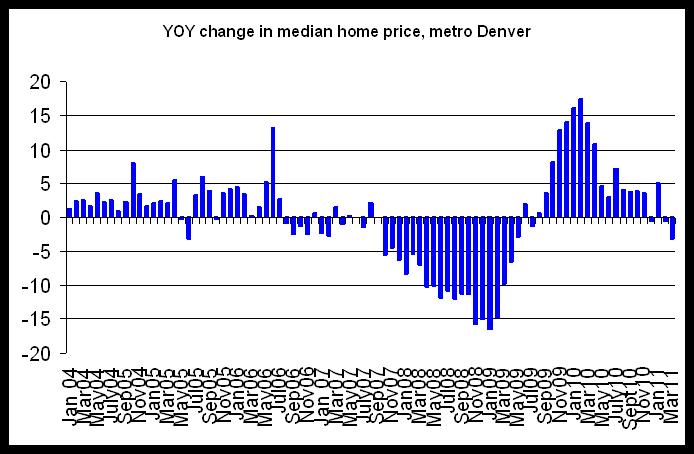
The last chart shows the year over year change in the median home price in metro Denver. Only 6 of the last 24 months have shown negative changes when compared to the same month the previous year. Given the falling number of homes sales transactions during this period, this is a surprising amount of stability in home prices.
Nevertheless, the year-over-year change for March was -3.2% which is a fall from the tax-credit-inflated price from March 2010. Year over year changes still reflect the market's return to "natural" conditions following the end of the tax credit. We'll know more about prices once we're able to make annual comparisons in which neither month was directly affected by the tax credit.
These are all metro-wide numbers, of course and should not be applied to any specific neighborhood.
All of these graphs show activity through March 2011.