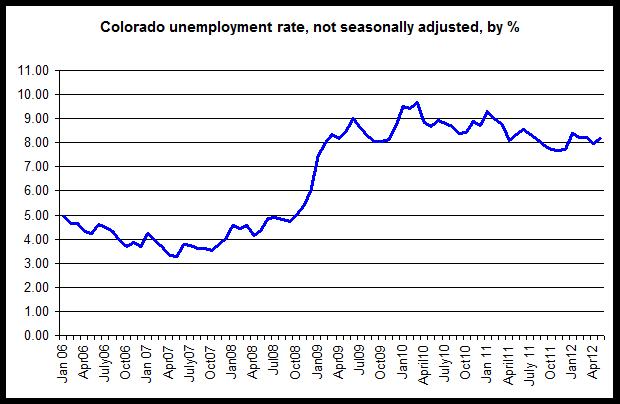
In month-to-month comparisons, the unemployment rate rose from 8.0 percent during April 2012 to 8.2 percent during May. 21,100 jobs were added month-over-month while 29,800 people joined the work force over the same period.
From May 2011 to May 2012, total employment rose 0.7 percent while the labor force rose 0.8 percent. The total labor force in May included 2.72 million workers.
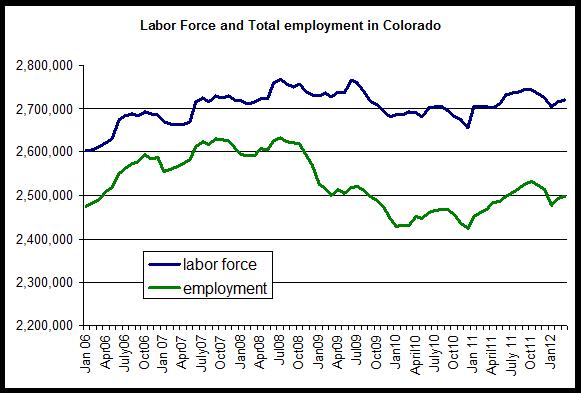
As can be seen in the second graph, total employment and total workforce size have risen, month-over-month, after a series of ups and downs in recent months. Year over year, both employment and the labor force grew. Since employment grew more than the labor force, the unemployment rate fell. However, both remain well below July 2008 peaks.
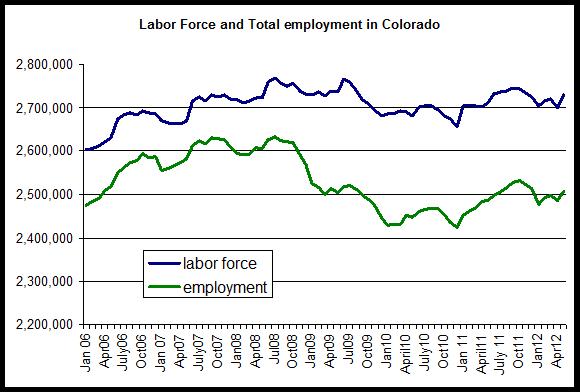
The employment total is now 126,000 jobs below the peak levels experienced during July 2008 when there were 2.63 million employed workers. Compared to the labor force peak in July 2008, the labor force is now down by 37,900 workers.
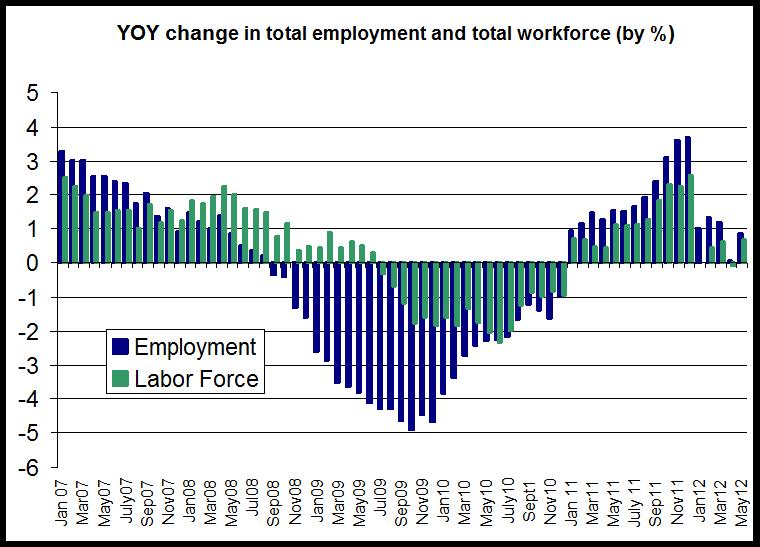
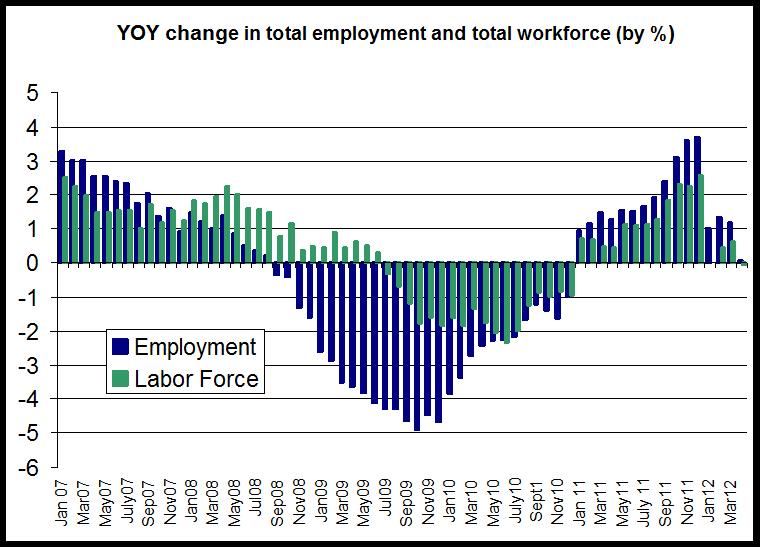
In the third graph is shown the year-over-year comparisons, by percent, for total employment. May 2012 was the 17th month in a row showing a positive year-over-year change in total employment, although May showed the second-smallest year-over-year increase in employment of any month this year. The 17 months of increases followed 28 months in a row of negative job growth in year-over-year comparisons.
The graph also shows the year-over-change in the labor force. Total labor force size rose from May 2011 to May 2012 and follows 1 month of year-over-year decline in the labor force during April 2012. The labor force size had shrunk, year over year, for 18 months in a row from July 2009 to December 2010.
These numbers come from the Household Survey employment data, so the size of the workforce is dependent on the number of people stating that they are actively looking for work if not employed. Discouraged workers who have stopped looking for work are excluded. On the other hand, the Household Survey picks up on small business and start-up employment that may be missed by the Establishment Survey, the other commonly-used measure of employment.
Note: This analysis reflects newly revised data released in January. In most cases, total employment was revised upward for the months of 2011.