According to S&P;'s press release, home prices are still facing headwinds and have "not yet stabilized":
“After a prior three years of accelerated decline, the past two years has been a story of a housing market that is bottoming out but has not yet stabilized. Up until today’s report we had believed the crisis lows for the composites were behind us, with the 10-City Composite originally hitting a low in April 2009 and the 20-City Composite in March 2011. Now it looks like neither was the case, as both hit new record lows in December 2011. The National Composite fell by 3.8% in the fourth quarter alone, and is down 33.8% from its 2nd quarter 2006 peak. It also recorded a new record low.
In year-over-year comparisons for December, Atlanta showed the largest drop, with a decline of 12.8 percent, while the index in Las Vegas fell 8.8 percent. Year over year, home price indices fell in 19 of the 20 cities included in the study. Only Detroit showed increases.
The second chart shows trends in the Case-Shiller index for the Denver area and for the 20-city composite index. It is clear that Denver did not experience the kind of price bubble that occurred in many other metropolitan areas, and consequently, the index has not fallen nearly as far in Denver compared to the larger composite. Prices have been largely flat since mid-2009.
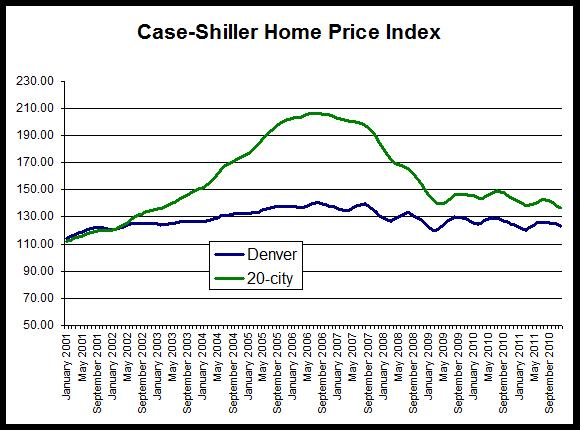
The 20-city composite is down 34 percent since it peaked in July 2006, but the Denver index is down only 12 percent from its August 2006 peak.
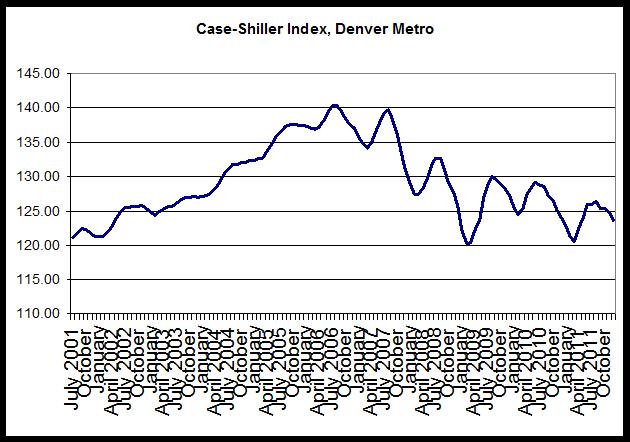
Nevertheless, the Denver index during December was at the lowest December value seen since 2001.
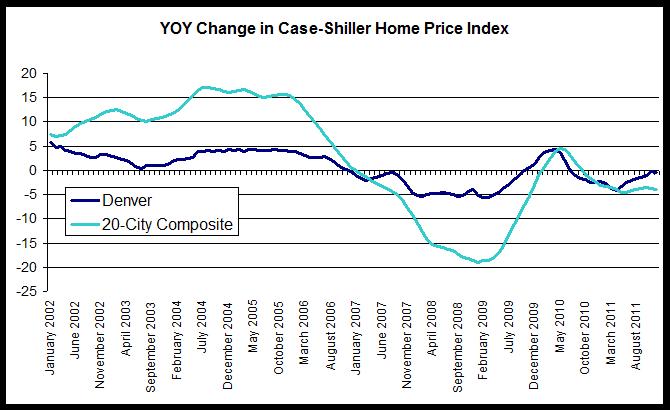
The third chart compares year-over-year changes in the Denver area index and in the 20-city composite. The Denver index did not achieve the rates of growth experienced by the national index, but the Denver index did not experience comparable rates of decline following the onset of the national recession either. Overall, the index has been less volatile in Denver than has been the case for the 20-city composite, and the rates of decline in Denver have been smaller in recent months. However, year-over-year growth in the 20-city composite during December was negative with a decrease of 4 percent, and the Denver area index’s fall of 0.9 percent is the 18th month in a row in which the growth rate has been negative. In the 20-city index, the year-over-year change has been negative for the most recent 15 months.
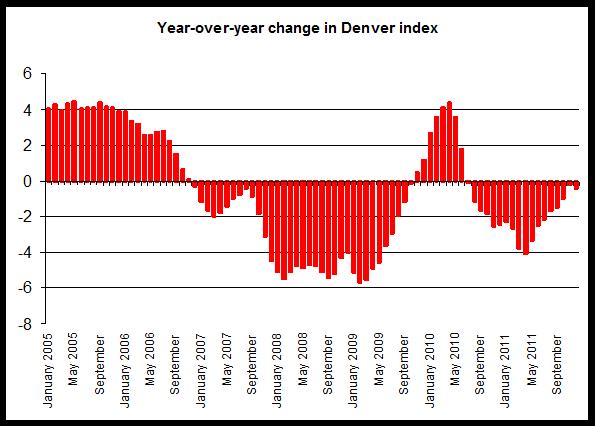
The last chart provides a closer look at year-over-year changes in the Denver index. Note the the change has been below zero since June 2010, and likely reflects the end of the homebuyer tax credit’s end which has led to a fall in demand and a decline in the home price index. The upward trend in the index in response to the tax credit is clear during late 2009 and early 2010. Since the end of the credit, however, home prices have consistently drifted downward.