In the first graph, we can see that the CPI growth in December 2011 was the largest annual change for December since 2007, prior to the financial crisis of 2008. 2004 through 2007 showed higher annual changes, reflecting much more robust economic growth during that period.
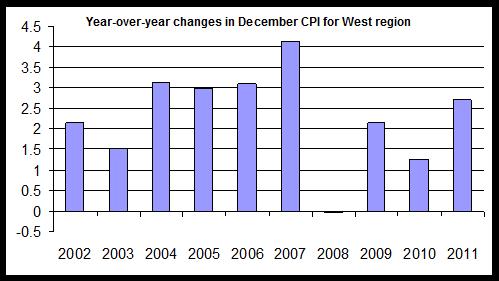
The price increases are being largely driven by transportation costs, such as gasoline. Transportation prices increased by 4.5 percent, year over year. Food costs and apparel also increased significantly, rising 4.1 percent and 3.8 percent, respectively.
Housing prices were restrained at a year-over-year increase of 1.8 percent. Although increases in rent have exceeded 5 percent in many areas of the state, the housing component of CPI also reflects declining home prices, which indirectly mitigate the increases in rent levels within the index.
Recent price increases will impact household calculations and attitudes on spending as many households conclude that discretionary spending will need to be scaled back in the face of increasing food and transportation costs.
This in turn will have effects on home purchase activity as well. Note: In addition to the issue of disposable income is the issue of interest rates. Should the Federal Reserve conclude that inflation does need to be addressed, the resulting increase in interest rates would also push down home purchase activity. (Recent declines in the mortgage rate have not spurred large amounts or refinance or purchase activity, as noted in the Division of Housing's analysis of releases of deeds of trust.
Last Friday, CNBC reported that the Fed's FOMC is seriously considering more quantitative easing which could spur additional inflation.
The second graph shows year-over-year changes in CPI for all months since 2002. If current trends continue, CPI growth has generally stalled around 3 percent since March 2011
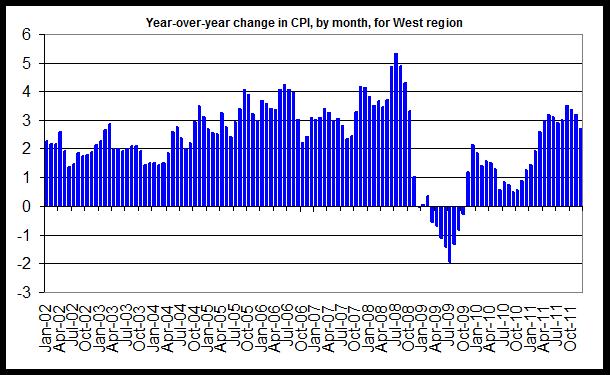
Nationally, the CPI was unchanged for the third month in a row:
The Consumer Price Index for All Urban Consumers (CPI-U) was unchanged in December on a seasonally adjusted basis, the U.S. Bureau of Labor Statistics reported today. Over the last 12 months, the all items index increased 3.0 percent before seasonal adjustment.
Similar to last month, the energy index declined in December and offset increases in other indexes. The gasoline index declined for the third month in a row and the household energy index declined as well.The food index rose in December, with the index for food at home turning up after declining last month.
0 comments:
Post a Comment