According to the May report from the S&P;/Case-Shiller Home Price Index, including data up through May, many cities measured by the index showed improvement from April to May. The increase largely reflects seasonal factors.
The report noted that there were signs of life in the industry, but that annual comparisons still showed some hesitancy in the markets:
“Other recent housing statistics show that single-family housing starts were up moderately in June, and are at about the same pace as a year ago. Existing-home sales were flat in June, reportedly because of contract cancellations and tight credit. The S&P;/Experian Consumer Credit Default indices showed a continuing decline in mortgage default rates since last winter. Other reports confirm that banks have tightened lending standards in the past year, making it harder to qualify for a mortgage despite very low interest rates.
Combined, these data all support a continuation of the ‘bounce-along-the-bottom’ scenario we have witnessed in the housing market over the past two years. “While the monthly data were encouraging, most MSAs and both Composites fared poorly in annual terms.
In terms of year-over-year comparisons, Denver's market showed a less-small decrease than all but four of the 20 cities measured in the index. Only Washington, D.C. showed a positive increase, with the index rising 1.3 percent. The index dropped in all other cities. Boston, Los Angeles and New York showed slightly smaller declines than Denver, with all three cities' indices falling 3.2 percent.
Phoenix and Tampa reported the largest declines, with the home price index in both cities dropping 9.5 percent.
The first chart shows trends in the Case-Shiller index for the Denver area and for the 20-city composite index. It is clear that Denver did not experience the kind of price bubble that occurred in many other metropolitan areas, and consequently, the index has not fallen nearly as far in Denver compared to the larger composite. Prices have been largely flat since mid-2009.
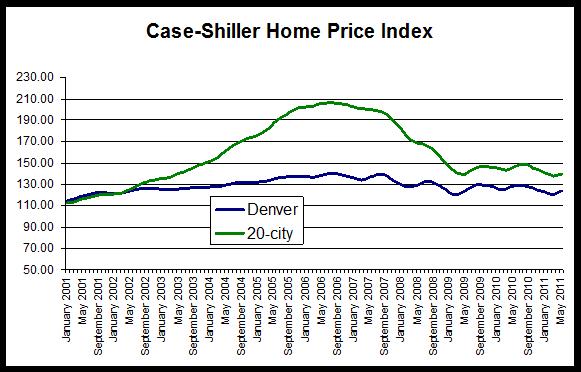
The 20-city composite is down 32.3 percent since it peaked in July 2006, but the Denver index is down only 11.6 percent from its August 2006 peak.
Nevertheless, the Denver index has returned to 2003 levels. In addition, the Denver Index remains near the lowest level experienced since July 2009, and is now 3.1 percent above where it was when it hit its initial recessionary trough in March 2009. The Denver Index was 124.00 during May 2011, and it was 123.78 during May 2009.
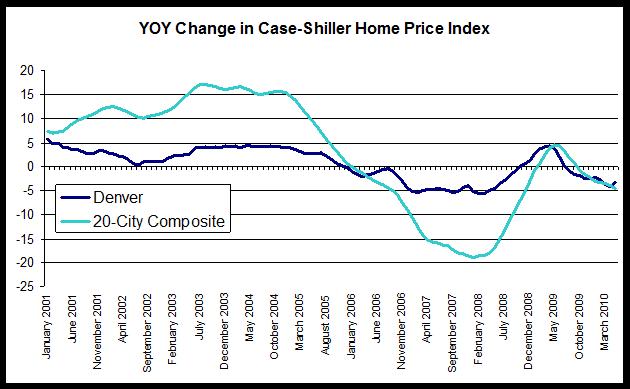
The second chart compares year-over-year changes in the Denver area index and in the 20-city composite. The Denver index did not achieve the rates of growth experienced by the national index, but the Denver index did not experience comparable rates of decline following the onset of the national recession either. Overall, the index has been less volatile in Denver than has been the case for the 20-city composite. However, year-over-year growth in the 20-city composite during May was negative with a decrease of 4.0 percent, and the Denver area index’s fall of 3.3 percent is the eleventh month in a row in which the growth rate has been negative. In the 20-city index, the year-over-year change has only been negative for the most recent eight months.
The last chart provides a closer look at year-over-year changes in the Denver index. Note that for July through May, the change has fallen below zero, and reflects the end of the homebuyer tax credit’s end which has led to a fall in demand and a decline in the home price index. The upward trend in the index in response to the tax credit is clear during late 2009 and early 2010.
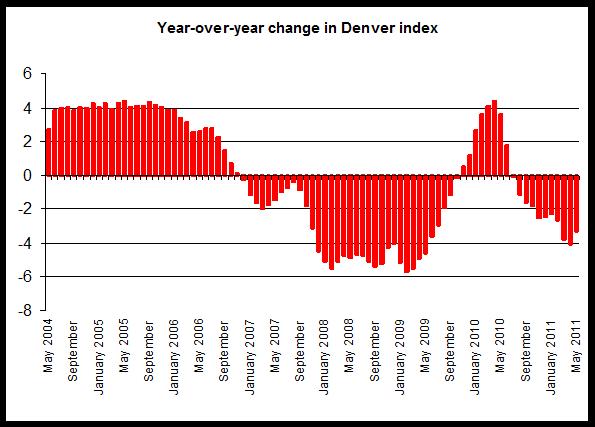
In recent months, the Denver index has been slightly above the indices for the same months of 2009. Comparisons with the same period of 2010 is problematic given the large effects of the end of the tax credit. Comparing to 2009, we see that prices have still moved little since the first half of 2009 when the index was in the 120-123 range. During the first half of 2011, the Denver index has been in the 122-124 range, signalling very limited growth over the past two years.
0 comments:
Post a Comment