We'll begin by looking at the latest numbers for the Metro Denver area.
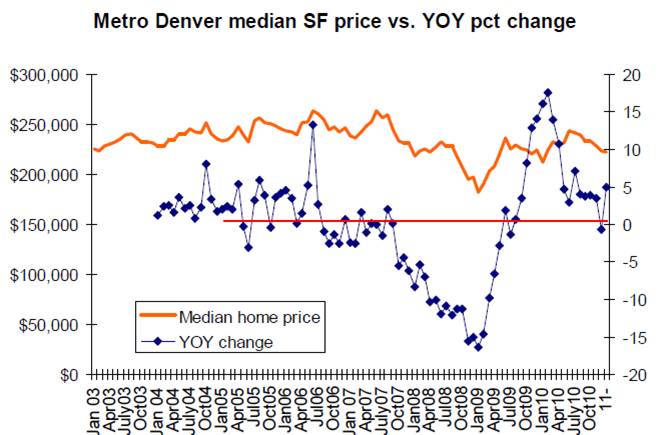
According to CAR's data, the median single-family home price in metro Denver was up 5 percent in January, compared to January 2010, increasing from $212,072 to $222,677. The first graph, below, provides a little context for this price. We can see that prices have recovered somewhat from the trough reached in late 2008 and early 2009. Just prior to the financial panic, the median price was generally in the range of 230K to 250K, but during the last 24 months, the price has more typically ranged from $210K to $230.
The graph also shows the year-over-year change in single-family home prices. We can see that over the past nine months, the price has been quite stable, generally showing a year-over-year monthly increase of 3 to 5 percent, with the exception of December 2010, when prices declined slightly, year-over-year.
This suggests general stability in the market. However, we need to consider this price data in light of the single-family home price data provided by Case-Shiller (see here) and FHFA (see here) for the metro Denver area. In both the Case-Shiller and the FHFA data, home prices have been decreasing, year-over-year in metro Denver by about 1 percent to 2.5 percent in recent months. The CAR data does not take into account appraisals and does not use the double-transaction method used by FHFA and Case-Shiller, so the data will have some differences. So, it is unlikely that prices in Denver are actually increasing overall by 3 to 5 percent in year-over-year comparisons, but the CAR data does provide additional evidence for the contention that prices in the region are generally stable.
The second and third chart shows trends in single-family purchase activity. The number of single-family purchases has a cyclical pattern, so month-to-month comparisons aren't terribly useful. Comparing year-over-year, January's transactions total was down 4.5 percent from January 2010, suggesting some continued weakness in the market following the end of the homebuyer tax credit.
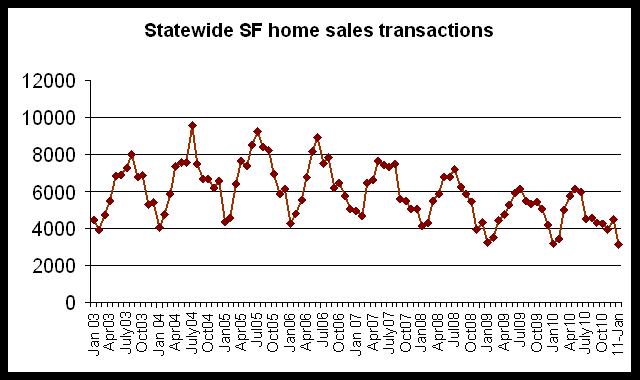
Nevertheless, as we can see in the third graph, January's 4.5 percent decline is a bit of an improvement (from the seller's perspective) compared to the second half of 2010, when monthly year-over-year declines were often down by 20 percent or more. Seven of the last eight months showed a decline in single-family home sales transactions when compared to the previous year.

The decline in transactions would suggest that a decline in home sales prices would follow. We see this in the first graph which shows that the median home price has fallen, month-to-month since June. Some of this is undoubtedly due to seasonal factors, however.
Check back for more information on Northern Colorado, the Pikes Peak region and more.