According to the Case-Shiller report, released today by Standard and Poor's, and containing data up through January, 14 of the 20 metro areas measured by the report showed larger declines than the Denver area. The report shows a general decline in home prices across the nation, with only two metropolitan areas, San Diego and Washington, DC, showing increases in home prices over the past year. According to the Case-Shiller press release:
“Keeping with the trends set in late 2010, January brings us weakening home prices with no real hope in sight for the near future” says David M. Blitzer, Chairman of the Index Committee at Standard & Poor's. “With this month’s data, we find the same 11 MSAs posting new recent index lows. The 10-City and 20-City Composites continue to decline month-over-month and have posted monthly declines for six consecutive months now.
In year over year comparisons for January, Phoenix showed the largest drop, with a decline of 9.1 percent, while the index in Detroit fell 8.1 percent. The index rose the most in Washington, DC where it increased 3.6 percent, year over year. The index also rose 0.1 percent in San Diego. Home price indices fell in 18 of the 20 cities included in the study.
The first chart shows trends in the Case-Shiller index for the Denver area and for the 20-city composite index. It is clear that Denver did not experience the kind of price bubble that occurred in many other metropolitan areas, and consequently, the index has not fallen nearly as far in Denver compared to the larger composite. Prices have been largely flat since mid-2009, but continue a slow trend downward.
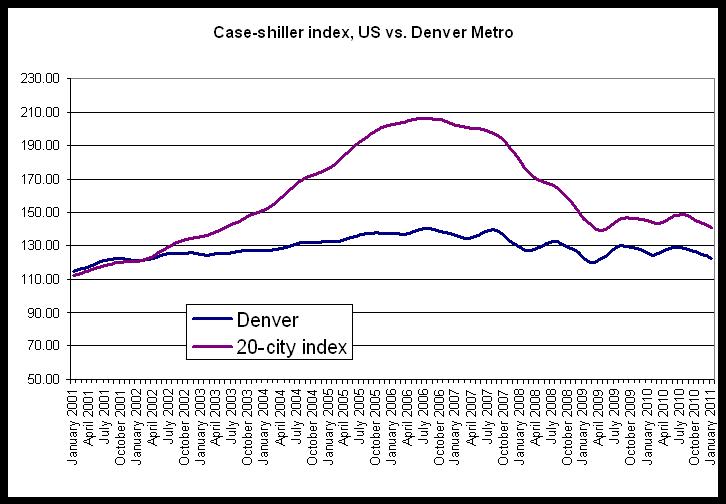
The 20-city composite is down 31.8 percent since it peaked in July 2006, but the Denver index is down only 12.5 percent from its August 2006 peak.
The second chart compares year-over-year changes in the Denver area index and in the 20-city composite. The Denver index did not achieve the rates of growth experienced by the national index, but the Denver index did not experience comparable rates of decline following the onset of the national recession either. Overall, the index has been less volatile in Denver than has been the case for the 20-city composite. Year-over-year growth in the 20-city composite during January was negative with a decrease of 2.3 percent. The Denver area index’s fall of 2.3 percent is the seventh month in a row in which the growth rate has been negative. In the 20-city index, on the other hand, the year-over-year change has only been negative for the most recent four months.
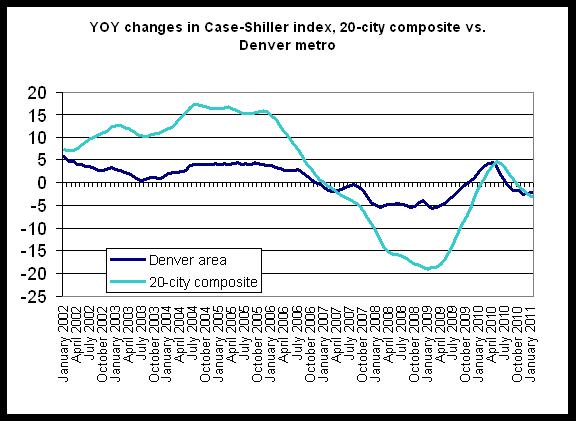
While Denver’s index has been largely stable, note that for the previous 24 months, only 8 months have shown a positive year-over-year change.
The last chart compares the actual index value for the Denver area with the year-over-year change. Note that for July through December, the change has fallen below zero, and likely reflects the end of the homebuyer tax credit’s end which has translated into a fall in demand and a decline in the home price index. The upward trend in the index in response to the tax credit is clear during late 2009 and early 2010. In at least three separate measures of home prices - Case-Shiller, REALTOR, and FHFA data - Colorado and its metro areas have shown continued weakness in the home purchase markets.
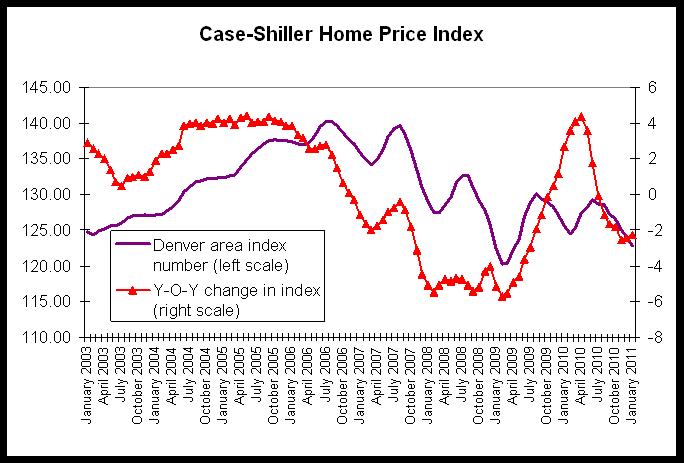
The chart shows that from July 2010 through January 2011, the home price index has been below the index for the same period a year earlier (July 2009 through January 2010). Given that 2009 was itself a weak year for home sales, this data does not suggest a speedy rebound for home prices.